How to Review a Cannabis Batch After Harvest: The Post-Run Checklist
Every guide about cannabis cultivation ends at harvest. Cut, dry, cure, ship. The room gets cleaned, the next batch flips in, and the cycle starts over. What almost never happens: a structured review of what the data actually shows before the details fade.
That gap is expensive. Not in a dramatic, obvious way. In the slow, invisible way where the same patterns keep recurring because nothing captured them. The nutrient adjustment you made in week 5 that seemed to help. The VPD excursion during stretch that may have cost you density. The canopy uniformity in zone 2 that was noticeably tighter than last cycle. All of that lives in memory until it doesn’t.
The highest-return hour in your cannabis operation isn’t the one spent dialing in your environment. It’s the one spent reviewing what the data shows after the run completes. Here’s the framework.
Step 1: Capture the Numbers Before They Disappear
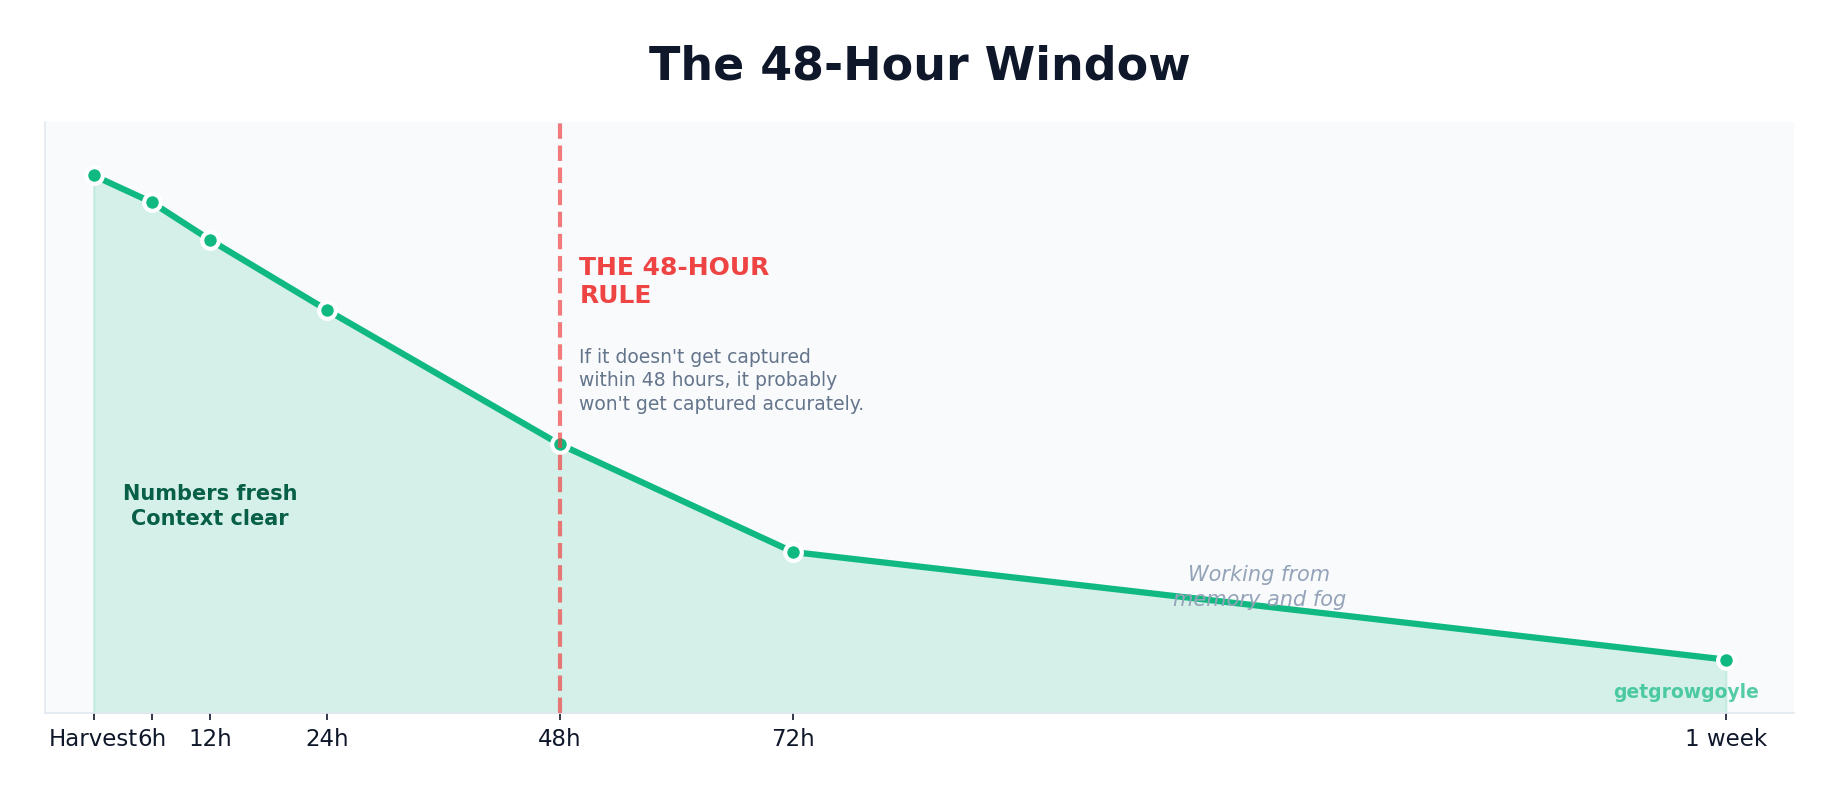
There’s a 48-hour window after harvest where the critical numbers are still accessible and the context is still fresh. After that, you’re working from memory or hunting through spreadsheets you may or may not have maintained consistently.
The core numbers to capture from every cannabis batch:
- Dry weight per zone and per light
- Total cycle time (clone-in to harvest date)
- Lab results: THC%, terpene profile, moisture content
- Water activity (Aw) at cure completion
- Trim yield and waste percentage
Yield per light is the number that matters most for tracking your operation over time. Yield per square foot gets used as a marketing metric, but it doesn’t tell you what the economics actually look like. Yield per square foot is a vanity metric. Yield per light, tracked across every run, shows whether the operation is actually improving.
Log these numbers the same day you pull weight. Not tomorrow. Not at the end of the week. The 48-hour rule: if it doesn’t get captured within 48 hours of harvest, it probably won’t get captured accurately at all. Flip to a new run and the previous one’s details go soft fast.
Step 2: Review the Environmental Record
Numbers don’t tell the full story unless you look at variance, not just averages. A room that averaged 1.2 VPD looks identical on paper to a room that swung between 0.8 and 1.6 but averaged out to 1.2. Those are not the same room, and the canopy knows the difference.
What to pull and review from the environmental record:
- Temperature and humidity averages vs. targets, broken out by phase
- VPD consistency: average and range (standard deviation if you have it)
- DLI if you’re tracking it
- CO2 during lights-on periods
- Irrigation data: frequency, volume, dryback percentage by phase
The question isn’t “was the environment good?” It’s: where did the data deviate from target, and did those deviations show up in the outcome? Week 3 had elevated humidity for four days. Did that period correlate with anything visible in the canopy photos? Week 6 had a CO2 controller fault for two days. Is there a density difference in that zone?
Correlation isn’t causation, but without the environmental record sitting next to the outcome data, you can’t even start asking the right questions. The vague post-mortem exists because the data wasn’t captured to do better. “They just locked out” is what gets said when nobody has a pH log from week 4.
Step 3: Review the Visual Record
Canopy photos taken week-over-week tell a story that numbers miss. Color shifts, stretch patterns, canopy uniformity, early pest emergence, how the plants responded to a defoliation event. All of this shows up visually before it shows up in yield data.
If you took weekly canopy photos this run, go through them in sequence now. What does the color look like around week 4? Was the canopy even at week 3, or were there zones pulling ahead? Did the stretch look consistent, or were there areas that clearly ran hotter?
If you didn’t take weekly photos this run, that’s your first action item for next run. Start it. The value of canopy documentation isn’t the individual photo. It’s the comparison across weeks and across runs. One photo is a snapshot. Ten runs of weekly photos is a pattern library you can actually use.
Phone photos with zone and week in the filename get the job done. You don’t need a formal system to start. By run six you’ll have something genuinely useful to reference, and you’ll wonder how you reviewed runs without it.
Step 4: Review the Notes You Wish You Had
This is the uncomfortable part of the review. You’re going to find gaps. Things that happened during the run, got handled in the moment, and never made it into writing.
Work through these categories:
- Pest pressure: what was noticed, when, what the response was
- Equipment issues: anything that went offline, needed adjustment, or underperformed
- Nutrient changes made mid-run and the reasoning behind them
- Team observations that got communicated verbally but never logged
- Environmental adjustments made outside the normal schedule
Every item you find yourself saying “I wish I had written that down” about becomes a line item on your note-taking checklist for next run. The review process generates its own improvement list. You finish knowing exactly what to track differently going forward, and that information is freshest right now, not after the next flip.
Step 5: The Three Questions
After assembling the data, the review narrows to three questions. They sound simple. Getting good answers takes work.
What went well? Be specific and measurable. “It was a good run” isn’t an answer. “Yield per light came in at X, up from the trailing 3-run average” is an answer. “The canopy was the most uniform we’ve had in zone 2 since we changed the training schedule” is an answer. If you can’t point to a number or a specific observable outcome, the “what went well” is too vague to repeat intentionally.
What would you change? The framing here matters. Not “what went wrong” but “what would you do differently?” The data shows what happened. The question is what actions, given what that data shows, would produce a different outcome. This keeps the conversation forward-looking and gives your next cannabis run something concrete to test.
What do you need to find out? Good runs raise questions. Bad runs raise questions. What is this run telling you that you don’t have an answer to yet? These become the experiments for next cycle, or the data points to monitor more carefully. Write them down. Questions that don’t get written down don’t get answered. They just become the background noise of “something to figure out eventually.”
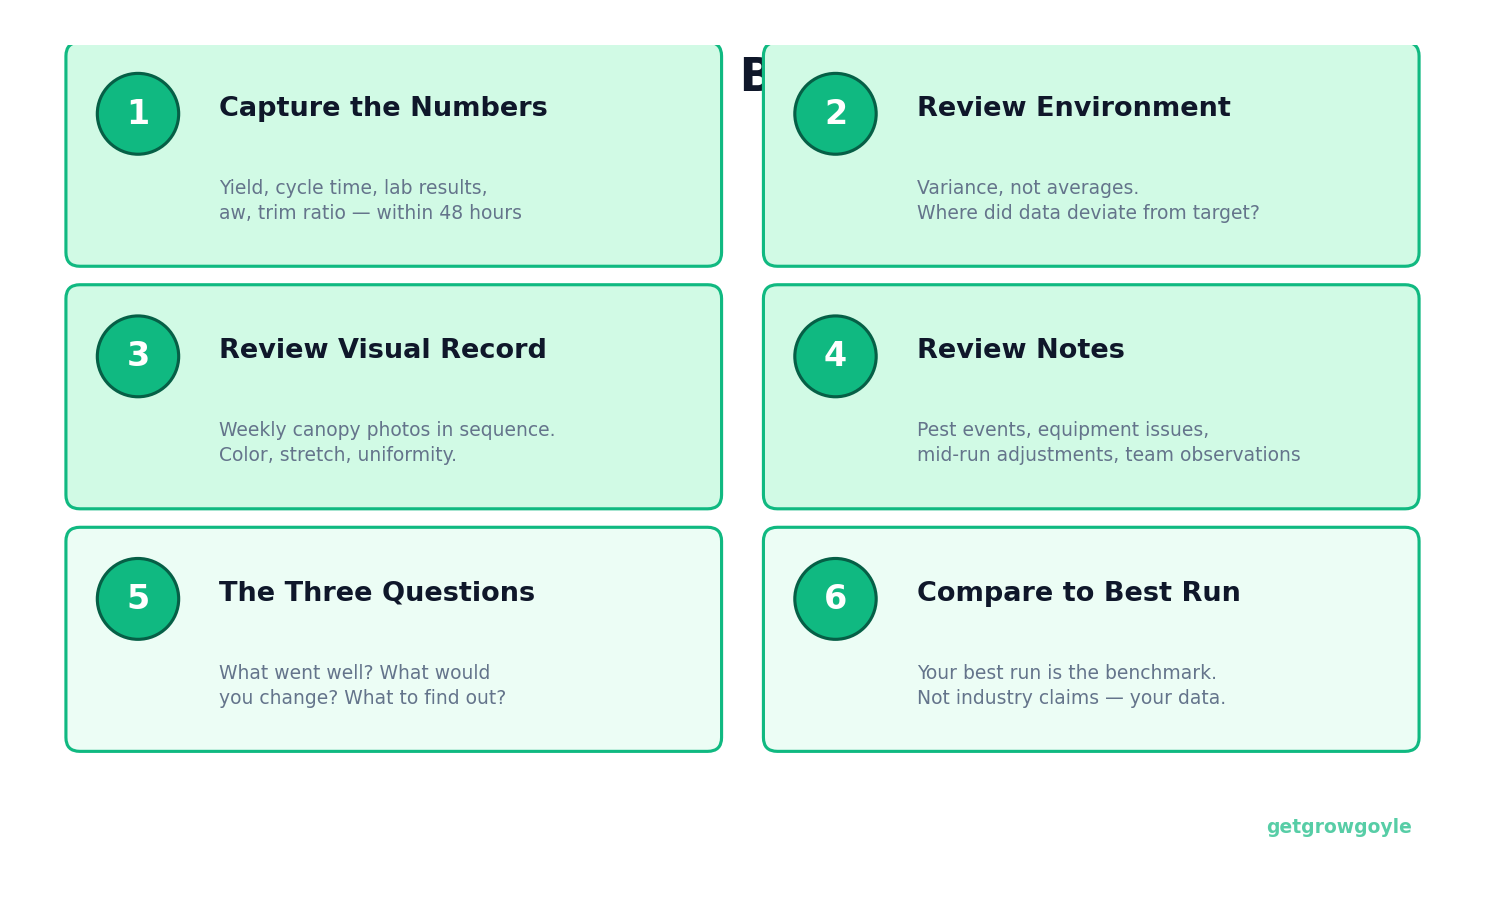
Step 6: Compare Against Your Best Run
The three questions are more useful with a benchmark. Your best run is the benchmark. Not industry averages, not what other operations claim. Your best run, with your genetics, in your rooms, with your team.
Without systematic comparison, your best run becomes folklore. “That Q3 run two years ago was the best we ever had.” Great. What made it great? What was different about the environment that cycle? What was the trim ratio? Did you run a different irrigation strategy?
If you don’t have the data from that run, you can’t answer those questions. It’s a memory, not a benchmark. A memory is useful for morale. A benchmark with actual numbers is useful for replication. Batch-over-batch improvement requires that your best run is documented well enough to serve as a reference point, not just a story you tell at team meetings.
When you compare the current run against your best, you’re looking for specific deltas. Not a general sense of “this one wasn’t quite as good.” You’re looking for: environment consistency during weeks 3-5 was tighter in the reference run; trim ratio came in 7% lower; DLI during mid-flower averaged higher. Those specific differences are worth something. A general impression is not actionable.
Making It Stick: The 30-Minute Post-Run Meeting
The post-run review only happens consistently if it’s on the calendar. Not when someone has time. Not “sometime this week.” A standing meeting, scheduled within seven days of harvest completion.
Keep it to 30 minutes with a clear agenda:
- Numbers review (5 minutes): Key metrics for this run vs. your trailing average and your best run
- Environmental review (10 minutes): Deviations, variances, anything outside target by phase
- Observations (10 minutes): Visual record, written notes, team input on anything not captured in data
- Three questions (5 minutes): What went well, what changes, what to find out
- Action items: Exactly 1-3 specific, testable changes for next run
The action items are the deliverable. Not a complete overhaul of the operation based on one run. One to three specific things to test or change next cycle, tied directly to what the data from this run showed. That constraint matters. You can’t test everything at once and know what moved what.
If you’re running multiple zones, the review adds another layer. Zone-to-zone comparison within the same run gives you signal you can’t get from a single-zone operation. Same genetics, same environment spec, different outcomes in different zones: the delta is worth investigating. The operations that improve consistently aren’t grinding harder. They’re running a tighter feedback loop.
The Compound Effect
One post-harvest batch review gives you marginal improvement. Ten reviews give you pattern recognition. That’s the real return on this process, and it doesn’t show up until you’ve been doing it long enough to see the patterns emerge.
After ten runs of structured review, the data can tell you things like: “When VPD variance exceeds 0.4 during weeks 3 through 5, the trim ratio consistently comes in higher.” Or: “Our best cannabis runs share three things. DLI above 45 during mid-flower, CO2 holding above 1,200 for the full lights-on window, and drybacks completing before lights-on in late flower.” You can say what your best runs have in common, and you can show it in the data rather than explain it from gut feel.
The grower who can say “yield per light improved by 0.3 lbs over the last six runs, and here’s exactly what changed” is operating at a different level than the one who says “we’ve been getting better.” Both might be true. Only one of them is provable, repeatable, and defensible when wholesale prices tighten and the margin for error shrinks.
Cost per pound drops by stacking small improvements, not by waiting for a breakthrough. A 5% improvement in yield per light, combined with a 3% improvement in trim ratio, combined with a half-day reduction in cycle time, compounds over six runs per year. That math is what separates the operations that survive market compression from the ones that don’t. The post-run review is how the math gets built.
Growgoyle doesn’t track your costs. It helps you lower them. After every run, the AI batch analysis delivers a full breakdown: what the data shows worked, what to look at next cycle, and specific yield estimates for each improvement opportunity. Upload a few canopy photos and see what the AI catches. Try it free on your own plants.
About the Author
Eric is a 15-year software engineer who operates a commercial cannabis cultivation facility in Michigan. He built Growgoyle to solve the problems he faces every day: inconsistent yields, forgotten lessons from past runs, and the constant pressure to lower cost per pound. Every feature in Growgoyle comes from real growing experience, not a product roadmap.