Every commercial cannabis harvest ends the same way. The room gets chopped, the plants get hung, the dry weight gets recorded. And then the next run starts. Maybe there’s a quick conversation: “That one was pretty good” or “Room 3 was light this time.” The number gets written down somewhere. And that’s it.
The 30-minute review that could shift your next run by 10 to 15% gets skipped. Not because growers are lazy. Because nobody has a framework for it. There’s no template pinned to the wall. No process in the SOP binder. No one blocking off time on the calendar after chop day to sit down and actually ask: what happened, and what should change?
Cannabis batch analysis is the discipline that captures all of it. And for most commercial operations, it’s the single highest-ROI activity that isn’t happening.
What Is Cannabis Batch Analysis?
There’s an important distinction between batch tracking and batch analysis. Most of the industry conflates the two.
Batch tracking is recording what happened. Weights, dates, inputs, maybe some environmental snapshots. It answers one question: “What did we harvest?”
Cannabis batch analysis goes further. It asks why. Why was this run different from the last one? What changed between a 2.8 lb/light run and a 3.4 lb/light run? What should you repeat, and what should you adjust? It’s the difference between a logbook and a learning system.
Tracking is necessary, but tracking alone doesn’t improve anything. You can track every run for two years and still repeat the same patterns because the data was never actually analyzed.
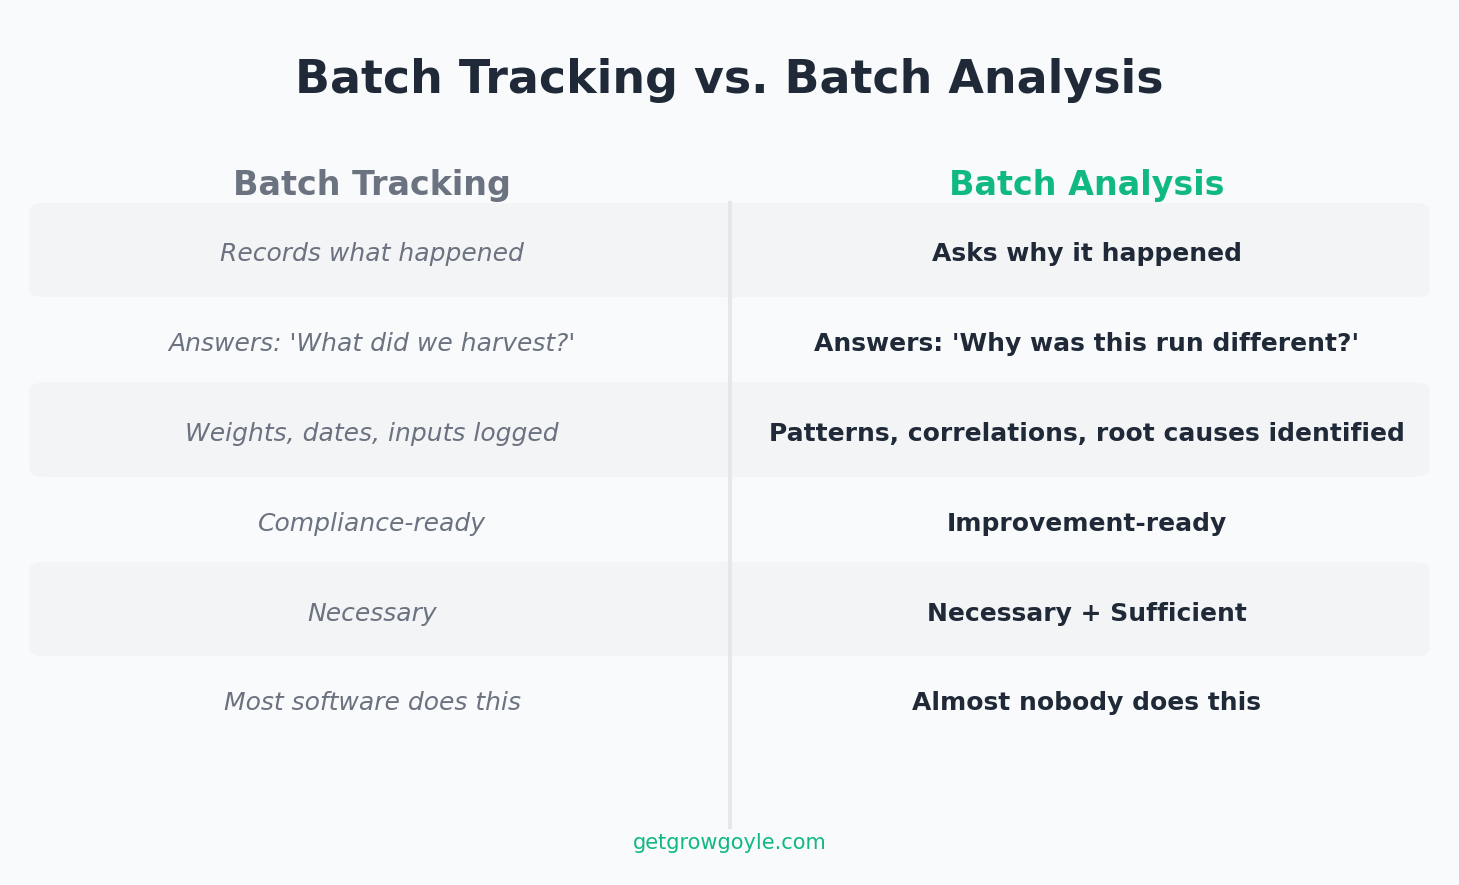
Tracking records what happened. Analysis tells you what to change.
What a Complete Cannabis Batch Analysis Covers
A thorough post-harvest analysis evaluates five dimensions. Most cannabis growers track the first one and skip the rest.
1. Yield Performance. This is the one everyone records: total dry weight, lb per light, grams per plant, trim ratio. These are your output metrics. They tell you what you got, but not why you got it.
2. Quality Markers. THC percentage, terpene profile, visual assessment, water activity. A run that pushed 3.2 lb/light but tested at 22% when your buyers want 28% isn’t actually a win. Quality and yield have to be evaluated together.
3. Environmental Profile. Average temp, RH, and VPD by growth phase. Any excursions or equipment hiccups. Environmental data tells the story of what the plants actually experienced, which is often different from what you programmed into the controller.
4. Input Timeline. Nutrients, amendments, irrigation strategy, any mid-run adjustments. That feed change you made in Week 5 because the plants looked hungry? If you don’t record it, it’s gone. And if the run hit 3.4 lb/light, you’ll never know if that change was the reason.
5. Plant Health Observations. Canopy photos, pest or disease events, growth anomalies, defoliation timing. Visual data is some of the most information-dense data a cannabis grow room produces, and it almost never makes it into a post-harvest review.
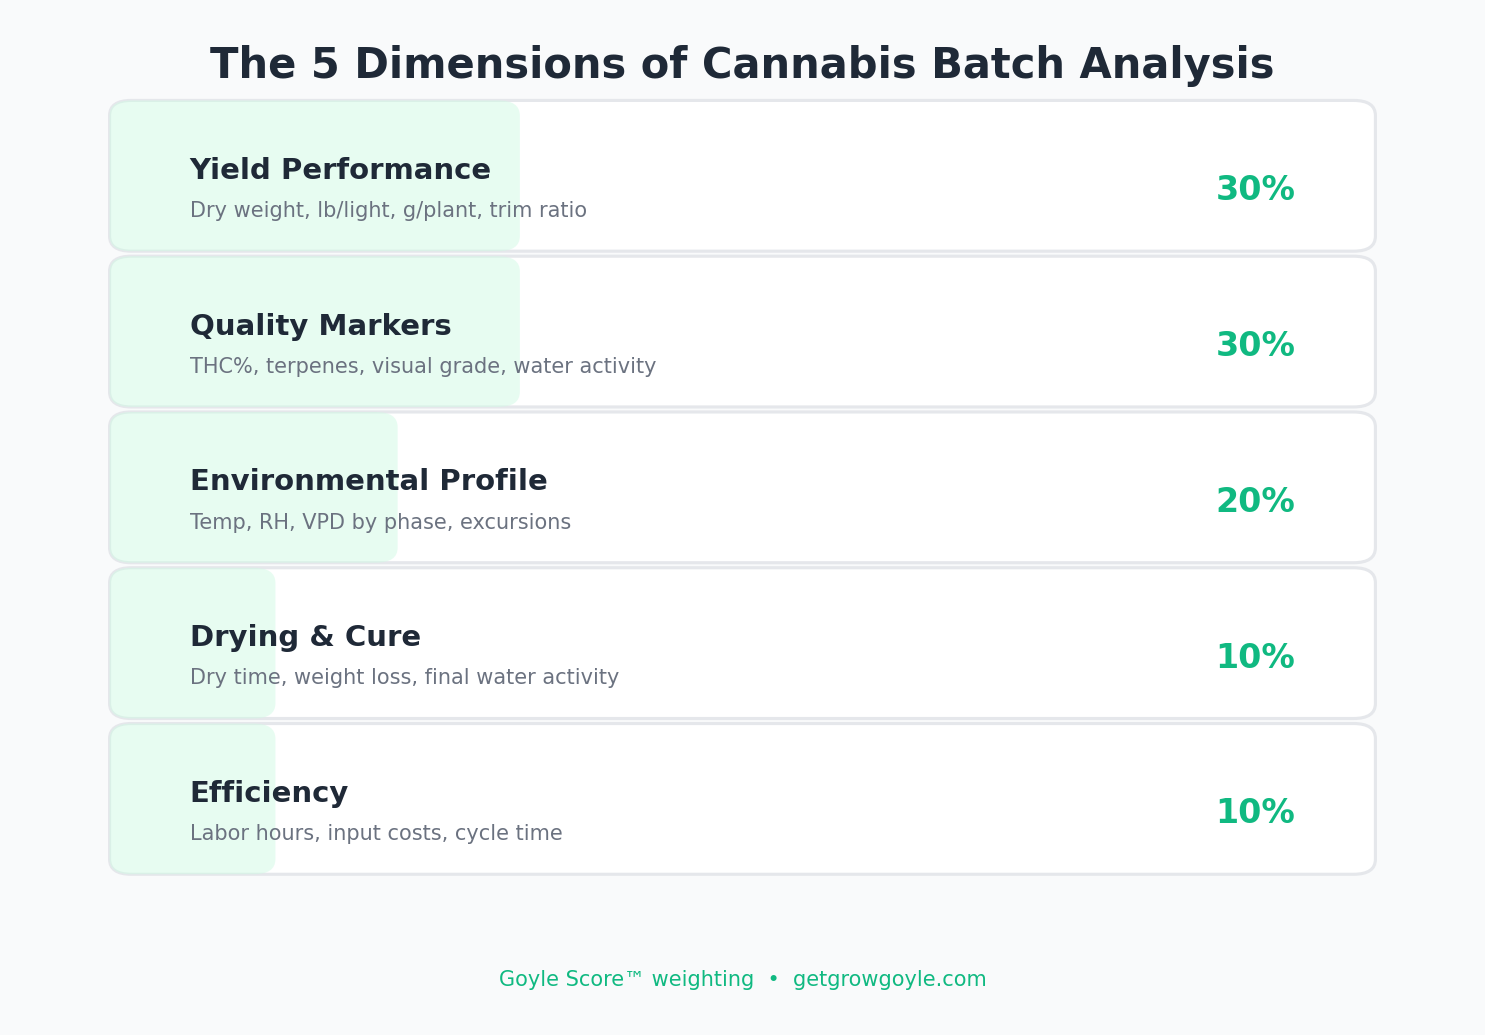
A complete cannabis batch analysis evaluates five dimensions. Most growers stop at one.
What Actually Happens After Most Cannabis Harvests
Here’s what the typical post-harvest “review” looks like at most commercial cannabis facilities. The harvest manager texts the dry weight to the owner. Someone compares it to last run from memory. Maybe there’s a mention at the next team meeting: “Room 2 was down a little.” And then the team flips the room and starts the next cycle.
The problem isn’t effort. It’s that memory compresses months of daily decisions into a single feeling: “that run was good” or “that run was off.” The subtle variables that separated 2.8 lb/light from 3.4 lb/light get lost. Was it the VPD shift in Week 3? The late top? The new nutrient line? The day the chiller went down for six hours?
All of those data points existed at some point. By the time the next run finishes, they’re gone.
Why Memory Fails at Scale
At one or two rooms, you can hold it. A single grower running two flower rooms with one strain can reasonably keep the important variables in their head. It’s not ideal, but it works.
At four to eight rooms running different strains on staggered schedules, you literally cannot hold it all. Week 3 environment in Room 2 from four months ago? Gone. The irrigation adjustment you made in Room 5 during that one run that hit 3.5 lb/light? You might remember making a change, but you won’t remember the specifics.
And those specifics might be exactly where the yield differential lives. Inconsistent yields across runs rarely come from one big catastrophic event. They come from the accumulation of small variables that nobody recorded, nobody analyzed, and nobody can recall with precision.
The Compound Effect of Structured Cannabis Batch Analysis
Run 1 is a baseline. You don’t know what you don’t know. Record everything you can and move on.
Run 2 with a structured analysis shows what changed. Maybe the yield dipped and the data reveals a VPD excursion during stretch that wasn’t there in Run 1. Now you have a hypothesis.
By Run 5, you have a performance curve. You can see real trends in what correlates with better yields. This is how the best commercial cannabis operations systematically lower cost per pound: not through one breakthrough, but through accumulated knowledge applied run after run.
A realistic trajectory looks something like this: 2.8, 2.9, 3.0, 3.15, 3.25, 3.35 lb/light over six analyzed runs. No single run is a revelation. But over time, the curve bends upward because you’re building on real data instead of resetting from memory every cycle.
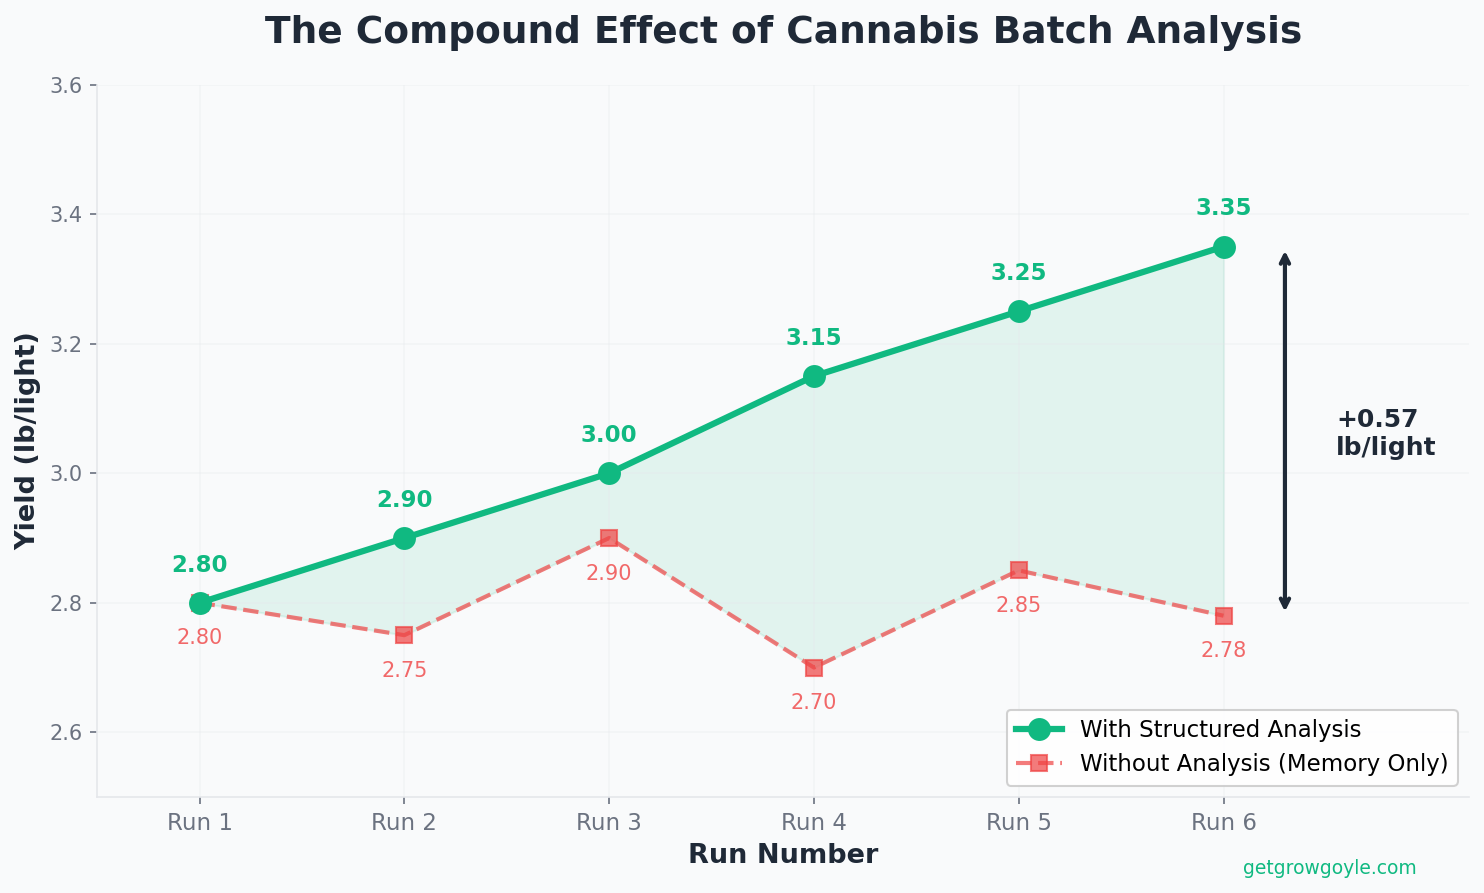
Batch analysis compounds. Six runs of structured review can push yield from 2.8 to 3.35 lb/light.
The Manual Approach: Spreadsheets and Discipline
You can absolutely do cannabis batch analysis manually. A spreadsheet with the five dimensions listed above, filled in after every harvest, compared to previous runs. It works. Plenty of good growers have done it this way.
The failure mode isn’t the spreadsheet. It’s the discipline. Most growers build the template after a particularly frustrating run, fill it in religiously for the next harvest, and by Run 3 life gets in the way. There’s a pest issue in another room. A new hire needs training. The HVAC tech is coming Thursday. The spreadsheet sits there, half-filled, until the next frustrating run restarts the cycle.
The spreadsheet also can’t do the hard part: compare across runs, weight the variables, and tell you which of the 50 things that changed between Run 4 and Run 7 actually mattered. That’s analysis, and it requires either a very experienced grower with hours to spare or something purpose-built for the job.
AI-Powered Cannabis Batch Analysis
This is where the conversation shifts from “you should do this” to “what if it happened automatically.”
A useful cultivation analysis starts with the records from your operation: the strain, room, readings, tasks, observations, and previous results. Having those records together saves the work of rebuilding the context for every question. The quality of the answer still depends on what was recorded and whether the explanation holds up when you check it.
Growgoyle’s post-run analysis reviews the batch alongside its Goyle Score. The standard weights are Yield 30%, Quality 30%, Environment 20%, Drying 10%, and Efficiency 10%. Yield uses prior runs of the same strain; environmental and drying dimensions also use defined scoring ranges. The app calculates the scores, and AI writes the explanation around them.
The analysis highlights a short list of improvement opportunities so the next review can end with work someone can actually do. Where it includes an estimated impact in pounds, that is a modeled opportunity based on the available evidence and assumptions. It is not a promise of additional yield or a measurement of pounds lost to one cause.
The tone is consultative, not commanding. The AI suggests. It never tells you what to do. It says “pH trended low during Week 4, which correlates with reduced uptake in similar runs.” It doesn’t say “you need to fix your pH.” That’s an important distinction for a tool that’s going to sit at the center of your post-harvest process.
What Changes When You Actually Do This
Connect the math to your operation. If wholesale cannabis prices sit in the estimated $500 to $600 per pound range and you’re running 24 lights, the difference between 2.8 and 3.2 lb/light is 9.6 pounds per run.
At $550 per pound, that’s $5,280 per run sitting in unanalyzed data.
Over four to five runs per year, that’s $20,000 to $26,000 annually. Not from buying new equipment. Not from switching nutrient lines. Not from adding lights. From looking at the data that already existed and making better decisions with it.
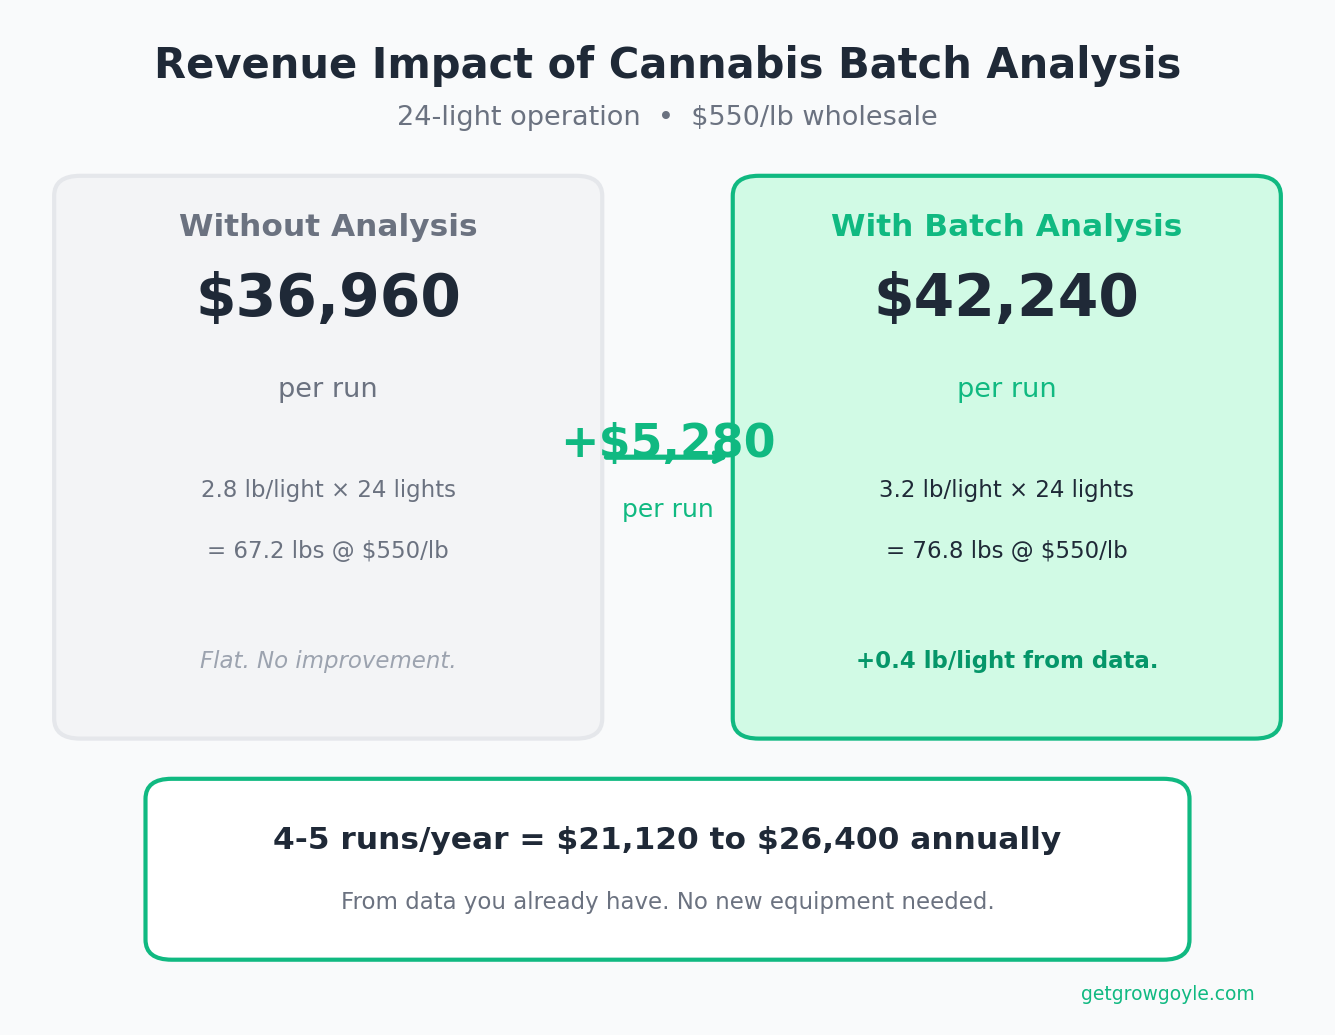
The yield gap between 2.8 and 3.2 lb/light represents $20,000+ per year on a 24-light operation.
That’s the real argument for cannabis batch analysis. It’s not about adding complexity to your process. It’s about extracting more value from the infrastructure you’ve already paid for.
Getting Started Today
You don’t need software to start. Grab a notebook after your current harvest and write down five things: total dry weight, lb per light, any environmental issues you remember, what went well, and what you’d change next time. That’s cannabis batch analysis. It’s not complicated. It’s just not happening at most facilities.
Most of this data lives on a whiteboard in the flower room or in the head grower’s head. That’s not batch analysis. That’s memory, and memory has a shelf life. By the time you’re standing in the dry room wondering why this run came up light, the details from week 3 are already fading.
Got a batch in flower right now? That’s enough to start. Add the current crop, put this week’s work on the schedule, and record the readings and observations you want to remember. Those records help the team today and give your post-harvest review something better than memory to work with.
If you want to go further, build a simple template that covers all five dimensions (yield, quality, environment, inputs, plant health). Fill it in for three consecutive runs. By the third run, you’ll have enough data to see patterns that were invisible when each run existed only in memory.
When harvest is finished, review the scored dimensions, compare the run with a relevant previous crop, and turn the findings you trust into next-cycle tasks. That is how Growgoyle connects the daily operation to the review.
Growgoyle brings crop plans, daily work, records, and run comparison together. Recorded labor and attributed overhead can help you put operational differences into dollars; actual production costs still need your accounting records.
Leave a Reply