Author: Growgoyle

  • METRC Is for the State. Growgoyle Is for You.

    METRC Is for the State. Growgoyle Is for You.

    METRC Is for the State. Growgoyle Is for You.

    I’ve onboarded a lot of cannabis growers at this point. And there’s a moment that keeps repeating. I’ll ask something simple: “When did you flip this room?” And there’s a pause. Then they open METRC.

    Two separate commercial operators did this in the same week. Both running real facilities with real teams, both experienced, both passing every compliance audit. One of them was a full week off on his flip date and had to back-calculate it from his harvest date in METRC. These are not sloppy growers. These are professionals running multi-room cannabis cultivation facilities, hitting deadlines, managing staff. They just didn’t have anywhere to write it down except the system the state gave them.

    And that’s the problem. Not METRC. METRC does exactly what it’s supposed to do. The problem is that METRC became the default cannabis grow journal because nothing else existed.

    METRC Does Its Job. That’s the Point.

    METRC is a compliance system. It tracks plant counts, harvest weights, package IDs, transfers, lab results, and waste manifests. It does this well. It gives the state what the state needs: a chain of custody from seed to sale. Every licensed cannabis cultivation operation in a METRC state uses it because they’re required to. And that’s fine.

    The issue is what METRC was never designed to capture. It doesn’t know your flip date. It doesn’t know your VPD targets during week 5 of flower. It doesn’t know that you adjusted your feed EC on day 21 because your runoff was climbing. It doesn’t know why your January run hit 2.8 lb/light and your March run only hit 2.3.

    METRC can tell you that you harvested 47 pounds. It cannot tell you why it wasn’t 52.

    What METRC Tracks vs. What You Actually Need

    Here’s the gap, laid out plainly.

    Comparison table: what METRC tracks versus what cannabis cultivation records actually need
    METRC gives you the compliance picture. Your grow needs the full picture.

    On the METRC side: plant counts, harvest weights, package IDs, transfer manifests, lab test status, waste disposal records. That’s the compliance picture. It’s complete for its purpose.

    On the cultivation side, what your cannabis grow tracking actually needs: flip dates, environment targets during flower, feed schedule changes, canopy health observations, yield per light, strain performance across runs, and what changed between your best run and your worst. None of that lives in METRC. Because METRC wasn’t built for you. It was built for the state.

    If you’re relying on METRC as your batch-over-batch improvement system, you’re trying to use a compliance ledger as a grow journal. It’s like doing your taxes with a recipe book. Both are useful documents. Neither can do the other’s job.

    The Invisible Cost of No Cannabis Cultivation Records

    Here’s what this looks like in practice. You had a great run in October. Frosty, dense, 2.9 lb/light. Your team was hyped. Fast forward four months. You’re running the same strain in the same room. And it comes back at 2.4.

    What changed? You think it might have been the environment. Maybe the VPD was off during stretch. Maybe you pushed the dry too fast. But you can’t look it up because nobody wrote it down. METRC says you harvested. Your memory says “I think we did something different with the lights.” That’s not cannabis grow tracking. That’s guessing.

    The data gap compounds over time. One forgotten detail per run is manageable. But across 4 rooms, 6 strains, 3 runs per room per year, you’re looking at dozens of lost data points. Each one represents a question you can’t answer later. What feed schedule produced your best terpene profile? What was your dry room humidity when that batch came out perfect? The answers existed. They just weren’t captured anywhere that persists.

    This is the real cost per pound problem that nobody talks about. Not just inputs and labor. It’s the yield left on the table because you can’t reliably repeat what works.

    What a Cannabis Batch Actually Needs Recorded

    Think about the lifecycle of a single batch. From flip to cure, there are dozens of inflection points where decisions get made and conditions shift.

    Timeline showing all the data points a cannabis batch needs recorded from flip to cure, versus the endpoints METRC captures
    METRC captures the endpoints. Everything between flip and harvest is where your yield is actually determined.

    At flip, you need the date, the strain, the plant count, the room, and your target environment parameters. During stretch (weeks 1 through 3 of flower), you’re watching canopy development, adjusting light height, maybe defoliating. Mid-flower (weeks 4 through 6), you’re monitoring trichome development, adjusting VPD, watching for deficiencies. Late flower (weeks 7 through 9+), you’re deciding when to flush, when to chop, tracking fade.

    Then harvest. Wet weight. Trim. Dry room conditions. Final dry weight. Cure parameters. Lab results. Yield per light.

    METRC captures the endpoints: plant went in, weight came out. Everything in between (the part that actually determines your yield and quality) is either in someone’s head, on a whiteboard that got erased, or in a text thread from three months ago that nobody can find.

    That’s not a character flaw. That’s a systems problem. And it’s universal. Every cannabis cultivation facility I’ve talked to has some version of this gap.

    When Your Best Grower Leaves

    There’s a version of this problem that keeps operators up at night. Your lead grower, the one who dialed in your environment, who knows exactly when to push the DLI, who can eyeball a canopy and call the yield within 10%. What happens when they leave?

    All that institutional knowledge walks out the door. METRC can’t tell you what they did differently. Neither can your spreadsheet from 6 months ago. The new person comes in and starts from scratch, making the same adjustments your last grower already figured out. You’re paying for lessons your facility already learned.

    This is why cultivation intelligence matters. Not as a buzzword. As a practical concept: your facility should accumulate knowledge over time, independent of any single person. When the data from every run is captured, structured, and analyzed, your operation gets smarter whether or not the same person is running it.

    You Need Two Systems

    The answer isn’t to replace METRC. You can’t, and you shouldn’t try. METRC does its job. The answer is to stop expecting it to do a job it was never designed for.

    You need one system for the state and one system for you.

    Your state system tracks compliance: did you account for every plant, every gram, every transfer? Your cultivation system tracks what actually happened during the run: environment data, feed changes, canopy observations, and what your best runs had in common.

    Side-by-side comparison of questions METRC can answer versus questions cultivation tracking can answer
    Two systems, two purposes. METRC answers the state’s questions. Cultivation tracking answers yours.

    With METRC alone, you can answer: How much did we harvest? When was it packaged? Where did it transfer? Did it pass testing?

    With real cannabis batch tracking, you can answer: Why did Room 3 outperform Room 1 by 15% on the same strain? What environment conditions correlated with your highest yields? What changed between your best run and the one that fell short? Which strains perform best in which rooms? What should you do differently next time?

    That second set of questions is where your cost per pound actually lives. And right now, for most operations, those questions go unanswered.

    Compliance Tracking vs. Cultivation Intelligence

    Two-column comparison of compliance tracking (backward-looking, regulatory) versus cultivation intelligence (forward-looking, operational)
    Compliance tracking looks backward. Cultivation intelligence looks forward.

    Compliance tracking is backward-looking by design. It answers: what happened? It’s regulatory. It satisfies an external requirement. It records outcomes.

    Cultivation intelligence is forward-looking. It answers: what should we do next? It’s operational. It satisfies an internal need. It records the process that created those outcomes, then helps you refine that process run after run.

    Both are necessary. But if you only have the first one, you’re running your cannabis facility with one eye closed. You can prove what you grew. You just can’t prove why, or how to grow more of it next time.

    This is exactly the gap that AI batch analysis was built to fill. After every run, a full breakdown of what worked, what to adjust, and specific estimates for where improvements would come from. Not replacing your judgment. Adding structured recall to it. The data shows what happened so you can decide what to change.

    And when you want to understand why one run outperformed another, batch comparison puts them side by side. Here’s what your best run had in common. Here’s what was different about the mediocre one. No guessing. No trying to reconstruct it from memory four months later.

    Your Compliance System Tracks Your Grow for the State. You Need Something That Tracks Your Grow for You.

    METRC isn’t the problem. The gap is the problem. And the gap exists because for years, the only tracking system cannabis growers had access to was the one the state required. Everything else (flip dates, environment data, feed changes, canopy observations) got carried in someone’s head, scribbled on a whiteboard, or lost in a group text.

    Your operation’s rate of improvement depends on how much you retain from your last run. And right now, most of what you retain is whatever you can hold in your head. That’s not a failure of discipline. That’s a failure of systems. Your facility deserves consistent yields, and consistency requires a record that’s actually built for growing, not for compliance.

    METRC is for the state to track your grow. Growgoyle is for you to track your grow and repeat what works, run after run.


    Growgoyle doesn’t replace METRC. It fills the gap METRC was never designed to fill. See the full system built by a grower who got tired of losing lessons between runs. See how it works.

    About the Author

    Eric is a 15-year software engineer who operates a commercial cannabis cultivation facility in Michigan. He built Growgoyle to solve the problems he faces every day: inconsistent yields, forgotten lessons from past runs, and the constant pressure to lower cost per pound. Every feature in Growgoyle comes from real growing experience, not a product roadmap.

  • Cannabis Batch Analysis: What Your Harvest Data Is Trying to Tell You

    Cannabis Batch Analysis: What Your Harvest Data Is Trying to Tell You

    Cannabis Batch Analysis: What Your Harvest Data Is Trying to Tell You

    Every commercial cannabis harvest ends the same way. The room gets chopped, the plants get hung, the dry weight gets recorded. And then the next run starts. Maybe there’s a quick conversation: “That one was pretty good” or “Room 3 was light this time.” The number gets written down somewhere. And that’s it.

    The 30-minute review that could shift your next run by 10 to 15% gets skipped. Not because growers are lazy. Because nobody has a framework for it. There’s no template pinned to the wall. No process in the SOP binder. No one blocking off time on the calendar after chop day to sit down and actually ask: what happened, and what should change?

    Cannabis batch analysis is the discipline that captures all of it. And for most commercial operations, it’s the single highest-ROI activity that isn’t happening.

    What Is Cannabis Batch Analysis?

    There’s an important distinction between batch tracking and batch analysis. Most of the industry conflates the two.

    Batch tracking is recording what happened. Weights, dates, inputs, maybe some environmental snapshots. It answers one question: “What did we harvest?”

    Cannabis batch analysis goes further. It asks why. Why was this run different from the last one? What changed between a 2.8 lb/light run and a 3.4 lb/light run? What should you repeat, and what should you adjust? It’s the difference between a logbook and a learning system.

    Tracking is necessary, but tracking alone doesn’t improve anything. You can track every run for two years and still repeat the same patterns because the data was never actually analyzed.

    Batch tracking vs batch analysis comparison for cannabis cultivation
    Tracking records what happened. Analysis tells you what to change.

    What a Complete Cannabis Batch Analysis Covers

    A thorough post-harvest analysis evaluates five dimensions. Most cannabis growers track the first one and skip the rest.

    1. Yield Performance. This is the one everyone records: total dry weight, lb per light, grams per plant, trim ratio. These are your output metrics. They tell you what you got, but not why you got it.

    2. Quality Markers. THC percentage, terpene profile, visual assessment, water activity. A run that pushed 3.2 lb/light but tested at 22% when your buyers want 28% isn’t actually a win. Quality and yield have to be evaluated together.

    3. Environmental Profile. Average temp, RH, and VPD by growth phase. Any excursions or equipment hiccups. Environmental data tells the story of what the plants actually experienced, which is often different from what you programmed into the controller.

    4. Input Timeline. Nutrients, amendments, irrigation strategy, any mid-run adjustments. That feed change you made in Week 5 because the plants looked hungry? If you don’t record it, it’s gone. And if the run hit 3.4 lb/light, you’ll never know if that change was the reason.

    5. Plant Health Observations. Canopy photos, pest or disease events, growth anomalies, defoliation timing. Visual data is some of the most information-dense data a cannabis grow room produces, and it almost never makes it into a post-harvest review.

    Five dimensions of cannabis batch analysis: yield, quality, environment, inputs, plant health
    A complete cannabis batch analysis evaluates five dimensions. Most growers stop at one.

    What Actually Happens After Most Cannabis Harvests

    Here’s what the typical post-harvest “review” looks like at most commercial cannabis facilities. The harvest manager texts the dry weight to the owner. Someone compares it to last run from memory. Maybe there’s a mention at the next team meeting: “Room 2 was down a little.” And then the team flips the room and starts the next cycle.

    The problem isn’t effort. It’s that memory compresses months of daily decisions into a single feeling: “that run was good” or “that run was off.” The subtle variables that separated 2.8 lb/light from 3.4 lb/light get lost. Was it the VPD shift in Week 3? The late top? The new nutrient line? The day the chiller went down for six hours?

    All of those data points existed at some point. By the time the next run finishes, they’re gone.

    Why Memory Fails at Scale

    At one or two rooms, you can hold it. A single grower running two flower rooms with one strain can reasonably keep the important variables in their head. It’s not ideal, but it works.

    At four to eight rooms running different strains on staggered schedules, you literally cannot hold it all. Week 3 environment in Room 2 from four months ago? Gone. The irrigation adjustment you made in Room 5 during that one run that hit 3.5 lb/light? You might remember making a change, but you won’t remember the specifics.

    And those specifics might be exactly where the yield differential lives. Inconsistent yields across runs rarely come from one big catastrophic event. They come from the accumulation of small variables that nobody recorded, nobody analyzed, and nobody can recall with precision.

    The Compound Effect of Structured Cannabis Batch Analysis

    Run 1 is a baseline. You don’t know what you don’t know. Record everything you can and move on.

    Run 2 with a structured analysis shows what changed. Maybe the yield dipped and the data reveals a VPD excursion during stretch that wasn’t there in Run 1. Now you have a hypothesis.

    By Run 5, you have a performance curve. You can see real trends in what correlates with better yields. This is how the best commercial cannabis operations systematically lower cost per pound: not through one breakthrough, but through accumulated knowledge applied run after run.

    A realistic trajectory looks something like this: 2.8, 2.9, 3.0, 3.15, 3.25, 3.35 lb/light over six analyzed runs. No single run is a revelation. But over time, the curve bends upward because you’re building on real data instead of resetting from memory every cycle.

    Yield improvement curve over 6 analyzed cannabis runs
    Batch analysis compounds. Six runs of structured review can push yield from 2.8 to 3.35 lb/light.

    The Manual Approach: Spreadsheets and Discipline

    You can absolutely do cannabis batch analysis manually. A spreadsheet with the five dimensions listed above, filled in after every harvest, compared to previous runs. It works. Plenty of good growers have done it this way.

    The failure mode isn’t the spreadsheet. It’s the discipline. Most growers build the template after a particularly frustrating run, fill it in religiously for the next harvest, and by Run 3 life gets in the way. There’s a pest issue in another room. A new hire needs training. The HVAC tech is coming Thursday. The spreadsheet sits there, half-filled, until the next frustrating run restarts the cycle.

    The spreadsheet also can’t do the hard part: compare across runs, weight the variables, and tell you which of the 50 things that changed between Run 4 and Run 7 actually mattered. That’s analysis, and it requires either a very experienced grower with hours to spare or something purpose-built for the job.

    AI-Powered Cannabis Batch Analysis

    This is where the conversation shifts from “you should do this” to “what if it happened automatically.”

    Not a ChatGPT wrapper. Anyone can paste grow data into a general-purpose AI and get a generic response. AI batch analysis built for cannabis cultivation is different. A purpose-built system already has your facility context, your strain history, your environmental data, and your previous run performance. It doesn’t need you to explain what a dryback is or what VPD range you’re targeting in Week 3 of flower.

    Growgoyle’s AI Batch Analysis generates a complete post-harvest breakdown when you close out a batch. It scores the run across multiple dimensions using the Goyle Score (0 to 100), which evaluates Yield (30%), Quality (30%), Environment (20%), Drying (10%), and Efficiency (10%). Every grower is scored against their own history, not some industry average that doesn’t account for your genetics, your rooms, or your climate.

    Every analysis identifies exactly three improvement opportunities, each with estimated yield impact in pounds. Not twenty suggestions you’ll never get to. Three specific things, ranked by impact, that the data shows would make the biggest difference next run. No run is perfect, and the AI treats every batch as an opportunity to find the next gain.

    The tone is consultative, not commanding. The AI suggests. It never tells you what to do. It says “pH trended low during Week 4, which correlates with reduced uptake in similar runs.” It doesn’t say “you need to fix your pH.” That’s an important distinction for a tool that’s going to sit at the center of your post-harvest process.

    What Changes When You Actually Do This

    Connect the math to your operation. If wholesale cannabis prices sit in the estimated $500 to $600 per pound range and you’re running 24 lights, the difference between 2.8 and 3.2 lb/light is 9.6 pounds per run.

    At $550 per pound, that’s $5,280 per run sitting in unanalyzed data.

    Over four to five runs per year, that’s $20,000 to $26,000 annually. Not from buying new equipment. Not from switching nutrient lines. Not from adding lights. From looking at the data that already existed and making better decisions with it.

    Cost impact of cannabis batch analysis on a 24-light operation
    The yield gap between 2.8 and 3.2 lb/light represents $20,000+ per year on a 24-light operation.

    That’s the real argument for cannabis batch analysis. It’s not about adding complexity to your process. It’s about extracting more value from the infrastructure you’ve already paid for.

    Getting Started Today

    You don’t need software to start. Grab a notebook after your current harvest and write down five things: total dry weight, lb per light, any environmental issues you remember, what went well, and what you’d change next time. That’s cannabis batch analysis. It’s not complicated. It’s just not happening at most facilities.

    Most of this data lives on a whiteboard in the flower room or in the head grower’s head. That’s not batch analysis. That’s memory, and memory has a shelf life. By the time you’re standing in the dry room wondering why this run came up light, the details from week 3 are already fading.

    Got a batch in flower right now? That’s enough to start. You don’t need to wait for a new run. Log your current batch, snap some canopy photos, and start building the data that makes your next harvest better. Growgoyle automates the hard part. After each run, it generates a full AI analysis of what worked, what held you back, and exactly what to change. Try it free on your own plants.

    If you want to go further, build a simple template that covers all five dimensions (yield, quality, environment, inputs, plant health). Fill it in for three consecutive runs. By the third run, you’ll have enough data to see patterns that were invisible when each run existed only in memory.

    And if you want the analysis to happen automatically, with AI that already understands cannabis cultivation and scores every run against your own performance history, that’s what Growgoyle was built for.


    Growgoyle doesn’t track your costs. It finds the yield hiding in your harvest data. Upload a few canopy photos and see what the AI catches in 60 seconds. Try it free on your own plants.

    About the Author

    Eric is a 15-year software engineer who operates a commercial cannabis cultivation facility in Michigan. He built Growgoyle to solve the problems he faces every day: inconsistent yields, forgotten lessons from past runs, and the constant pressure to lower cost per pound. Every feature in Growgoyle comes from real growing experience, not a product roadmap.

  • Cannabis VPD Chart: The Complete Guide to Vapor Pressure Deficit

    Cannabis VPD Chart: The Complete Guide to Vapor Pressure Deficit

    If you’re managing a commercial grow room by relative humidity alone, you’re flying with half the instrument panel dark. Relative humidity tells you about the air. VPD tells you about the plant.

    Vapor Pressure Deficit is the climate metric that ties temperature and humidity into a single number the plant actually responds to. It directly measures the atmospheric demand on your plants and influences how fast they transpire and how efficiently they uptake nutrients. Once you understand VPD, you’ll never look at a humidity reading the same way again.

    🌡️ Free Cannabis VPD Calculator

    Enter your temperature and humidity, get your VPD instantly. Includes leaf temperature offset and phase-specific targets.

    Calculate Your VPD →

    What VPD Actually Is

    VPD measures the difference between how much moisture the air holds and how much it could hold at saturation. The unit is kilopascals (kPa).

    In plain terms: VPD tells you how “thirsty” the air is. High VPD means the air is dry and aggressively pulling moisture from every surface, including your plants’ leaves. Low VPD means the air is nearly saturated and the plants can barely transpire at all.

    Why this matters more than RH: Relative humidity is relative to temperature. The same 55% RH reading creates completely different conditions for the plant depending on whether the room is 72°F or 84°F.

    At 55% RH and 82°F, VPD is approximately 1.6 kPa. The air is pulling hard. Plants are transpiring heavily, and nutrient uptake is high.

    At 55% RH and 72°F, VPD drops to approximately 1.2 kPa. Same humidity reading, very different plant response.

    The math behind it: VPD = SVP(leaf) – AVP(air), where SVP is the saturation vapor pressure at leaf temperature and AVP is the actual vapor pressure of the air. You don’t need to calculate this manually. The Growgoyle VPD Calculator does it instantly.

    The Cannabis VPD Chart: Optimal Ranges by Phase

    This chart represents the target VPD ranges for cannabis at each growth phase, based on published research and commercial cultivation experience.

    Cannabis VPD ranges by growth phase showing target kPa values from clone through dry room
    Growth Phase Target VPD (kPa) Temperature Range RH Range (approx.) What’s Happening
    Clones / Seedlings 0.4 – 0.8 75-80°F 75-85% Minimal root system. Plants depend on foliar moisture absorption. Low VPD prevents wilting.
    Early Veg 0.8 – 1.0 76-82°F 60-70% Roots developing. Gradually increasing VPD trains the plant to transpire through roots.
    Late Veg 0.9 – 1.2 76-82°F 55-65% Vigorous growth. Higher VPD drives nutrient uptake and stronger vegetative development.
    Early Flower (Wk 1-3) 1.0 – 1.4 78-82°F 50-60% Stretch phase. Plants are metabolically active and water demand is increasing.
    Mid Flower (Wk 4-6) 1.2 – 1.5 75-80°F 45-55% Peak transpiration. Bud development requires consistent nutrient delivery.
    Late Flower (Wk 7+) 1.2 – 1.6 72-78°F 40-50% Dense buds create mold risk. Higher VPD keeps moisture moving out of the flower structure.
    Dry Room 0.6 – 0.8 60-65°F 55-65% Slow, controlled moisture loss. Low VPD prevents case hardening.

    The pattern to notice: VPD gradually increases from clone through late flower. You’re progressively asking the plant to work harder as its root system and vascular capacity develop. Think of it like training. You don’t start a new clone at the same VPD you run in week 7 of flower for the same reason you don’t hand a new employee the most complex task on day one.

    A note on precision: Dr. Bruce Bugbee at Utah State University has noted that the optimal VPD range is wider than many growers assume, particularly with adequate root zone moisture and supplemental CO2. He’s right. The difference between 1.1 and 1.3 kPa is unlikely to make or break a run. These phase targets are guidelines based on commercial experience, not rigid rules you need to hit exactly. Where VPD awareness becomes important is the fundamentals: knowing your actual VPD, understanding that two rooms with the same RH can have very different VPD, and recognizing when you’ve drifted into ranges that create real problems (below 0.8 kPa at night, for example).

    Cannabis VPD Lookup Chart: Every Temperature and Humidity Combination

    This is the cannabis VPD chart most growers want taped to the wall. Find your air temperature on the left, your relative humidity across the top, and read your VPD in kPa. Color coding shows which growth phase each value is appropriate for.

    Cannabis VPD lookup chart showing VPD values in kPa for every temperature and humidity combination from 65-90°F and 35-85% RH, color coded by growth phase

    How to read this cannabis VPD chart:

    • Blue zones (below 0.4 kPa): VPD is too low. Transpiration is stalled. Mold risk is elevated.
    • Cyan zones (0.4-0.8 kPa): Appropriate for clones, seedlings, and the dry room.
    • Light green zones (0.8-1.2 kPa): Vegetative growth range. Plants are transpiring at a healthy, moderate rate.
    • Green zones (1.0-1.5 kPa): Flower sweet spot. Peak nutrient uptake and bud development.
    • Yellow zones (1.5-1.7 kPa): Caution. Plants can handle this briefly but water demand is high.
    • Red zones (above 1.7 kPa): Danger. Expect leaf curl, tip burn, and reduced growth.

    Want a print-friendly version? Download the printable cannabis VPD chart (white background, designed for printing and posting in your facility).

    For real-time calculations with leaf temperature offset, use the free VPD calculator instead of eyeballing the chart. It accounts for the leaf-to-air temperature difference that can shift your actual VPD by 0.2-0.3 kPa under high-intensity lighting.

    The Night VPD Problem (That Most Growers Miss)

    Most VPD discussions focus on the lights-on period. That’s a mistake. Night VPD is where most crop losses actually originate.

    When lights turn off:

    • Temperature drops 8-15°F
    • Moisture content of the air stays the same
    • Relative humidity spikes (cooler air holds less moisture)
    • VPD crashes

    A room running a healthy 1.3 kPa during the day can easily drop to 0.4 kPa during lights-off. At 0.4 kPa, the air is nearly saturated. Transpiration virtually stops. And the conditions are perfect for Botrytis cinerea (gray mold) and powdery mildew to establish.

    The target: Keep lights-off VPD above 0.8 kPa. This usually requires dedicated dehumidification that ramps UP when lights go off, not down. Some facilities add supplemental heat during the dark period to keep the temperature drop manageable and prevent VPD from cratering.

    Night VPD is the number one reason late-flower rooms develop botrytis. Dense flower structures trap moisture at the bud site, and if the surrounding air is already near saturation (low VPD), there’s nowhere for that moisture to go.

    For a full breakdown of night climate management, see our cannabis climate control guide.

    How to Adjust VPD: Two Levers, One Target

    When VPD is off target, you have two options:

    Lever 1: Change the Temperature

    Raising temperature increases the air’s capacity to hold moisture, which raises VPD (makes the air “thirstier”). Lowering temperature reduces that capacity, which lowers VPD.

    Lever 2: Change the Humidity

    Removing moisture (dehumidifier) raises VPD. Adding moisture (humidifier, more watering events, wet floors) lowers VPD.

    VPD adjustment levers showing when to adjust temperature vs humidity

    Which lever to pull depends on where you’re starting:

    Scenario Best Lever Why
    VPD too low, temp is already high Dehumidify Can’t raise temp further without heat stress
    VPD too low, temp is moderate Raise temp 2-3°F Cheaper than running dehumidifiers harder
    VPD too high, RH is very low Humidify or slow down airflow Adding moisture is the only option
    VPD too high, temp is high Lower temp Reduces atmospheric demand and saves on cooling
    Night VPD crashing Dehumidify + minimal heat Prevent temp drop from pulling VPD below 0.8

    The cost angle: Adjusting temperature by 2°F to shift VPD often costs less in energy than running additional dehumidification. When you’re managing a 50-light room, every watt matters on the electric bill. Knowing which lever is cheaper for a given situation is the difference between a $30 adjustment and a $300 one.

    Why VPD Matters More Than RH: A Real Scenario

    Two room comparison showing same RH reading but different VPD due to temperature difference

    Consider two rooms running identical RH at 55%:

    Room A: 82°F, 55% RH = VPD of 1.6 kPa
    Plants are transpiring aggressively. Nutrient uptake is high. Water demand is extreme. If irrigation can’t keep up, you’ll see leaf curl and tip burn.

    Room B: 72°F, 55% RH = VPD of 1.2 kPa
    Plants are transpiring comfortably. Nutrient uptake is moderate and manageable. Irrigation stays ahead of demand.

    Same RH. Totally different plant experience. A grower monitoring only RH would think both rooms are identical. A grower monitoring VPD knows Room A is pushing the plants harder and would adjust irrigation scheduling accordingly.

    This is why VPD profile is worth investigating when two rooms with the same strain, same feed, and same light produce different results. Different HVAC configurations create different VPD profiles, and different VPD profiles mean different transpiration rates, different nutrient uptake speeds, and different water demand throughout the cycle.

    Leaf Surface Temperature: The Missing Variable

    The standard VPD calculation uses air temperature and relative humidity. But the plant doesn’t experience air temperature. It experiences leaf temperature.

    Under high-intensity lighting (LED or HPS), leaf surfaces can be 3-8°F warmer than the surrounding air depending on distance to light, airflow, and transpiration rate. This means the “real” VPD the plant feels is different from what your controller calculates.

    The practical impact: If your sensor reads 78°F and 55% RH, it calculates a VPD of about 1.4 kPa. But if leaf surface temperature is actually 83°F due to radiant heat from LEDs, the plant is experiencing a VPD closer to 1.7 kPa. That’s a meaningful difference and could explain why plants show water stress even when your VPD “looks fine.”

    Measuring leaf temperature: Infrared thermometers (point-and-shoot at the canopy) are cheap ($20-40) and give you a direct leaf surface reading. Some commercial sensor systems include IR leaf temperature sensors. If you’re running high PPFD (1,000+ µmol), checking leaf temps regularly is worth the 30 seconds it takes.

    LED vs. HPS leaf temperature: Contrary to common belief, LEDs can create higher leaf temperatures than HPS at the same PPFD. HPS produces radiant heat that warms the entire room volume. LEDs concentrate photon energy more directly at the leaf, and the reduced ambient heat means less convective cooling around the leaf surface. Research in controlled environment agriculture has shown that leaf temperatures under LEDs can run 2-4°F higher than under HPS at equivalent light output, due to reduced convective air heating and more concentrated photon energy at the leaf surface.

    VPD and Irrigation Timing

    VPD directly influences when and how much you should water. Higher VPD means faster transpiration, which means faster substrate dry-back.

    The connection:

    • High VPD (>1.4 kPa): Plants drink faster. Shorter irrigation intervals or larger shot sizes may be needed. Monitor substrate VWC (volumetric water content) closely.
    • Low VPD (<0.9 kPa): Plants drink slowly. Longer intervals between irrigation events. Over-watering risk increases because the plant isn’t pulling moisture from the substrate fast enough.
    • VPD crash at night: Substrate stays wet longer during lights-off because transpiration nearly stops. This is why many commercial operations use their final irrigation event 2-3 hours before lights-off, giving the substrate time to partially dry before the VPD drops.

    This is a feedback loop. VPD drives transpiration, which drives water demand, which drives irrigation timing, which affects substrate moisture, which affects root zone oxygen availability, which affects nutrient uptake. If VPD is wrong, every downstream decision in your fertigation program is compensating for it.

    VPD Across the Facility: Room-to-Room Consistency

    Every room in a facility has slightly different thermal characteristics. South-facing walls, different HVAC duct lengths, varying insulation quality, and different equipment layouts all create room-specific VPD fingerprints.

    This matters because persistent yield differences between rooms can have environmental roots that aren’t obvious from temp and RH readings alone. If Room 1 consistently produces 3.2 lb/light and Room 3 consistently produces 2.8 lb/light with identical genetics and nutrients, comparing the VPD profiles of both rooms across a full cycle is worth investigating. Night, day, transition periods. The data often reveals the answer.

    Tracking VPD data alongside harvest outcomes over multiple runs is the only way to isolate environmental factors from everything else. One run’s data is noise. Five runs of the same strain in two rooms with recorded VPD profiles starts telling you something real about what’s driving the difference.

    Quick-Reference VPD Troubleshooting

    Symptom Likely VPD Issue Check This
    Leaf tips curling upward VPD too high Leaf temperature, airflow intensity, RH
    Leaf edges browning VPD too high + inadequate irrigation Substrate VWC, irrigation frequency
    Slow growth despite good feed VPD too low Night VPD especially. Transpiration may be stalled.
    Powdery mildew appearing VPD too low, likely at night Lights-off VPD. Target > 0.8 kPa overnight.
    Botrytis in dense flowers Night VPD crashing Dehumidification capacity during lights-off
    Uneven ripening across canopy VPD microclimates Airflow dead zones, canopy-level measurements
    Nutrient lockout despite correct pH VPD driving over/under-transpiration Match irrigation to actual VPD, not schedule

    FAQ

    What is the ideal VPD for cannabis in flower?

    During lights-on in flower, target 1.2-1.5 kPa. Early flower (weeks 1-3) can run slightly lower at 1.0-1.4 kPa during the stretch phase. Late flower (week 7+) benefits from the higher end of the range (1.2-1.6 kPa) to reduce moisture at the bud site and preserve terpenes.

    What VPD is too high for cannabis?

    Above 1.6 kPa, most cannabis cultivars show signs of water stress: upward leaf curl, reduced growth rate, and increased irrigation demand. Some desert-adapted genetics handle higher VPD, but for most commercial strains, staying below 1.5 kPa is the safe zone. Above 2.0 kPa is problematic for almost all cultivars.

    How do I calculate VPD?

    VPD = SVP(leaf temperature) – AVP(air). The saturation vapor pressure is calculated from temperature using the Tetens formula, and actual vapor pressure is derived from RH. Use a VPD calculator rather than doing this manually.

    Should I monitor VPD at night?

    Absolutely. Night VPD is where most mold and mildew problems originate. When lights go off, temperature drops, RH spikes, and VPD can crash to 0.3-0.5 kPa. Keeping lights-off VPD above 0.8 kPa should be a non-negotiable target for commercial flower rooms.

    Does VPD affect cannabis potency?

    Indirectly, yes. Terpene volatility increases at higher temperatures and VPD levels. Running excessively high VPD (and the high temperatures that usually accompany it) in late flower can reduce terpene content in the finished product. On the other end, a 2025 peer-reviewed study published in Plants (MDPI) found that elevated relative humidity during flowering, creating low VPD conditions of 0.62 kPa and below, significantly decreased cannabinoid concentrations and delayed flowering. Both extremes have documented consequences. Maintaining moderate VPD (1.2-1.5 kPa) at appropriate late-flower temperatures (72-78°F) preserves the aromatic and flavor compounds that affect perceived potency and bag appeal.

    Where can I find a cannabis VPD chart?

    The printable cannabis VPD chart above covers every temperature from 65-90°F and humidity from 35-85%, color coded by growth phase. For dynamic calculations that account for leaf temperature offset, use the Growgoyle VPD calculator.

    What VPD should I run in the dry room?

    Target 0.6-0.8 kPa at 60-65°F and 55-65% RH. Low VPD in the dry room prevents case hardening (the outside of the flower drying faster than the inside), which traps moisture and creates conditions for mold during cure. A slow, even dry at controlled VPD preserves terpenes and produces a more consistent final product.


    VPD is the metric that connects everything in your grow room: temperature, humidity, transpiration, irrigation, and ultimately yield. Understanding it turns environmental management from guesswork into a repeatable system.

    Growgoyle tracks your environment data alongside harvest outcomes across every run and uses AI to identify which climate factors actually drove results. It doesn’t track your costs. It helps you lower them through better yields and tighter consistency.

    About the Author: Eric Klamer is a 15-year software engineer who operates a commercial cannabis cultivation facility in Michigan. He built Growgoyle to run his own operation and these guides are based on real production experience, not theory.
  • Cannabis Climate Control: The Complete Guide to Grow Room Environment

    Cannabis Climate Control: The Complete Guide to Grow Room Environment

    Your genetics don’t change between runs. Your nutrients don’t change between runs. Your lights don’t change between runs. But your yields do. The variable almost every time? Environment.

    Climate control isn’t a checkbox on a facility build-out list. It’s the single biggest factor separating a 2.5 lb/light average from a 3.5 lb/light average. And the gap between those two numbers, multiplied across a commercial facility, is the difference between surviving wholesale compression and getting squeezed out.

    This guide breaks down what actually matters in grow room climate management, what the research shows, and where most operations lose yield without realizing it.

    The Four Pillars of Grow Room Climate

    Every grow room environment comes down to four things working together:

    1. Temperature controls metabolic rate and terpene preservation
    2. Humidity (and its relationship to temperature via VPD) drives transpiration and nutrient uptake
    3. CO2 fuels photosynthesis when light levels justify it
    4. Airflow distributes everything evenly and prevents microclimates

    Miss one and the other three can’t compensate. A room running perfect VPD with dead spots in airflow will still produce uneven canopies and inconsistent harvests.

    Temperature Targets by Growth Phase

    Temperature requirements shift as plants move through their lifecycle. Running the same setpoint from clone to harvest is one of the most common mistakes in commercial cultivation.

    Temperature targets by growth phase for cannabis cultivation
    Optimal temperature ranges shift with each growth phase. Late flower runs coolest to preserve terpenes.
    Phase Lights On Lights Off Key Notes
    Clone/Early Veg 78-82°F 72-76°F Higher temps promote root development. Domes help maintain humidity.
    Vegetative 76-82°F 68-74°F Warmer temps drive faster growth. Don’t exceed 85°F even with CO2.
    Early Flower (Wk 1-3) 78-82°F 68-72°F Stretch period. Slightly warmer supports internode development.
    Mid Flower (Wk 4-6) 75-80°F 65-70°F Begin stepping temps down. Resin production increases at cooler temps.
    Late Flower (Wk 7+) 72-78°F 62-68°F Coolest phase. Enhances anthocyanin expression and terpene preservation.
    Dry Room 60-65°F 60-65°F Constant. No light cycle. Target 55-65% RH.

    The DIF principle: The difference between day and night temperatures (called DIF) directly influences plant morphology. A 10-15°F DIF promotes compact growth and stronger stems. Research published in the Journal of the American Society for Horticultural Science demonstrated that negative DIF (cooler days, warmer nights) reduces stem elongation, though this is more applicable in vegetable production than cannabis flowering.

    For cannabis, maintaining a positive DIF of 8-12°F during flower is the practical sweet spot. It preserves terpene profiles (many terpenes are volatile above 80°F) while keeping metabolic processes active during the day.

    Humidity and VPD: Why RH Alone Misleads You

    Relative humidity is what most growers monitor. But RH is relative to temperature, which means the same RH percentage at two different temperatures creates completely different transpiration conditions for the plant.

    This is where Vapor Pressure Deficit (VPD) matters. VPD measures the actual drying power of the air independent of temperature. It tells you how hard the plant has to work to move water through its vascular system.

    Growth Phase Target VPD (kPa) Equivalent Conditions (example)
    Clones 0.4-0.8 78°F / 80% RH
    Veg 0.8-1.2 80°F / 65% RH
    Early Flower 1.0-1.4 80°F / 58% RH
    Late Flower 1.2-1.6 76°F / 50% RH

    When VPD is too low (humid, stagnant air), transpiration slows. Nutrient uptake drops. Stomata close. Botrytis and powdery mildew thrive.

    When VPD is too high (dry, aggressive air), plants transpire faster than roots can deliver water. Leaf edges curl. Stomata close defensively. Growth stalls.

    The critical insight: you can hit the same VPD target by adjusting temperature OR humidity. Most growers reach for the dehumidifier first, but sometimes raising the temperature 2°F achieves the same VPD shift with less energy cost.

    For a deeper breakdown of VPD calculation and optimization, see our complete VPD guide for cannabis cultivation. Or plug in your own numbers with the free VPD calculator.

    CO2 Supplementation: When It Helps and When It Doesn’t

    CO2 enrichment is one of the most oversold and under-understood inputs in commercial cannabis.

    The baseline: Ambient air contains approximately 420 ppm CO2. Plants can use more, up to a point. Research from Plant Physiology journals consistently shows photosynthetic rates in C3 plants (which includes cannabis) increase with CO2 concentration up to approximately 1,200-1,500 ppm, after which returns plateau.

    But CO2 only helps when light is the limiting factor it removes. At low light levels (below 600 PPFD), plants can’t use the extra CO2. You’re just venting money.

    CO2 response curve by light intensity
    CO2 supplementation only pays off when light levels support it. Most commercial LED rooms operate in the 900-1,200 PPFD range.

    A study by Chandra et al. (2008) in Physiology and Molecular Biology of Plants found that cannabis photosynthesis increased 50% when CO2 was raised from 250 to 750 ppm at saturating light levels. But the delta from 750 to 1,500 ppm was much smaller. The biggest bang for your CO2 dollar comes from getting to 800 ppm, not from pushing to 1,500.

    The timing mistake: CO2 should only run during lights-on. During lights-off, plants respire (consume O2, release CO2). Supplementing CO2 at night is pure waste, and can create dangerously high concentrations in sealed rooms.

    The temperature relationship: Higher CO2 levels allow plants to tolerate (and benefit from) slightly higher temperatures. At 1,200+ ppm, running 82-85°F during lights-on is acceptable and can increase photosynthetic efficiency. At ambient CO2, those temperatures cause stress.

    Airflow Design: The Invisible Yield Killer

    You can have perfect temperature, perfect humidity, and perfect CO2 levels at your sensor. And still have problems. Because your sensor measures one point in the room. The canopy doesn’t care about the average. It cares about what’s happening at leaf level.

    Canopy-level microclimates are responsible for more mold, more uneven ripening, and more inconsistent yields than most growers realize. The center of a dense canopy can be 5-8°F warmer and 15-20% higher RH than the data your controller sees.

    Common Airflow Mistakes

    • Oscillating fans pointed at the canopy create hot spots and cold spots on a timer. Constant, directional airflow from multiple angles is better.
    • Fans too strong cause wind stress, thickened stems (which sounds good but actually diverts energy from flower production), and localized drying.
    • Fans too weak or too few leave dead zones. The center of the room, directly under lights, is always the worst spot.
    • No vertical air exchange allows heat to stratify at ceiling level. Ceiling fans or ducted air returns prevent this.

    The benchmark: A well-designed commercial room moves enough air to achieve 0.5-1.0 air exchanges per minute at canopy level. This isn’t the same as HVAC air changes per hour (ACH) for the whole room. It specifically means the air touching the leaves is being replaced constantly.

    The Night Climate Problem

    Night VPD crash showing mold risk during lights-off
    When lights go off, VPD crashes into the mold risk zone. This is where most crop losses actually originate.

    Most climate discussions focus on daytime parameters. But the lights-off period is where climate control breaks down in the majority of commercial operations.

    During lights-off:

    • Temperature drops 8-15°F
    • Relative humidity spikes (same moisture content, cooler air)
    • VPD plummets into the danger zone for mold and mildew
    • CO2 from plant respiration accumulates in sealed rooms

    Night VPD management is arguably more important than daytime VPD for crop health. A room that runs 1.2 kPa VPD during the day but drops to 0.4 kPa at night is creating the exact conditions Botrytis cinerea needs to establish.

    The fix: Dehumidification ramps UP when lights go off, not down. Some operations add a small amount of supplemental heat during lights-off to keep the day/night VPD gap manageable. The target is keeping lights-off VPD above 0.8 kPa through the entire dark period.

    Sealed Rooms vs. Open Rooms

    Most commercial facilities run sealed rooms with dedicated HVAC and dehumidification. This is the right approach for flower rooms because:

    • Full environmental control (no outside air variables)
    • CO2 retention (supplemented CO2 doesn’t escape)
    • Pest pressure reduction (no intake from outdoors)
    • Humidity control (no ambient moisture entering)

    HVAC sizing rule of thumb: Plan for 4-5 tons of cooling per 1,000 square feet of canopy in a sealed room with modern LED fixtures. HPS rooms need more (6-7 tons) due to higher radiant heat.

    HVAC System Types for Commercial Grows

    Not all cooling is created equal, and the system you choose shapes how well you can manage climate long-term. Here is what each option actually looks like in a commercial flower room.

    System Type Best For Upfront Cost Operating Cost Dehumidification
    Ductless Mini-Splits Small rooms (1-4 lights) Low ($2-5K/room) Moderate Minimal. Needs standalone dehumidifier.
    Ducted Split Systems Mid-size rooms (5-20 lights) Moderate ($5-15K/room) Moderate Partial. Still needs supplemental dehumidification in flower.
    Chilled Water Systems Multi-room facilities High ($30-80K+ for chiller plant) Lowest at scale Excellent with proper air handlers. Best overall control.
    Purpose-Built Grow HVAC (Desert Aire, Surna, Quest IQ) Single rooms, 10-40 lights Moderate-High ($8-25K/unit) Low-Moderate Integrated. Designed for high-transpiration crops.

    Mini-splits are the entry point. They cool well but remove almost no moisture. In a flower room with 50+ plants transpiring gallons per day, a mini-split alone will leave you chasing humidity every night. They work for veg rooms and small personal grows. For commercial flower, plan on adding standalone dehumidification.

    Ducted split systems are the standard for rooms in the 5-20 light range. Better air distribution than wall-mounted heads, and some passive dehumidification during cooling cycles. The limitation is that cooling and dehumidification are still partially coupled. When the thermostat is satisfied, the compressor cycles off and humidity creeps back up.

    Chilled water systems are the commercial standard for multi-room facilities. A central chiller produces cold water, which circulates to air handlers in each room. The advantage: you size the chiller for the entire building’s load, and each room gets precisely the cooling it needs through its own air handler. Operating costs are significantly lower at scale, and the central plant can run at partial load during lights-off rather than cycling compressors on and off.

    Purpose-built grow room HVAC units from companies like Desert Aire, Surna, and Quest integrate cooling and dehumidification into a single system designed for the specific conditions cannabis creates. They handle the high latent loads (moisture removal) that general HVAC systems struggle with. The tradeoff is higher per-unit cost, but for a single large flower room, they often outperform a split system plus standalone dehumidifier at a similar total price point.

    Niu et al. (2020) published research in Energy and Buildings showing that LED fixtures reduce HVAC cooling requirements by 30-40% compared to HPS at equivalent light output. If you recently switched from HPS to LED, your existing HVAC may be significantly oversized, which sounds like a benefit but actually causes short-cycling: the compressor reaches setpoint too quickly, shuts off, humidity climbs, compressor kicks back on. Short-cycling wears equipment faster and creates the temperature and humidity swings that hurt consistency.

    Seasonal Climate Challenges

    Most climate control discussions assume a static outdoor environment. Reality is different. The hardest weeks to manage are not peak summer or deep winter. They are the transition seasons, when outdoor conditions swing 30-40°F in a single day and your controllers spend the whole time chasing setpoints.

    Summer

    The primary challenge is heat load stacking. Your lights produce heat. Your dehumidifiers produce heat (they are essentially refrigeration units, and all the energy they consume becomes heat in the room). Your HVAC fights both. On a 95°F day with high outdoor humidity, cooling capacity that was comfortable in April starts falling short in July.

    The secondary summer challenge is nighttime outdoor conditions. In many climates, summer nights stay warm and humid enough that there is no free cooling available from outside air. Sealed rooms handle this fine, but operations that rely on any nighttime air exchange lose their usual assist.

    Winter

    Winter flips the problem. Indoor air becomes extremely dry, especially in northern climates where outdoor air at 10°F holds almost no moisture. Humidification suddenly becomes necessary in veg rooms and clone areas. Flower rooms usually have enough transpiration to maintain humidity, but veg rooms with fewer plants per square foot can drop to 30% RH without supplementation.

    The other winter risk is cold surfaces. Exterior walls, poorly insulated ceiling corners, and any surface touching the outside can drop below the dew point of room air. Condensation forms. Mold follows. Insulation and vapor barriers on exterior walls are not optional in cold climates.

    Transitions (Spring and Fall)

    This is where the data shows the most climate failures. A day that starts at 45°F and ends at 78°F creates a moving target for HVAC. The room that was slightly over-cooled at 8 AM is under-cooled by 2 PM. Controllers that work fine in steady-state conditions lag behind rapid outdoor changes.

    The practical fix is slightly more aggressive setpoints during transition months: tighter deadbands, faster response times, and closer monitoring. Operations that track environment data across entire runs will see yield inconsistency cluster in the spring and fall harvests. That pattern is a direct signal to tighten climate control during those months. Scoring your operational efficiency across seasons helps identify whether climate is the weak link.

    The Dehumidification Challenge

    Cannabis plants transpire heavily, especially in flower. A room of 50 plants in mid-flower can release 50+ gallons of water per day into the air. If your dehumidification can’t remove it as fast as the plants release it, humidity climbs every evening and your VPD falls apart during lights-off.

    This is where most operations fail at climate control. Not during the day, when HVAC cooling provides some passive dehumidification. At night, when lights go off, temperature drops, and relative humidity spikes because cooler air holds less moisture.

    The solution is dedicated dehumidification sized for the lights-off period, not the lights-on period. Quest, Anden, and similar commercial units designed for grow rooms are built for continuous operation at the temperature and humidity ranges cannabis requires.

    Sizing rule of thumb: In flower, budget 2-3 pints of moisture removal capacity per plant per day. A 50-plant flower room needs 100-150 pints/day of dehumidification capacity. Size for the lights-off peak, not the average. The hours after lights turn off are when transpiration continues (plants don’t stop immediately) while temperature drops and RH spikes. That two-hour window after lights-off is the highest-demand period for your dehumidifier.

    Monitoring: What to Measure and Where

    A single temperature/humidity sensor on the wall tells you almost nothing about what the canopy is experiencing.

    Minimum monitoring for a commercial room:

    • Temperature and RH at canopy level (not wall-mounted, not ceiling-mounted)
    • Temperature and RH at multiple points if the room exceeds 500 sq ft
    • CO2 concentration at canopy level
    • Substrate metrics (VWC, EC, temperature) if running automated irrigation

    What sensors miss: Even good sensor placement captures a point in time at a point in space. It doesn’t capture microclimates, gradual drift within a day, or the cumulative impact of small environment deviations across an entire run.

    This is where AI-powered environment analysis adds a layer that sensors alone can’t provide. Cultivation intelligence platforms can analyze environment data alongside yield outcomes, photo-based plant health assessments, and historical batch data to identify which environmental factors actually drove results on a specific run. A sensor tells you the humidity spiked Tuesday night. AI batch analysis tells you that the same pattern preceded the quality drop in your last three harvests.

    Automation: What to Automate First

    Full environmental automation is expensive. But not all automation is equal. Some investments pay for themselves immediately, others are nice-to-have. Here is the priority order based on where manual control fails most often.

    Tier 1: Automate immediately.

    • Temperature and dehumidification. No human can maintain consistent VPD through an 8-12 hour dark period. The transition from lights-on to lights-off requires dehumidification to ramp up within minutes, not whenever someone checks the room. This is the single highest-value automation in any grow.
    • CO2 injection tied to light schedule. A simple relay that kills CO2 at lights-off prevents waste and dangerous nighttime buildup. Timer-based works. Sensor-based is better but not mandatory for most operations.

    Tier 2: High value, moderate cost.

    • Integrated environmental controllers that manage HVAC, dehumidification, and CO2 from a single brain. TrolMaster, Agrowtek, and IntelliClimate are the most common in commercial cannabis. The reason these matter: without coordination, your HVAC and dehumidifier fight each other. The HVAC cools the room (which raises RH). The dehumidifier removes moisture (which adds heat). They cycle back and forth, wasting energy and creating unstable conditions. An integrated controller manages both simultaneously to reach the combined temperature and humidity target.

    Tier 3: Nice to have.

    • Automated irrigation tied to substrate sensors. VWC-based irrigation removes the guesswork from watering frequency and helps maintain consistent rootzone conditions. Valuable, but environment automation pays off first.
    • Light dimming schedules. Stepping PPFD up gradually during early flower and dimming during the last week of flower can optimize DLI without manual adjustment. Most modern LED controllers support this natively.

    The common mistake is automating irrigation before automating climate. A perfectly watered plant in a room where VPD swings from 0.6 to 1.8 kPa every night is still going to produce inconsistent results.

    Common Climate Control Mistakes

    Symptom Likely Cause The Fix
    Same temp clone to harvest Late-flower terpene loss, early-flower slow growth Phase-specific programs with weekly adjustments
    Watching RH instead of VPD False confidence at different temps Monitor VPD directly. Use a free VPD calculator to find targets.
    CO2 running lights-off Wasted gas, dangerous concentration buildup Timer or controller kills CO2 at lights-off
    Undersized dehumidification Nightly humidity spikes, mold establishment Size for lights-off peak (2-3 pints/plant/day), not daytime
    Single sensor placement False readings that mask canopy-level problems Sensors at canopy level, 2+ points over 500 sq ft
    No DIF management Excessive stretch, flat terpene expression 8-12°F day/night difference in flower
    Ignoring night VPD Mold establishment during lights-off Ramp dehumidification at lights-off, target > 0.8 kPa
    Temp swings > 5°F during lights-on Undersized HVAC or short-cycling compressor Right-size cooling capacity; check refrigerant charge
    Condensation on walls or ceiling Insufficient insulation or cold bridging from exterior Insulate cold surfaces; add vapor barrier on exterior walls
    HVAC and dehumidifier fighting No integrated controller, equipment works against itself Integrated controller or staggered duty cycles
    Different temps at canopy vs ceiling Poor air mixing, no vertical circulation Add ceiling fans or ducted air returns for destratification
    Yield inconsistency in spring/fall harvests Transition season outdoor swings overwhelming HVAC Tighter deadbands, faster response, seasonal setpoint review

    Frequently Asked Questions

    What temperature should I run my cannabis grow room?

    It depends on the growth phase. Vegetative rooms run 76-82°F during lights-on, dropping to 68-74°F at night. Flower rooms start at 78-82°F in early flower and step down to 72-78°F in late flower. Late-flower night temps of 62-68°F help preserve terpenes and can enhance color expression.

    Is VPD more important than relative humidity?

    Yes. RH is a relative measurement that changes meaning with temperature. VPD directly measures the atmospheric demand on the plant. A room at 55% RH and 82°F has a completely different VPD than 55% RH at 72°F. Monitor VPD, not RH alone.

    How much CO2 should I add to my grow room?

    Only supplement CO2 if your light intensity supports it. Below 600 PPFD, ambient CO2 (420 ppm) is sufficient. At 900-1,200 PPFD (most commercial LED rooms), target 800-1,200 ppm during lights-on only. The photosynthetic benefit plateaus above 1,500 ppm.

    Why does my humidity spike at night?

    When lights turn off, temperature drops but the moisture content of the air stays the same. Cooler air has a lower capacity to hold moisture, so relative humidity rises. The fix is dedicated dehumidification that ramps up during the dark period, not down.

    How do I prevent mold in a grow room?

    Mold prevention is a climate control problem. Maintain VPD above 0.8 kPa during lights-off, ensure consistent airflow at canopy level, avoid dead zones, and size dehumidification for the lights-off worst case. Botrytis establishes during the exact conditions that occur when dehumidification fails at night.

    How many BTUs do I need for a grow room?

    The standard estimate for LED flower rooms: 3,500-4,000 BTU per 1,000W equivalent of LED lighting. A 24-light room running 720W LEDs produces roughly 17,000W of heat load, which translates to approximately 60,000 BTU of required cooling capacity. Always oversize by at least 20% to account for dehumidifier heat output, which adds back into the room. Facilities that switched from HPS to LED may have oversized HVAC that short-cycles. Caplan et al. (2019) in HortScience documented that LED-grown cannabis achieved comparable yields to HPS at lower environmental heat loads, which directly affects HVAC sizing requirements.

    What size dehumidifier do I need for a grow room?

    In flower, budget 2-3 pints of removal capacity per plant per day. A 50-plant flower room needs 100-150 pints/day of dehumidification capacity. The critical sizing factor is lights-off performance, not rated capacity at standard conditions (most manufacturers rate at 80°F/60% RH, which is warmer than your lights-off room). Check the unit’s performance specs at 65-70°F, which is closer to your actual lights-off conditions. Many units lose 30-40% of their rated capacity at lower temperatures.

    How do I control humidity in a sealed grow room at night?

    Three strategies work together. First, dedicated dehumidification that ramps up the moment lights turn off, not when humidity reaches a threshold (by then it is already too high). Second, a small reheat coil or supplemental heat that prevents temperature from dropping too fast. Slowing the temperature decline reduces the RH spike. Third, consistent airflow through the canopy during the entire dark period. The target: VPD stays above 0.8 kPa through the full lights-off cycle. Monitor VPD at canopy level, not at your wall sensor, since the canopy microclimate is always more humid than ambient room conditions.


    Climate control is the foundation every other input sits on. Genetics, nutrients, and light only express their potential when the environment lets them. For operations serious about consistent yields, tracking environmental data alongside harvest outcomes across every run is the only way to know whether your climate program is working or just working sometimes.

    Knowing what your environment costs you starts with knowing your cost per pound. Once you have that number, the question becomes which operational factors are keeping it higher than it should be.

    Growgoyle analyzes your environment data alongside yield, quality, and plant health data to identify what actually drove results on each run. It doesn’t track your costs. It helps you lower them through better yields and tighter consistency.

    About the Author: Eric Klamer is a 15-year software engineer who operates a commercial cannabis cultivation facility in Michigan. He built Growgoyle to run his own operation and these guides are based on real production experience, not theory.
  • Cannabis Post-Harvest Optimization: The Complete Guide to Drying, Trimming, and Preserving Quality

    Cannabis Post-Harvest Optimization: The Complete Guide to Drying, Trimming, and Preserving Quality

    Cannabis Post-Harvest Optimization: The Complete Guide to Drying, Trimming, and Preserving Quality

    Every cannabis operation obsesses over flower. Genetics, environment, nutrients, training, light intensity. All of it matters. But here’s what the data consistently shows: the two weeks after harvest are where 10 to 20% of your crop’s value can quietly disappear. Overdried flower. Sloppy trim. Inconsistent cure. These aren’t dramatic blowups. They’re slow leaks that show up in your cost per pound and your buyer’s willingness to reorder.

    The best cannabis facilities treat post-harvest as its own discipline. They have protocols, target numbers, and checkpoints from the moment plants come down to the moment jars get sealed. This guide walks through the full cannabis post-harvest optimization pipeline: harvest timing, drying, dry weight, trimming, water activity, curing, and the batch review that ties it all together.

    Where Post-Harvest Value Actually Disappears

    Think of your harvested cannabis as a depreciating asset. Every hour after chop, decisions (or lack of decisions) either preserve value or destroy it. The losses compound through each stage of the pipeline.

    Post-harvest value loss funnel showing where cannabis quality erodes from harvest through packaging
    Value loss compounds through each post-harvest stage. Small percentages at each step add up fast.

    Overdrying alone can cost you 3 to 5% of dry weight in lost moisture, and that’s before you factor in trichome degradation from brittle, over-handled flower. A trim crew running without clear SOPs can push trim ratios 5 to 10 points worse than your best runs. Flower that tests at the wrong water activity gets rejected, discounted, or develops mold in the bag. None of these are catastrophic on their own. Together, across 50 or 100 runs a year, they define your margins.

    The pattern across top-performing operations is consistent: they measure at every stage, they have target ranges, and they review the data after every run. The operations that treat post-harvest as “just hang it and bag it” are the ones wondering why their numbers are flat while running the same genetics as everyone else.

    Harvest Timing: Setting the Baseline

    Cannabis post-harvest optimization starts before anything gets cut down. Harvest timing determines your starting material, and everything downstream depends on it.

    Trichome maturity is the call. You’re looking at the ratio of clear to milky to amber trichome heads under magnification. Most commercial operations target predominantly milky with 10 to 20% amber, but the right ratio depends on the cultivar and what your market wants. The biggest harvest timing mistake isn’t pulling early or late. It’s not having a consistent protocol for the decision. If harvest timing is a gut call that changes depending on who’s looking, your starting material varies run to run, and that variance carries all the way through dry and trim.

    Document the decision criteria. Take photos of trichome condition at harvest. This becomes data you can reference when comparing runs later.

    Drying: The Make-or-Break Phase

    If there’s one stage where cannabis post-harvest quality is won or lost, it’s the dry. Get it right and you preserve terpenes, maintain structure, and hit target moisture. Get it wrong and you’re dealing with hay smell, crumbling buds, or (worse) mold.

    The target ranges most commercial operations work within: 60 to 65°F and 55 to 65% relative humidity, with a dry time of 10 to 14 days for whole-plant hang. But those numbers are starting points, not gospel. Room size, plant density, airflow design, and even the cultivar’s bud structure all influence the actual protocol.

    Cannabis drying protocol timeline showing temperature, humidity, and airflow targets across a 14-day dry
    A controlled dry isn’t a single setting. Environmental targets shift across the drying window.

    What separates good drying from great drying is control and consistency. The room should do the same thing every time, regardless of season, load size, or who’s working that day. Environmental drift during the dry is one of the most common (and most fixable) sources of batch-to-batch variation. If your dry room swings 10°F between day and night, or humidity spikes when you load a fresh batch, that shows up in the final product.

    We go deep on room setup, airflow, and monitoring in the full cannabis drying room management guide.

    Dry Weight Optimization: Stop Leaving Pounds on the Table

    Here’s a number that doesn’t get enough attention: how much dry weight you’re losing to overdrying. Cannabis that’s dried below the optimal moisture window doesn’t just smoke harsh. It weighs less. And you sell by weight.

    A batch that finishes at 8% moisture instead of 11% has lost roughly 3% of its sellable weight purely from excess moisture removal. On a 100-pound harvest, that’s 3 pounds gone. At estimated wholesale of $500 to $600 per pound, that’s $1,500 to $1,800 evaporated because the dry ran a day too long or the room was a few degrees too warm.

    That math alone should make dry weight optimization a priority. But the weight loss isn’t even the worst part. Overdried cannabis is brittle, which means more trichome loss during handling and trim. The quality degradation compounds on top of the weight loss.

    The fix is straightforward: measure moisture at multiple points during the dry, know your target range, and pull when the data says pull. Not when the room “feels” done. Not based on stem snap alone. Consistent measurement, consistent results.

    Trimming: Where Labor Meets Quality

    Trim is the most labor-intensive stage of cannabis post-harvest processing, and it’s where a lot of money either gets saved or burned. Your trim ratio (the percentage of starting weight that becomes sellable flower versus trim waste) is one of the clearest indicators of post-harvest efficiency.

    Trim ratio comparison showing variance across runs and the cost impact of inconsistent trimming
    Trim ratio variance across runs. The gap between your best and worst represents real dollars.

    A tight cannabis trim ratio means more of what you grew ends up in saleable bags. A loose or inconsistent ratio means you’re paying a crew to turn flower into trim waste beyond what’s necessary. The spread between your best trim run and your worst tells you exactly how much room there is to tighten up.

    Factors that drive trim ratio: bud structure (genetics and grow-side decisions), how well the dry preserved flower integrity, trim crew training and SOPs, and whether you’re hand-trimming, machine-trimming, or running a hybrid approach. Each has tradeoffs, and the right choice depends on your scale and quality tier.

    The full breakdown on benchmarks, crew management, and efficiency gains is in the cannabis trim ratio optimization guide.

    Water Activity: The Number That Protects Your Product

    If you’re not measuring water activity (aw), you’re guessing at shelf stability. Moisture content tells you how much water is in the flower. Water activity tells you how available that water is for microbial growth. That distinction matters enormously for storage, compliance, and quality preservation.

    Cannabis water activity target zones showing the optimal 0.55-0.63 aw range for shelf stability
    The target zone: 0.55 to 0.63 aw balances shelf stability with terpene and weight preservation.

    The optimal aw range for cured cannabis flower is 0.55 to 0.63. Below 0.55, the flower is overdried: brittle, harsh, and lighter than it needs to be. Above 0.65, you’re in the danger zone for mold and microbial growth. The sweet spot preserves terpenes, maintains a pleasant smoke, and keeps the product stable on shelf.

    A quality aw meter runs $300 to $600. For a commercial cannabis operation, that’s one of the highest-ROI instruments you can buy. One rejected batch from a dispensary or one mold issue in storage costs more than the meter. Measure aw at the end of dry, after cure, and before packaging. Three checkpoints, consistent protocol.

    We cover the science, measurement protocols, and common mistakes in the full cannabis water activity guide.

    Curing: Locking in Quality

    Curing is where good flower becomes great flower. The biochemistry is straightforward: residual chlorophyll breaks down, terpene profiles develop, and moisture equilibrates throughout the bud. Rush it and you get a harsh, grassy product. Skip it entirely and you’re leaving quality (and customer satisfaction) behind.

    A proper cannabis cure typically runs 2 to 4 weeks in sealed containers at 60 to 65°F, with periodic burping in the first week. Commercial operations handling large volumes often use sealed bins or totes with humidity packs rather than traditional mason jars. The principle is the same: controlled, slow moisture equalization in a stable environment.

    The cure is also your last chance to catch problems. If aw readings drift up during the first few days of cure, that tells you the dry wasn’t as complete as it seemed. If you’re seeing ammonia smell, anaerobic conditions are developing. These are signals, and the earlier you catch them, the more product you can save.

    Cannabis post-harvest quality checkpoint flowchart from harvest through packaging
    Quality checkpoints at each stage catch problems before they compound downstream.

    The Batch Review: Closing the Loop

    Here’s where most cannabis operations leave the biggest gains on the table. The run is done, the product is packaged, and everyone moves on to the next cycle. No structured review. No comparison to previous runs. No record of what worked and what drifted.

    A batch review after every harvest is what turns individual runs into a system that improves over time. Without it, your best run and your worst run teach you the same amount: nothing. The review doesn’t need to be complicated. It needs to be consistent.

    The key questions: What were the final yield numbers? How did the dry perform against targets? What was the trim ratio? Where did aw land? And the big one: how does this compare to the last run of the same cultivar in the same zone?

    The complete framework for structuring this review is in the cannabis batch review post-harvest checklist. If you want to see how AI can automate the comparison and surface the patterns that matter, the AI batch analysis breakdown explains how that works in practice.

    This is the piece that separates operations that plateau from operations that compound improvements. Every run generates data. The question is whether that data goes anywhere. The facilities with the tightest cost per pound aren’t the ones with the best single run. They’re the ones where the gap between their best and worst run keeps shrinking. That only happens with structured review, and it accelerates dramatically when the review process has real data to work with instead of memory and gut feel.

    Treating Post-Harvest as a Discipline

    Cannabis post-harvest optimization isn’t one big fix. It’s a series of small, measurable decisions at each stage. Harvest timing, dry room control, dry weight preservation, trim efficiency, water activity targets, cure protocols, and batch review. Each one compounds with the others.

    The operations that do this well aren’t running fancier equipment. They’re measuring more, reviewing more, and making smaller adjustments more frequently. The data from each run feeds the next one. If you’re looking at your overall yield consistency and wondering why identical setups produce different results, start with post-harvest. The variance hiding there is often bigger than what’s happening in the grow room.


    Growgoyle doesn’t replace your post-harvest protocols. It gives you the data and AI analysis to refine them run after run. Upload canopy photos, track your batches, and see what each harvest actually produced. Already mid-flower? Start there. Try it free.

    About the Author

    Eric is a 15-year software engineer who operates a commercial cannabis cultivation facility in Michigan. He built Growgoyle to solve the problems he faces every day: inconsistent yields, forgotten lessons from past runs, and the constant pressure to lower cost per pound. Every feature in Growgoyle comes from real growing experience, not a product roadmap.

  • Michigan Cannabis Market Q2 2026: Prices, Licenses, and What Operators Need to Know

    Michigan Cannabis Market Q2 2026: Prices, Licenses, and What Operators Need to Know

    Michigan Cannabis Market Q2 2026: Prices, Licenses, and What Operators Need to Know

    Michigan’s cannabis market just posted its strongest single sales day in history. On 4/20, the state moved $20.4 million in one day (Hemp Gazette, May 2026). April adult-use sales hit $258.17 million, bouncing back hard from a January low of $224.4 million. By pure sales volume, Michigan is the #2 cannabis market in the country, trailing only California’s $311.2 million in April.

    So everything’s great, right? Not if you’re growing it.

    The Michigan cannabis industry in 2026 is a paradox. Consumers are buying more cannabis than ever. Retailers are moving record volume. And the cultivators supplying all of it are getting squeezed harder every quarter. If you’re operating a commercial cannabis grow in Michigan right now, this is the field guide for Q2. Not predictions. Not investor-grade optimism. Just the numbers, the regulatory shifts, and what the operators who are still standing are actually doing.

    The Sales Paradox: More Pounds, Less Money

    Here’s the number that should be pinned to every cultivation office wall in the state: Michigan sold 260,000 more pounds of cannabis in 2025 than in 2024. Total adult-use revenue for 2025 was $3.17 billion (Michigan CRA data). That sounds like growth until you realize the 2024 total was $3.28 billion. The market moved a quarter million more pounds and generated $113 million less revenue.

    Michigan cannabis sales vs volume paradox: more pounds sold, less total revenue in 2025 vs 2024
    Michigan sold 260K more pounds in 2025 than 2024, but generated $113M less revenue. Volume up, revenue down.

    That’s the oversupply cycle in a single data point. Operators produce more to maintain revenue. Prices drop. Margins collapse. So they produce more. Michigan has earned the nickname “the Walmart of weed” for a reason (Crain’s Detroit Business, May 2026). Average retail flower price hit roughly $59 to $62 per ounce in April 2026 according to Weedmaps and CRA data. That’s down from $240+ per ounce just a few years ago. An 8.2% year-over-year decline in February alone (Weedmaps, 2026).

    If retail is sitting around $60 an ounce, work backward. Dispensary margins, taxes, testing, transport. The wholesale number that lands in a grower’s pocket is getting brutal. Estimated wholesale flower prices in Michigan are running in the $500 to $600 per pound range for most operators. At that price point, your cost per pound determines whether you’re building a business or subsidizing one. If you’re not tracking what your cost per pound actually is, now is the time: here’s how to calculate the real number.

    Wholesale Price Compression Is Still Accelerating

    Michigan cannabis wholesale price trend showing multi-year decline
    Michigan wholesale cannabis flower prices have been in freefall. The compression is structural, not cyclical.

    This price compression isn’t a dip. It’s structural. Michigan has more licensed canopy per capita than almost any state in the country, and the excess capacity hasn’t worked its way out yet. Every quarter, a few more growers close. But the remaining operators are getting more efficient, which means the floor keeps dropping.

    The growers who treat this like a temporary slump are the ones closing. The ones treating it as the new normal are investing in consistency, yield optimization, and operational systems that compound over time. If you’re running the same playbook you ran in 2023, the math doesn’t work anymore. The operators pulling ahead are the ones who’ve figured out how to scale output from their existing footprint instead of chasing more canopy.

    License Attrition: 940+ Grower Licenses Gone in Six Years

    The Michigan CRA database tells the consolidation story clearly. As of May 2026, the state has 950 active grower licenses: 9 Class A, 71 Class B, 808 Class C, and 62 Excess. Back in January 2026, that number was 964. That’s 14 grower licenses gone in five months.

    Michigan cannabis grower license attrition over 6 years showing 940+ licenses lost
    Michigan has shed over 940 grower licenses in six years. 2025 saw the first year-over-year decline: 85 licenses gone.

    Zoom out further: over six years, Michigan has lost approximately 940 grower licenses. In 2025 alone, 85 licenses disappeared, marking the first clear year-over-year decline in active grower counts. Nationally, 13% of all cannabis licenses have vanished in the past two years (Headset, 2026). Michigan is contributing heavily to that number.

    The smaller operations are under the most pressure. Declining margins, rising compliance costs, insurance, labor. These fixed costs don’t scale down when wholesale prices drop by half. The operators folding aren’t necessarily bad growers. They’re operations where the economics simply stopped working at current price levels. Industry consolidation in Michigan is “likely inevitable” according to market analysts (Crain’s Detroit Business, May 2026).

    The 24% Wholesale Tax: A Slow Fuse

    Michigan’s new 24% wholesale tax (passed in 2025 legislation) is now in effect. If you haven’t felt it yet, you will. According to Robin Schneider of the Michigan Cannabis Industry Association, retailers are still selling through pre-tax inventory. The full consumer price impact hasn’t hit yet. When it does, the question is simple: does the retailer pass it through to the consumer, or does it get pushed back upstream to the grower?

    If you’ve been in this industry for more than a cycle, you already know the answer. In a market with $60 ounces and a customer base trained on bargain pricing, retailers will protect their price point. That tax is going to show up as tighter margins for cultivators, not higher shelf prices. Another reason your cost per pound needs to be as low as you can possibly get it.

    Regulatory Shifts: Schedule III, Rec Hearings, and CRA Enforcement

    Two big regulatory developments are in play right now.

    Medical cannabis moved to Schedule III on April 28, 2026. The immediate impact for operators: Section 280E tax relief. Cannabis businesses can now take standard business deductions that were previously disallowed. This is real money back in your pocket. If your accountant hasn’t updated your quarterly estimates, get on the phone.

    Recreational rescheduling hearings begin June 29, 2026. If recreational cannabis also moves to Schedule III, the tax implications expand further. Worth watching, but don’t plan around it yet.

    On the enforcement side, the CRA cracked down on 39 cannabis companies in May 2026 for sales, tracking, and security violations (MI Tech News, May 2026). The message is clear: the state is tightening compliance, not loosening it. Running a clean operation isn’t optional. It’s table stakes.

    The Ohio Factor

    Michigan’s border communities (Monroe, Niles, Benton Harbor) have always drawn out-of-state traffic. With Ohio’s recent THC crackdown pushing enforcement on their side of the border, expect even more buyers to make the drive. This props up retail volume but does almost nothing for wholesale prices. More transactions at $60 an ounce still translates to compressed margins for cultivators.

    For operators near the border, it’s worth paying attention to foot traffic patterns. For everyone else, Ohio’s regulatory moves are background noise. Your margins are determined by what happens inside your facility, not what happens at the state line.

    What the Surviving Operators Are Doing Differently

    Here’s where it stops being a market report and starts being useful. The Michigan cannabis growers who are surviving (and in some cases growing) in this environment share a few common traits. None of them are secrets. All of them require discipline.

    Four factors that differentiate surviving Michigan cannabis operators: yield consistency, cost per pound focus, data-driven decisions, operational systems
    The four factors separating operators who are growing from operators who are closing.

    1. They know their cost per pound, and they attack it. Not as a vague concept. As an actual number they can recite. The two primary levers are yield and consistency. Yield is the biggest single driver of low cost per pound. Consistency is the multiplier. Hitting 2.5 lbs per light once is a good story. Hitting it eight runs in a row is a business. If your yields swing 20% between runs, you’re leaving money on the floor every cycle.

    2. They track batches and learn from them. Every run is a data set. The operators pulling ahead are the ones who do a real post-harvest review: what worked, what changed, what to carry forward into the next run. The ones who just reset and plant again are repeating the same patterns. In a market this tight, repeating patterns you haven’t examined is expensive.

    3. They’ve stopped guessing at environment. VPD drift, DLI inconsistency, overnight temperature swings. These are the invisible yield killers that don’t show up until harvest day. The best operators are connecting environment data to yield outcomes, not just watching a dashboard in real time. Real-time dashboards tell you what’s happening now. Connecting that data to harvest results tells you what actually mattered.

    4. They’re building systems, not depending on memory. The “master grower carries everything in their head” model doesn’t scale, and it definitely doesn’t survive a compressed market. When one person holds all the institutional knowledge and that person has a bad week, the whole operation drifts. The surviving facilities are the ones that have systematized their cultivation knowledge so it compounds run over run, regardless of who’s on the floor.

    The Real Question for Michigan Cannabis Growers in 2026

    This market is not going to get easier. Wholesale prices aren’t recovering to 2021 levels. The 24% tax will compress margins further. More licenses will go dark. That’s not doom. That’s just the maturation curve every agricultural commodity goes through.

    The question isn’t whether you have problems. Every operation does. The question is whether your rate of improvement is faster than the rate the market is squeezing you. The growers who survive aren’t the ones with zero issues. They’re the ones who systematize learning so they improve faster than the market compresses.

    If you’re still standing in Michigan in May 2026, you’ve already proven you can grow. The next phase is proving you can improve, consistently, run after run, with data backing every decision. That’s the only path forward in a $500 to $600 wholesale market.


    Growgoyle doesn’t track your costs. It helps you lower them. In a market this compressed, the only lever you fully control is your cost per pound, and the only way to attack it is better yields and tighter consistency. See the full system built by a grower operating in this exact market. See how it works.

    Get Michigan market updates every Wednesday.

    The Michigan Cannabis Market Intel newsletter covers wholesale prices, license changes, enforcement actions, and what it all means for operators. Free, no fluff. Sign up here →

    About the Author

    Eric is a 15-year software engineer who operates a commercial cannabis cultivation facility in Michigan. He built Growgoyle to solve the problems he faces every day: inconsistent yields, forgotten lessons from past runs, and the constant pressure to lower cost per pound. Every feature in Growgoyle comes from real growing experience, not a product roadmap.

  • Cannabis Grow Room Optimization: The 5 KPIs That Actually Matter

    Cannabis Grow Room Optimization: The 5 KPIs That Actually Matter

    Cannabis Grow Room Optimization: The 5 KPIs That Actually Matter

    How do you optimize a cannabis grow room? Not with a new nutrient line. Not with a lighting upgrade. Not with a VPD chart taped to the wall (though that helps). You optimize by measuring the right things after every harvest, spotting the patterns, and acting on them. That’s it. The entire discipline of cannabis grow room optimization comes down to a feedback loop: measure, analyze, adjust, repeat.

    The problem is that most commercial cannabis operations either track too many vanity metrics (yield per square foot, anyone?) or track nothing at all. They run on gut feel and memory. And gut feel doesn’t compound. Data does.

    These are the five cannabis cultivation KPIs that actually predict whether your facility is getting better or getting worse. They’re the ones that show up in every conversation I have with operators who are consistently profitable. If you measure all five and review them after every batch, you will improve. Not because you’ll suddenly discover some secret technique, but because the data will show you exactly where the gaps are.

    Key Findings: The 5 KPIs That Drive Cannabis Facility Performance

    The 5 KPIs that drive commercial cannabis facility performance are: yield per light (production efficiency), cost per pound (financial health), yield consistency / CV% (operational reliability), canopy fill rate (space utilization), and labor hours per pound (workforce efficiency). Operations that track all five and review them after every batch consistently find opportunities to reduce costs and improve output that they would otherwise miss.

    Cannabis Grow Room Optimization KPIs at a Glance
    KPI What It Measures Target Range How to Calculate Why It Matters
    Yield per light Production efficiency per fixture 2.0-3.5+ lb/light (LED 600-700W) Total dry weight ÷ number of lights Primary production metric, normalizes for room size
    Cost per pound All-in cost to produce one pound Varies ($200-800+ by market/scale) Total annual operating cost ÷ total annual dry weight Determines survival in a compressed wholesale market
    Yield consistency (CV%) Run-to-run repeatability <10% dialed in, 10-20% solid, >20% high variation Standard deviation ÷ mean of yield per light across 4+ harvests Hitting big numbers once means nothing if you can’t repeat
    Canopy fill rate Space utilization efficiency 85-95% canopy coverage at flip Filled canopy area ÷ total available canopy area Empty space under lights is wasted electricity and rent
    Labor hours per pound Workforce efficiency 8-15 hrs/lb (varies by automation) Total cultivation labor hours ÷ total dry weight Second largest cost center after fixed overhead

    1. Yield Per Light: The Primary Cannabis Production Metric

    There’s a reason the best cannabis growers talk in pounds per light, not pounds per square foot or pounds per plant. Light is the energy input that drives photosynthesis and biomass production. It’s the common denominator. Whether you’re running a 10-light room or a 200-light warehouse, yield per light lets you compare apples to apples.

    Yield per square foot is a vanity metric because it rewards cramming more lights into a space rather than optimizing what each fixture produces. Per plant is even worse because plant count is a function of your growing style (SOG vs. SCROG vs. multi-top), not your efficiency.

    Benchmarks by fixture type:

    • HPS 1000W: 2.0-2.5 lb/light is solid performance
    • LED 600-700W: 2.5-3.5 lb/light is the target range for most commercial cannabis operations
    • LED with CO2 supplementation (1,200-1,500 ppm): 3.0-4.0+ lb/light is where top facilities operate

    What drives yield per light: Genetics selection has the largest single impact (20-40% yield difference between cultivars under identical conditions). After that, DLI management is the next biggest lever. Research by Rodriguez-Morrison et al. (2021) demonstrated that cannabis yield increases linearly with DLI up to approximately 40-50 mol/m²/day before diminishing returns set in. CO2 supplementation extends that ceiling further. Chandra et al. (2008) showed photosynthetic rates increasing significantly at elevated CO2 concentrations, which translates directly to more dry weight when paired with adequate light intensity. VPD optimization ties it all together: keeping transpiration rates in the right range means the plant can actually use the light and CO2 you’re giving it.

    If you’re not tracking yield per light after every harvest, you’re flying blind on your most important production metric. Start with the free efficiency scorecard to see where you stand.

    2. Cost Per Pound: The Number That Determines Survival

    Wholesale cannabis prices keep compressing. In most mature markets, flower is moving at an estimated ~$500-600 per pound and trending down. You can’t control wholesale price. The only thing you can control is what it costs you to produce a pound. That makes cost per pound the single most important financial metric in commercial cannabis.

    Here’s where most operations get it wrong: they think they know their cost per pound, but they’re only counting the obvious line items. Nutrients, electricity, maybe labor. The reality is that a complete cost per pound calculation has 20-27 cost categories. Rent, insurance, loan payments, testing fees, compliance costs, equipment depreciation, waste disposal, packaging, security, accounting, legal, licensing renewals. All of it goes into the denominator.

    Most growers underestimate their real cost per pound by 20-40%. That’s not a guess. It’s a pattern that shows up consistently when operations actually run the full calculation.

    The relationship between yield and cost per pound is straightforward: your fixed costs (rent, insurance, loan payments, base electricity, management overhead) stay the same whether you pull 2.3 or 2.8 pounds per light. Every additional pound spreads those fixed costs thinner. Better yield equals lower cost per pound. It’s the most direct path to better margins.

    Run the free cost per pound calculator to get your real number. It takes five minutes and it’s usually an eye-opener.

    One important distinction: Growgoyle doesn’t track your costs. It helps you lower them through better yields and consistency. The calculator gives you a snapshot. The platform helps you improve the inputs that drive cost per pound down over time.

    3. Yield Consistency (CV%): The Multiplier

    This is the KPI that separates good cannabis operations from great ones. Yield consistency, measured as the coefficient of variation (CV%), tells you how repeatable your results are from run to run.

    How to calculate CV%: Take the standard deviation of your yield per light across your last 4+ harvests, divide it by the mean, and multiply by 100. That’s your coefficient of variation.

    Example: if your last six runs came in at 2.8, 2.6, 3.0, 2.4, 2.9, and 2.7 lb/light, your mean is 2.73 and your standard deviation is about 0.20. Your CV% is roughly 7.5%. That’s dialed in.

    Now consider another facility that hit 3.5, 2.1, 3.0, 2.3, 2.8, and 2.0. Mean of 2.62, standard deviation of 0.57. CV% of 21.7%. That operation has a higher peak, but its average is lower and the swings are costing real money every cycle.

    Cannabis yield consistency gap across harvest cycles showing the dollar cost of variation
    The consistency gap: the distance between your average and your best run is almost pure lost margin.

    Why consistency matters more than peak performance: If every harvest matched your best run, the gap between that and your actual average is almost pure margin. Your rent, electricity, insurance, and loan payments stay the same whether you pull 2.8 or 2.3 per light. The delta is profit you’re leaving on the table.

    Benchmarks:

    • <10% CV: Locked in. The operation is repeatable and predictable.
    • 10-20% CV: Solid, but there’s room to tighten up. Something is varying between runs.
    • >20% CV: High variation. This is costing real money every cycle.

    But consistency requires data, and you can only measure it if you’re logging results. A whiteboard in the flower room captures today. It doesn’t capture 6 runs ago. Every harvest that passes without recording the numbers is another data point you’ll never get back.

    Check your consistency with the free yield consistency calculator. Plug in your last several harvests and see where you land.

    4. Canopy Fill Rate: Hidden Cannabis Cultivation Efficiency

    Canopy fill rate measures the percentage of available canopy space that’s actually filled with productive plant material at the time you flip to flower. It’s a simple concept with outsized impact on your bottom line.

    Target range: 85-95% canopy coverage at flip.

    Below 85%, you’re wasting light, electricity, and rent on empty space. Every square foot of canopy that isn’t filled with productive plant tissue is a square foot of photons hitting the floor. Above 95%, you start running into crowding issues: restricted airflow, humidity pockets, increased disease pressure, and inner canopy that never sees enough light (popcorn, larf, poor penetration).

    What hurts canopy fill rate:

    • Uneven plant sizes: Clone variation, inconsistent rooting times, and transplant timing all create an uneven canopy at flip
    • Late transplants: Plants that go in late never catch up, leaving gaps
    • Poor training consistency: If training protocols aren’t standardized across the team, canopy uniformity suffers
    • Plant health issues: HLVd-infected plants growing slower than their neighbors create visible gaps and drag down the average

    How to improve it: Consistent clone selection, standardized training protocols that the whole team follows, and regular plant health monitoring. Photo documentation during veg is one of the most effective tools here. A canopy photo at Week 2 and Week 4 of veg makes fill rate issues obvious before flip, when you can still do something about them. Growgoyle’s AI photo analysis can spot these issues early and flag them with specific recommendations.

    Canopy fill rate is also the one KPI on this list that’s a leading indicator. You can see it and act on it during the run, not just after harvest. That makes it uniquely valuable for in-cycle course correction.

    5. Labor Hours Per Pound: The Hidden Cost Center

    Labor typically accounts for 15-25% of total operating cost in a commercial cannabis facility. That makes it the second largest cost center after fixed overhead for most operations. Yet very few growers track labor hours per pound.

    How to calculate it: Total cultivation labor hours (everything from transplant through cure) divided by total dry flower weight in pounds. Include trim, harvest, hang, buck, trim again, packaging. All of it.

    Target benchmarks: 8-15 hours per pound is a wide range, and where you fall depends heavily on your level of automation. A hand-watered, hand-trimmed operation will naturally sit higher. A facility with automated irrigation, machine trim, and conveyor-based harvest workflows will sit lower. The absolute number matters less than the trend. If labor hours per pound is going up over time, something is getting less efficient.

    What drives labor hours per pound up:

    • Manual processes that could be automated: Hand-watering is the most common example
    • Inconsistent SOPs: When every team member does things slightly differently, tasks take longer and quality varies
    • Rework from preventable problems: An uneven canopy means more trim labor. Pest pressure means more IPM hours. Mold means discarded product and rework. Every problem that could have been prevented shows up as extra labor.

    This is where batch tracking starts paying off in unexpected ways. When you can see which tasks consumed disproportionate labor relative to their yield impact, priorities get clearer. Growgoyle’s daily task management and AI-guided priority system helps here by surfacing what needs attention today, not just what feels urgent.

    How These Cannabis Cultivation KPIs Work Together

    These five KPIs don’t exist in isolation. They form a system, and improvements in one area compound through the others.

    How the 5 cannabis grow room optimization KPIs compound together
    Improving each KPI by 10% doesn’t give you 10% better economics. The compounding effect delivers 25-40%.

    Yield per light and cost per pound are inversely related. More yield per light means more pounds over which to spread your fixed costs. A 10% yield increase can translate to a 15-20% cost per pound reduction because fixed costs don’t move.

    Consistency multiplies the effect of every other improvement. Finding a technique that adds 0.3 lb/light is great. Repeating it every run is what actually changes your annual numbers. A facility that averages 2.8 lb/light with 8% CV will outperform one averaging 3.0 with 22% CV over the course of a year.

    Canopy fill rate is a leading indicator. Unlike the other four KPIs (which you measure after harvest), canopy fill rate is visible during the run. It’s the early warning system. Low fill rate at flip reliably predicts lower yield per light at harvest.

    Labor efficiency improves naturally when other KPIs improve. Fewer problems means less rework. Consistent SOPs mean consistent execution times. Better canopy uniformity means faster, cleaner harvests. You don’t have to “optimize labor” directly. Fix the upstream KPIs and labor hours per pound comes down on its own.

    The compounding effect is real. Improving each KPI by 10% doesn’t give you 10% better facility economics. Because these metrics interact and compound through each other, small improvements across all five add up to significantly more than any single metric improvement alone. That’s the power of a system-level approach to cannabis grow room optimization.

    Benchmark Your Operation in 60 Seconds

    Start with the efficiency scorecard to see where your KPIs stand. Then run the cost per pound calculator. Then check your consistency score. Three free tools, no signup required. Growgoyle doesn’t track your costs. It helps you lower them.

    Efficiency Scorecard →
    Cost Per Pound Calculator →
    Yield Consistency Check →

    Track All 5 KPIs Automatically

    Growgoyle’s AI tracks your yield, analyzes every batch, monitors consistency trends, and gives you daily guidance on what to focus on. Upload a photo and see what the AI catches. 60 seconds, free, no signup.

    Analyze Your Plants Free
    Start Free Trial →


    Growgoyle doesn’t track your costs. It helps you lower them. Upload a few canopy photos and see what the AI catches. Try it free on your own plants.

    About the Author

    Eric is a 15-year software engineer who operates a commercial cannabis cultivation facility in Michigan. He built Growgoyle to solve the problems he faces every day: inconsistent yields, forgotten lessons from past runs, and the constant pressure to lower cost per pound. Every feature in Growgoyle comes from real growing experience, not a product roadmap.

  • Cannabis Batch Tracking: From Spreadsheets to AI Analysis

    Cannabis Batch Tracking: From Spreadsheets to AI Analysis

    Cannabis Batch Tracking: From Spreadsheets to AI Analysis

    You track batches because the state requires it. Every commercial cannabis grower does. Metrc gets its plant counts, harvest weights, and chain of custody documentation. The state is happy. You move on to the next run.

    But here’s the thing: compliance tracking tells the state where your plants are. It tells you absolutely nothing about how to grow better. The grower who treats cannabis batch tracking as a performance system (comparing run over run, scoring outcomes, identifying what actually changed) is the grower whose cost per pound drops every quarter. Everyone else just repeats the same run and hopes the numbers come out different.

    Cannabis Batch Tracking Methods Compared

    Method What It Tracks Analysis Capability Effort Level Cost Best For
    Paper logs / whiteboards Basic notes (strain, dates, visual observations) None (review from memory) High (manual entry, hard to search) Free Very small grows, hobbyists
    Spreadsheets (Excel, Google Sheets) Environment data, yields, notes (whatever you type in) Manual (pivot tables, charts if you build them) Medium (data entry + formula maintenance) Free 1-2 room operations, getting started
    Seed-to-sale / METRC Plant counts, transfers, harvest weights, destruction, test results Compliance reporting only (not designed for cultivation improvement) Medium (required by law) Varies by state Legally required in regulated states
    Sensor dashboards (standalone) Temperature, humidity, VPD, sometimes substrate data Historical charts, threshold alerts Low (automatic collection) $50-500/mo + hardware Operations focused on environment monitoring
    Sensor + hardware platforms (AROYA) Environment + irrigation + substrate (VWC, EC) Equipment control, irrigation automation Low-Medium (hardware dependent) $$$$ (proprietary hardware + subscription) Large operations with hardware budget
    AI cultivation intelligence (Growgoyle) Yield, environment, photos, lab results, grower notes, batch history AI batch analysis after every run, photo-based plant health, batch comparison, daily AI guidance Low (photo upload + data entry, sensors via CSV/API) $499-999/mo Mid-market commercial grows (3-50 employees)

    The real question is not which method to pick. Most commercial operations end up using compliance tracking because they have to, and then need something else for actual cultivation improvement. The jump from spreadsheets to structured batch tracking is where the compounding starts: when you can compare Run 3 to Run 1 and see exactly what changed, every future batch gets smarter.

    See What AI Batch Analysis Looks Like

    Upload a photo of your canopy and get an AI plant health assessment in 60 seconds. Or see a full AI batch analysis from a real commercial run. Growgoyle doesn’t track your costs. It helps you lower them by making every batch better than the last.

    Analyze Your Plants Free
    See a Real Batch Analysis →

    Compliance Tracking vs. Performance Tracking in Cannabis

    Let’s be clear about what Metrc actually requires. Plant counts. Room assignments. Harvest weights. Chain of custody from seed to sale. It’s inventory management for regulators. Important? Yes. Useful for improving your cannabis cultivation? Not even a little.

    The compliance mindset says: “Tracking is something I do because I have to.” You fill in the required fields, you generate the reports, you pass your audit. Done.

    The performance mindset says: “Tracking is how I make every cannabis run better than the last.” You capture everything that matters to growing quality flower at lower cost. You review it after every harvest. You compare it across runs. The data becomes the engine for continuous improvement.

    Most cannabis operations live entirely in the compliance mindset. They have mountains of Metrc data and zero idea why Room 3 pulled 2.4 lb/light last run when Room 1 hit 3.1 with the same genetics.

    What a Performance Batch Record Actually Looks Like

    A real cannabis production record goes well beyond what compliance requires. Here’s the minimum viable batch record for a commercial flower operation:

    • Strain, clone date, flip date, chop date, dry weight (the basic timeline)
    • Lights and canopy square footage (so you can calculate real yield metrics)
    • Plant count (density matters more than most growers think)
    • Environment summary (any VPD swings, temperature deviations, humidity spikes?)
    • Nutrition changes (anything different from the last run?)
    • Pest and disease events (what happened, when, what you did about it)
    • Lab results (THC, terpenes, microbials, water activity)
    • Final yield metrics: lb/light, g/sqft, g/watt
    • Notes: what went well, what you’d change next time

    Anatomy of a complete cannabis performance batch record showing all data points from clone to cure
    A complete performance batch record captures far more than compliance requires.

    Most growers capture maybe 20% of this. The rest lives in their head. And it disappears the moment the next run starts and the day-to-day takes over. Three months later, when you’re trying to figure out why the same strain in the same room is yielding 15% less, the answer is gone. It walked out the door with the last run’s memory.

    What a Complete Batch Record Includes

    Pre-Run

    • Strain and genetics source
    • Clone/seed date
    • Target plant count
    • Room assignment
    • Light configuration
    • Growing medium

    Vegetative Phase

    • Transplant dates
    • Topping/training dates
    • Environment averages (temp, RH, VPD)
    • Feed recipe and EC targets
    • Photo documentation

    Flower Phase

    • Flip date
    • Stretch measurements
    • Weekly photo documentation
    • Environment data by week
    • Feed adjustments and EC/pH runoff
    • Defoliation dates and method
    • Pest/disease observations
    • Any interventions (foliar sprays, beneficial insects)

    Harvest

    • Wet weight
    • Dry weight
    • Yield per light (or per plant/sqft)
    • Trim weight
    • Waste weight
    • Hang dry conditions and duration

    Post-Harvest

    • Lab results (THC, terpenes, moisture)
    • Final yield calculations
    • Cost inputs for the run
    • AI analysis results
    • Comparison notes vs. previous runs

    The Power of Cannabis Batch Comparison

    One batch record is a snapshot. Two is a comparison. Five is a trend. This is where cannabis harvest tracking becomes genuinely powerful.

    Consider this: Run 3 hit 3.2 lb/light. Run 4 hit 2.8. What changed? If you don’t have detailed records for both runs, you’re guessing. If you do, the answer is usually sitting right there in the data.

    Here’s what batch comparison catches in real cannabis operations:

    • Gradual yield decline across runs: HLVd progressing in your mother stock. The data shows the downward trend before the visual symptoms get obvious.
    • Inconsistent THC from the same genetics: Environment drift during weeks 5 through 7 of flower. The batch records show where VPD or temperature wandered off target.
    • One room that always underperforms: Light uniformity problem. Comparing room-over-room data makes it obvious.
    • Great yield but poor quality scores: Nutrient push in late flower was too aggressive. The records show what changed in the feed schedule.

    Cannabis yield trend over 8 runs with annotations showing what batch comparison identified
    Eight runs of data reveals patterns that a single harvest never could.

    The growers who figure this out are the ones who wrote things down. The patterns were there for everyone. The records are what made them visible. Without cannabis run tracking that captures the right data points, every post-harvest review is just a conversation based on memory and gut feel.

    Why Spreadsheets Break Down

    Let’s give spreadsheets their due. Excel or Google Sheets is a perfectly fine cannabis grow journal for your first few batches. You set up some columns, you fill them in after harvest, you scroll back to compare. It works.

    It breaks when reality scales up. Multiple rooms running simultaneously with staggered flip dates. Team members entering data in different formats (did they use grams or pounds? wet or dry?). You want to compare across 10+ runs and the spreadsheet is 40 columns wide. Photos and lab result PDFs don’t fit in cells. Somebody accidentally deletes a row.

    But the real cost isn’t that spreadsheets are technically bad. It’s that the friction means you stop doing it. One busy week during harvest, the batch record doesn’t get filled in. Then the next one slips too. Then you’re back to running on memory, and your yield consistency suffers because the system for improvement quietly disappeared.

    This is a human behavior problem, not a technology problem. The habit of tracking has to be easier than not doing it. If entering a batch record takes 30 minutes of copying data between systems, it won’t survive contact with a busy harvest week. Period.

    What AI Does to Cannabis Batch Tracking

    The traditional flow looks like this: track data, stare at the data, try to find patterns yourself, maybe make a change next run. The analysis step is entirely manual. You’re the one who has to notice that weeks 5 through 7 were 2 degrees warmer than your best run, and that correlates with the THC drop. Most growers don’t have time for that level of review.

    AI changes the equation by making the analysis automatic. You still track the data (yields, environment, photos, lab results, notes). But instead of manually hunting for patterns, the AI reads everything and tells you specifically what to change and why.

    Cannabis batch tracking evolution from notebook to spreadsheet to dedicated software to AI-powered analysis
    The evolution of cannabis batch tracking: each step reduces friction and adds intelligence.

    Here’s what that looks like in practice with a system like Growgoyle:

    Photo-based plant health assessment: Snap canopy photos from your phone at any point during the run. The AI delivers a master grower-level assessment in 60 seconds: specific targets, priority actions, and differential diagnosis that considers multiple possible causes (not just the obvious one). Those observations become part of the batch record automatically.

    Post-run AI batch analysis: After every harvest, the AI reads the full batch record (environment data, photos, lab results, yield metrics, your notes) and delivers a complete breakdown. What worked. What to improve. Three specific improvement opportunities with estimated pound impact. Every run scored against your own history, not some generic industry benchmark. That’s AI batch analysis in action.

    Batch comparison: Compare any two runs side by side. The AI identifies what changed between a great run and a mediocre one. “Here’s what made that 3.2 lb/light run different from the 2.8.” Your best practices get documented automatically instead of living in one person’s head.

    This isn’t about replacing grower judgment. It’s about making the analysis step automatic so you can focus on execution. The AI handles the tedious part (reading through 50 data points across 8 runs to find the signal). You handle the growing.

    Starting the Cannabis Batch Tracking Habit

    If you’re doing nothing right now: Start with a Google Sheet. Strain, dates, yield, notes. Four columns. It’s better than nothing by a wide margin. The goal is to build the habit of recording something after every harvest.

    If you’re already using spreadsheets: You’ve proven the habit exists. That’s the hard part. Now the question is whether you’re actually reviewing the data and getting value from it. If your spreadsheet is 20 runs deep and you haven’t compared the last 5 side by side, the tracking is happening but the improvement loop isn’t. Time to move to a system that does the analysis for you.

    If you’re looking for dedicated cannabis grow journal software: Evaluate based on what matters. Does it make data entry fast enough that you’ll actually do it during a busy week? Does it handle photos and lab results, not just numbers? And most importantly, does it do something with the data beyond storing it? Storage is easy. Analysis is where the value lives.

    The cannabis growers whose cost per pound drops consistently aren’t doing anything magical. They’re tracking what happened, reviewing what the data shows, and making specific changes based on evidence instead of memory. The tools just determine how much friction sits between “something happened” and “here’s what to do differently.”

    Frequently Asked Questions: Cannabis Batch Tracking

    Q: What is the difference between compliance batch tracking and cultivation batch tracking?

    Compliance batch tracking (like METRC) exists to satisfy state regulatory requirements. It tracks plant counts, transfers, and harvest weights for government auditing. Cultivation batch tracking is about growing better. It captures environment data, photos, feeding details, and yield outcomes so you can analyze what worked and what did not. Compliance tells the state where your plants are. Cultivation tracking tells you how to produce more of them. You need both, but they solve fundamentally different problems.

    Q: Can spreadsheets work for cannabis batch tracking?

    For one or two rooms, yes, spreadsheets can work. The problem starts when you are tracking 4 or more zones across multiple batches with different strains, different flip dates, and overlapping schedules. Spreadsheet batch tracking breaks down at scale because there is no easy way to compare across batches, no photo documentation integration, and no analysis of what drove the differences. Most operations that grow beyond 2 rooms eventually hit the spreadsheet wall and start losing institutional knowledge.

    Q: What data should a cannabis batch record include?

    A complete batch record captures six categories: genetics (strain, source, clone/seed date), environment (daily temp, humidity, VPD, light intensity, CO2 levels), nutrition (feed recipes, EC targets, pH, runoff data), cultivation practices (topping, defoliation, training dates), harvest metrics (wet weight, dry weight, yield per light, trim ratio), and post-harvest data (lab results, dry room conditions, final quality grade). The more data you capture during the run, the more useful your post-run analysis becomes.

    Q: How does AI cannabis batch analysis work?

    AI batch analysis takes all the data from a completed run (environment averages, photos, yield data, grower notes, lab results) and compares it against your previous batches and known cultivation benchmarks. It identifies three things: what went well, what could improve, and the estimated pound impact of each improvement. It is not guessing. It is pattern-matching across your actual facility data over time. After 3 to 5 batches, the analysis gets sharper because it has more of your history to compare against.

    Q: Do I still need batch tracking if I already use METRC?

    Yes. METRC tracks what the state requires: plant counts, weights, transfers, and test results. It does not track your environment data, feeding schedules, cultivation techniques, or photos. And it has no analysis capability. METRC tells you what happened (X pounds harvested). Cultivation batch tracking tells you why it happened and how to get more next time. The two systems are complementary, not overlapping.


    Right now, your batch data lives on a whiteboard, in a spreadsheet you haven’t updated since last harvest, or in your head. That works until it doesn’t. Every day you’re not logging what’s happening in your rooms is a day of data gone forever. You can’t go back and reconstruct what week 4 looked like when you’re standing in the dry room wondering why this run came up short.

    Growgoyle doesn’t track your costs. It tracks your batches, analyzes your runs, and tells you exactly what to change to pull more weight. Got a room in flower right now? That’s all you need. Upload a few canopy photos and see what the AI catches in 60 seconds. Try it free on your own plants.

    About the Author

    Eric is a 15-year software engineer who operates a commercial cannabis cultivation facility in Michigan. He built Growgoyle to solve the problems he faces every day: inconsistent yields, forgotten lessons from past runs, and the constant pressure to lower cost per pound. Every feature in Growgoyle comes from real growing experience, not a product roadmap.

  • Cannabis Cultivation Software in 2026: Compliance Tools vs. Cultivation Intelligence

    Cannabis Cultivation Software in 2026: Compliance Tools vs. Cultivation Intelligence

    If you search “cannabis cultivation software,” every result is a compliance tool pretending to be a grow management platform. That’s not an exaggeration. Go look. You’ll find seed-to-sale tracking, RFID inventory management, and Metrc integrations dressed up as “cultivation management.” None of it will improve your yields by a single gram.

    Here’s the reality: there are three distinct categories of cannabis software. They do completely different things. Most growers only know about one of them, own two at most, and are missing the one that actually connects data to outcomes. The category that helps you optimize cannabis yield isn’t the one the state requires you to buy.

    Let me map out what each category actually does, what it doesn’t do, and where the real opportunity lives for commercial cannabis growers who want to stop guessing and start improving.

    Cannabis Cultivation Software at a Glance

    Software Category Best For AI Capabilities Sensor Integration Approx. Price
    METRC / BioTrack Compliance (state-mandated) Required seed-to-sale tracking None None Varies by state
    Canix Compliance + Operations Seed-to-sale with RFID inventory None None $$ (contact for pricing)
    Flourish Compliance + Distribution Multi-state compliance and distribution None None $$ (contact for pricing)
    Dutchie POS + Compliance Retail-focused with compliance layer None None $$ (contact for pricing)
    Trym Cultivation Management Task and workflow tracking for grows None None $ (free tier available)
    AROYA Sensor Hardware + AI Large operations with hardware budget Equipment control and irrigation automation Proprietary hardware required $$$$ (demo required)
    GrowerIQ Sensor + Compliance Hardware-integrated compliance grows Limited (environment monitoring) Proprietary sensors $$$ (contact for pricing)
    Growgoyle AI Cultivation Intelligence Mid-market commercial growers (3-50 employees) Full cultivation AI: batch analysis, photo assessment, daily guidance, batch comparison Any sensor system (CSV or API) $499-999/mo

    See AI Cultivation Intelligence in Action

    Upload a photo of your canopy and get an AI analysis in 60 seconds. Free, no signup, no hardware required. Growgoyle doesn’t track your costs. It helps you lower them.

    Analyze Your Plants Free
    Start Free Trial →

    The Three Categories of Cannabis Cultivation Software

    Looking for specific products? See our honest review of the best cannabis cultivation software in 2026 with real product comparisons.

    Category 1: Seed-to-Sale and Compliance Software

    This is the software the state requires you to use (or integrate with). Metrc, BioTrack, Canix, Flowhub, GrowFlow. It tracks plant counts, package weights, transfers, and destruction events. It files your reports. It keeps you legal.

    What it does: compliance reporting, inventory tracking, chain of custody documentation. It tells the state what you grew, when you harvested it, and where it went.

    What it doesn’t do: tell you anything about your cultivation quality, your environment, your yield trends, or what to change next run. Not a single byte of data in your compliance system will help you figure out why Room 2 pulled 20% less than Room 3 last cycle.

    You need a compliance tool. Full stop. If you’re operating legally in a regulated market, this is table stakes. But calling it “cannabis cultivation management” is like calling your tax software a “business strategy platform.” It records what happened for regulators. It tells you nothing about why it happened or how to get better.

    The real problem is that many cannabis growers stop here. They see “cultivation management” on the box, they assume the software is helping them grow better, and they wonder why their yields haven’t improved in three cycles. If you want to go deeper on what compliance tools miss, read what lies beyond Metrc compliance software.

    Category 2: Sensor Monitoring and Environment Control

    This is the dashboard layer. AROYA, Trolmaster, Pulse, Growlink. These systems read temperature, humidity, VPD, substrate moisture, CO2, and light intensity. Some of them control equipment directly (automated irrigation, HVAC triggers). They show you what’s happening in your cannabis grow rooms right now.

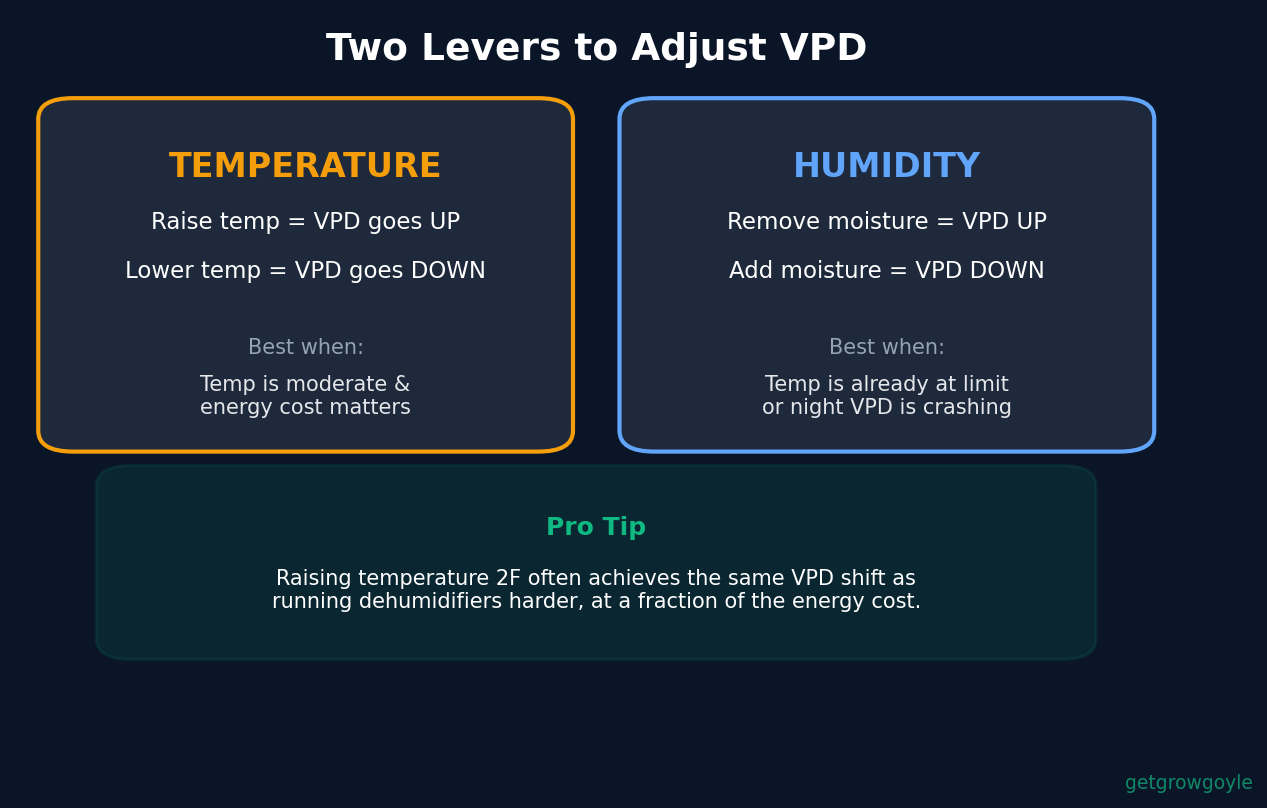
    What they do: real-time environmental monitoring, alerting when parameters drift out of range, and (in some cases) automated equipment control. If your VPD spikes at 2AM, you get a notification. If substrate EC climbs past your threshold, the system can trigger a feed event.

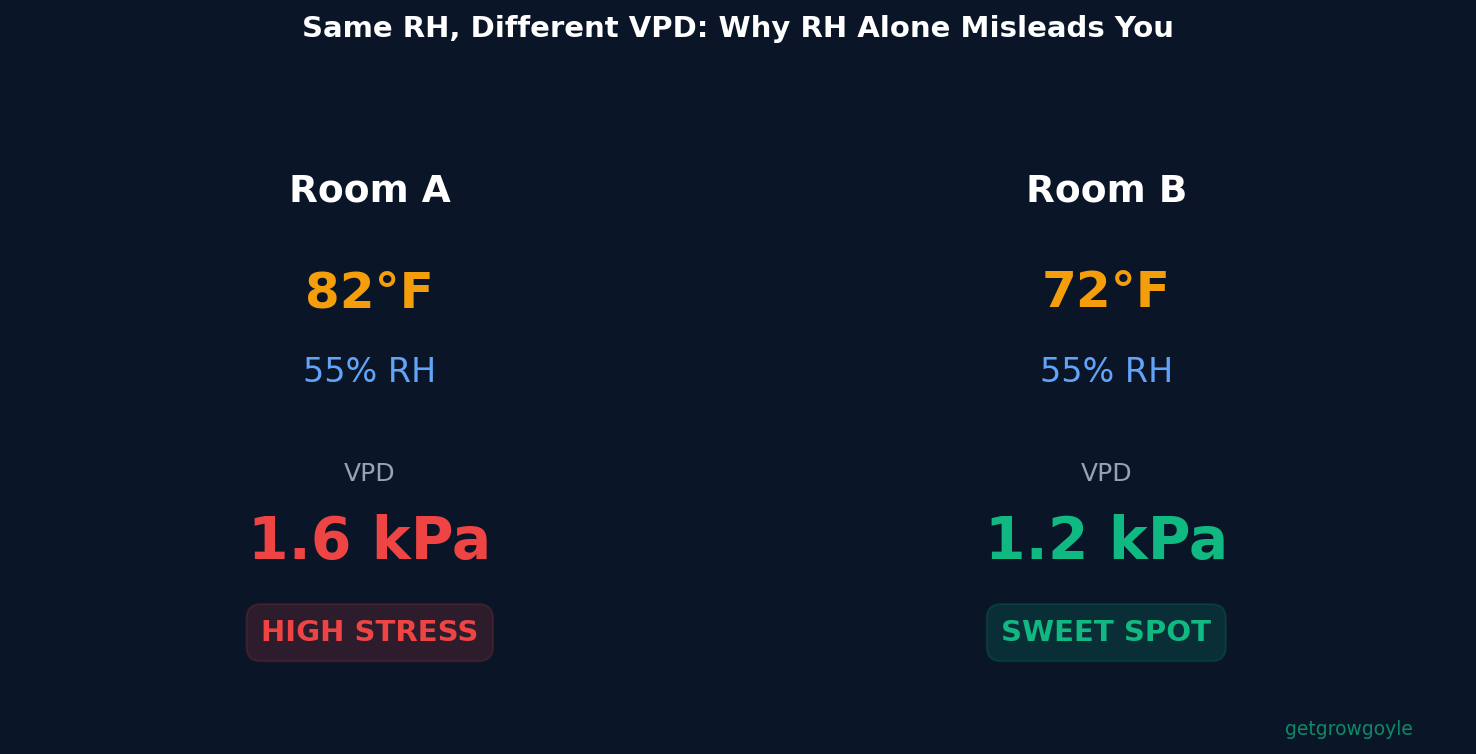
    What they don’t do: connect environment data to outcomes. Knowing your VPD held at 1.2 during Week 5 doesn’t tell you why your last run yielded 15% less than the one before. A sensor dashboard shows you the present tense. It doesn’t analyze the past or guide the future. The difference between a sensor dashboard and real cultivation intelligence is the difference between collecting data and actually using it.

    Here’s the trap with sensor dashboards: beautiful charts create the illusion of control. You see real-time graphs, color-coded zones, historical trends. It feels like you’re managing your cannabis cultivation. But data display is not data analysis. A thermometer tells you the patient’s temperature. It doesn’t diagnose the disease.

    I’ve talked to operators who spend $2,000 a month on sensor monitoring and still can’t answer the most basic question after harvest: what was different about this run compared to the last one? They have terabytes of environment data and zero framework for connecting it to outcomes. The sensor system did its job perfectly. It just wasn’t designed to do what the grower actually needs.

    A note on AROYA specifically. They’re the biggest name in this space. VC-funded, hardware-dependent (their sensors required), enterprise-priced. All three of their patents are sensor hardware, not software. Their AI focuses primarily on equipment control and real-time irrigation automation. They do not collect harvest metrics, lab results, canopy photos, or grower notes. If you’re a large operation with the budget for a full proprietary hardware stack, AROYA is a legitimate option. If you’re a mid-market cannabis grower running 2,000 to 20,000 square feet, you’re probably not their target customer, and their price point reflects that.

    Category 3: Cultivation Intelligence

    This is the layer that barely exists in the cannabis software market. Cultivation intelligence connects everything: environment data, yield numbers, quality metrics, lab results, canopy photos, grower observations, drying conditions. It tracks every batch from clone to cure, compares runs against each other, and surfaces specifically what changed between a great harvest and a mediocre one.

    What it does: batch-level analysis across the full lifecycle, automated run-to-run comparison, AI-driven improvement recommendations built on your own data, photo assessment that catches issues early, and outcome tracking across every dimension that matters (yield, quality, environment, drying, efficiency).

    What it doesn’t do: control your equipment or file your compliance reports. It sits on top of both layers and turns their raw data into answers.

    Most cannabis growers are filling this gap with spreadsheets, notebooks, and memory. That works until it doesn’t. Until the lead cultivator leaves and takes all that institutional knowledge with them. Until you can’t remember what you did differently in Room 3 six months ago when you hit your best numbers. Until the same pattern costs you yield for the fourth run in a row because nobody connected the environment data to the harvest data in a way that’s actually searchable.

    This is the gap that keeps cannabis operations stuck. The data exists. The environment system collected it. The compliance system logged the weights. The grower has observations in a notebook somewhere. But nothing connects those data points into a coherent picture that says: here’s what worked, here’s what changed, and here’s what to focus on next time.

    Growgoyle is purpose-built for this category. It’s AI-native cannabis cultivation management: the scheduling, task tracking, batch journaling, photo assessment, environment monitoring, and post-harvest analysis all feed a single AI system that learns from your operation over time. Not from generic data. From your grows, your facility, your genetics.

    Three categories of cannabis cultivation software: compliance, sensor monitoring, and cultivation intelligence
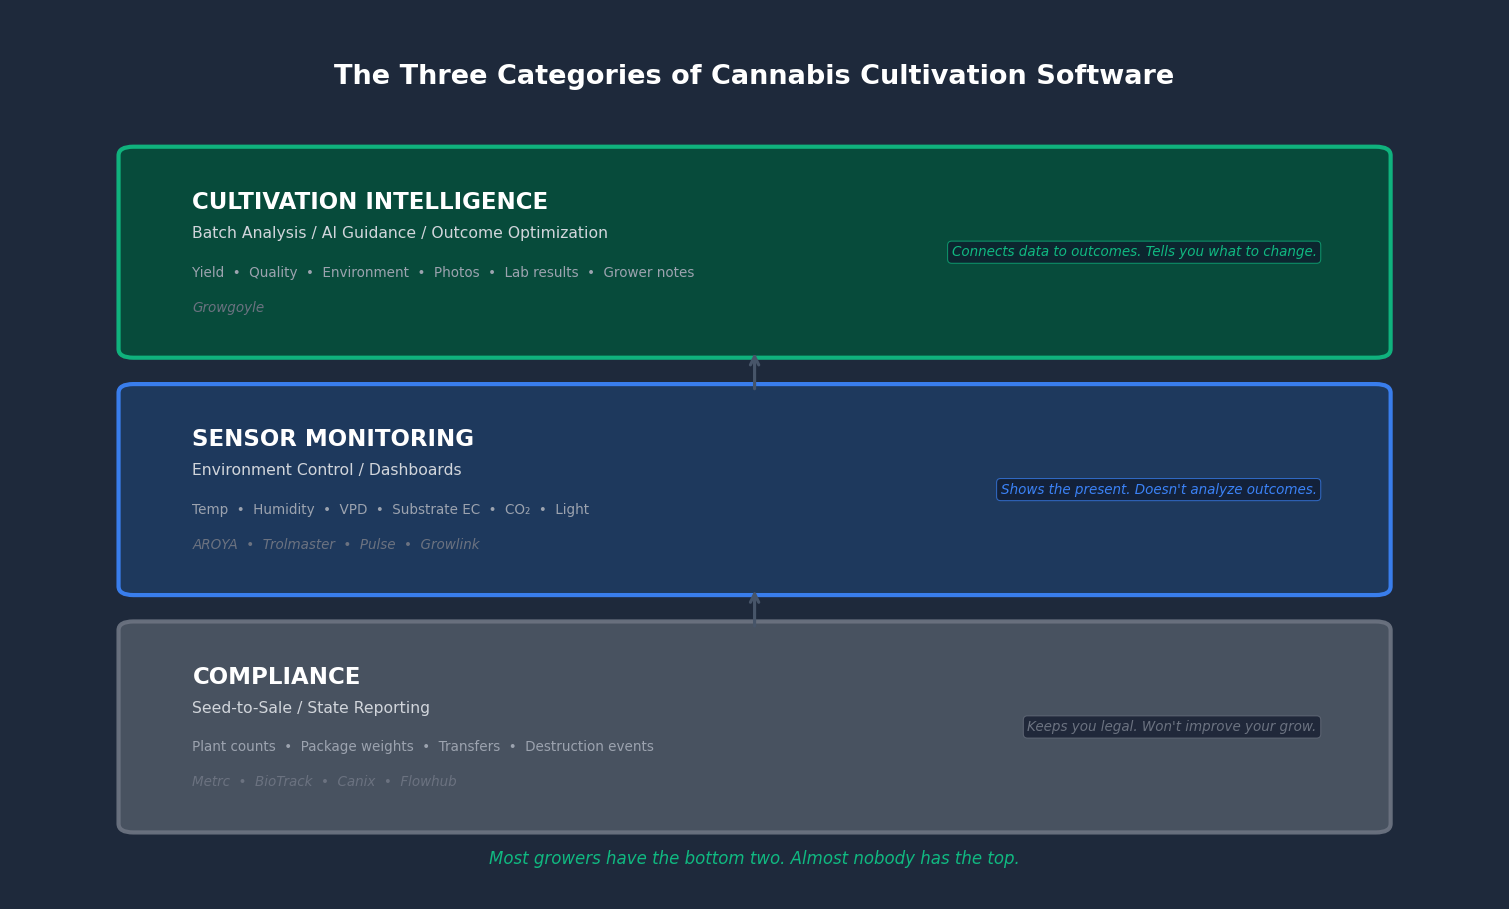
    The three layers of cannabis software. Most growers have the bottom two. Almost nobody has the top.

    Why the Categories Matter for Cannabis Growers

    Most cannabis operations buy compliance software and think they’re managing their cultivation. Some add sensor monitoring and think they’ve covered the technology side. But the layer that actually improves outcomes (cultivation intelligence) is the one almost nobody has.

    Think about it this way. Compliance software tells the state what you grew. Sensor software tells you what’s happening in the room. Neither one tells you what to do differently next run. Neither one remembers what your best batches had in common. Neither one identifies that your drying conditions in October consistently outperform your drying conditions in July, or that your yield drops every time you flip a room within 48 hours of a nutrient change.

    The missing layer is something that remembers what you did, compares it to what happened, and surfaces the specific changes that would improve your next harvest. Not generic advice from a forum post. Not “keep your VPD in range.” Specific, data-backed observations from your own grow history, scored against your own best performance.

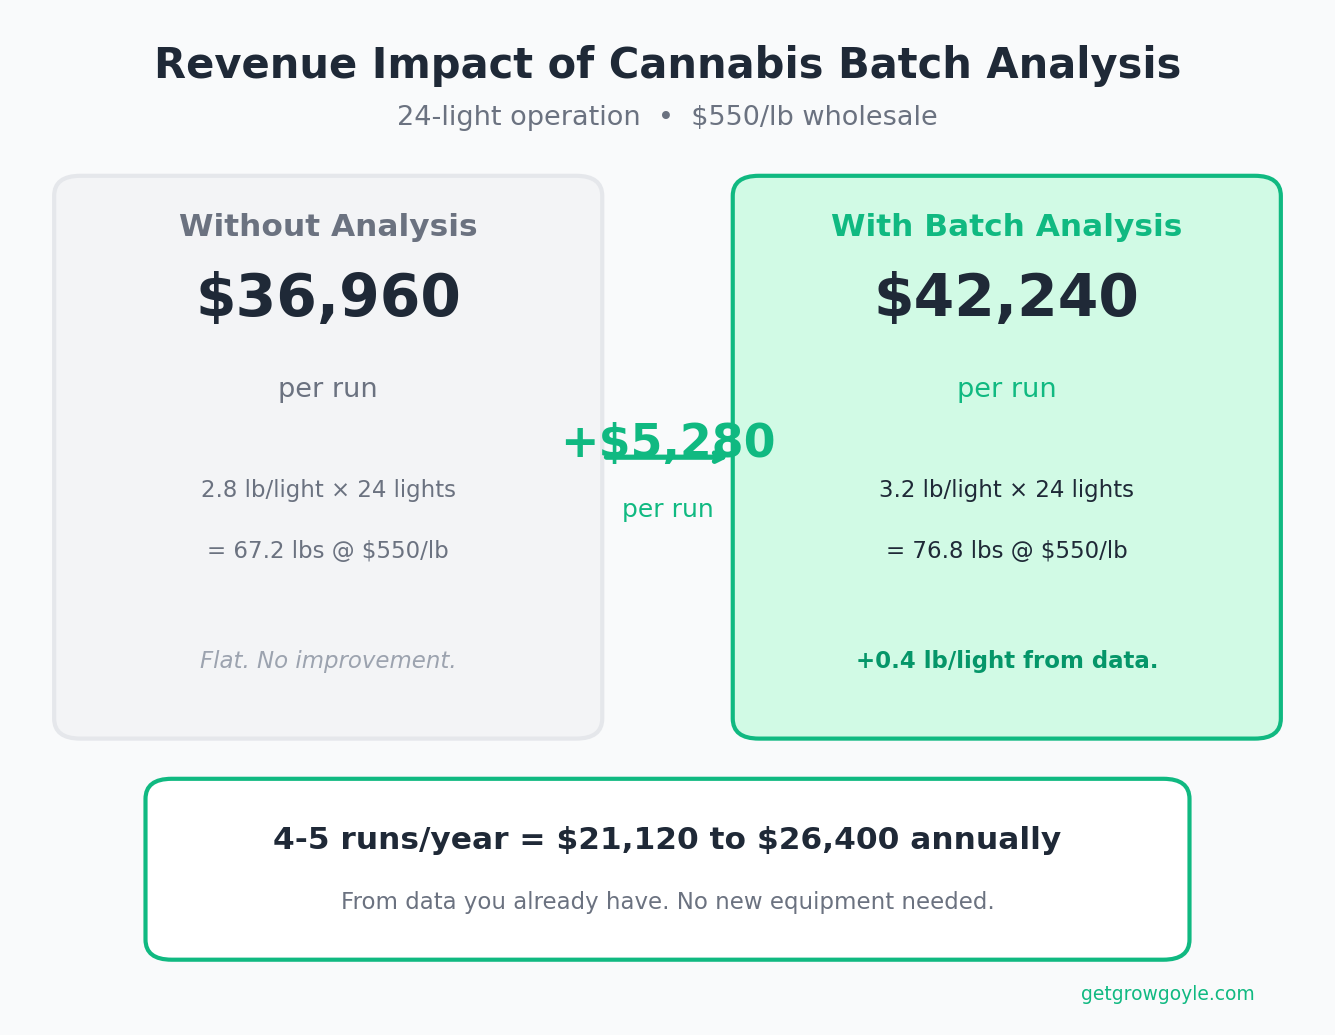
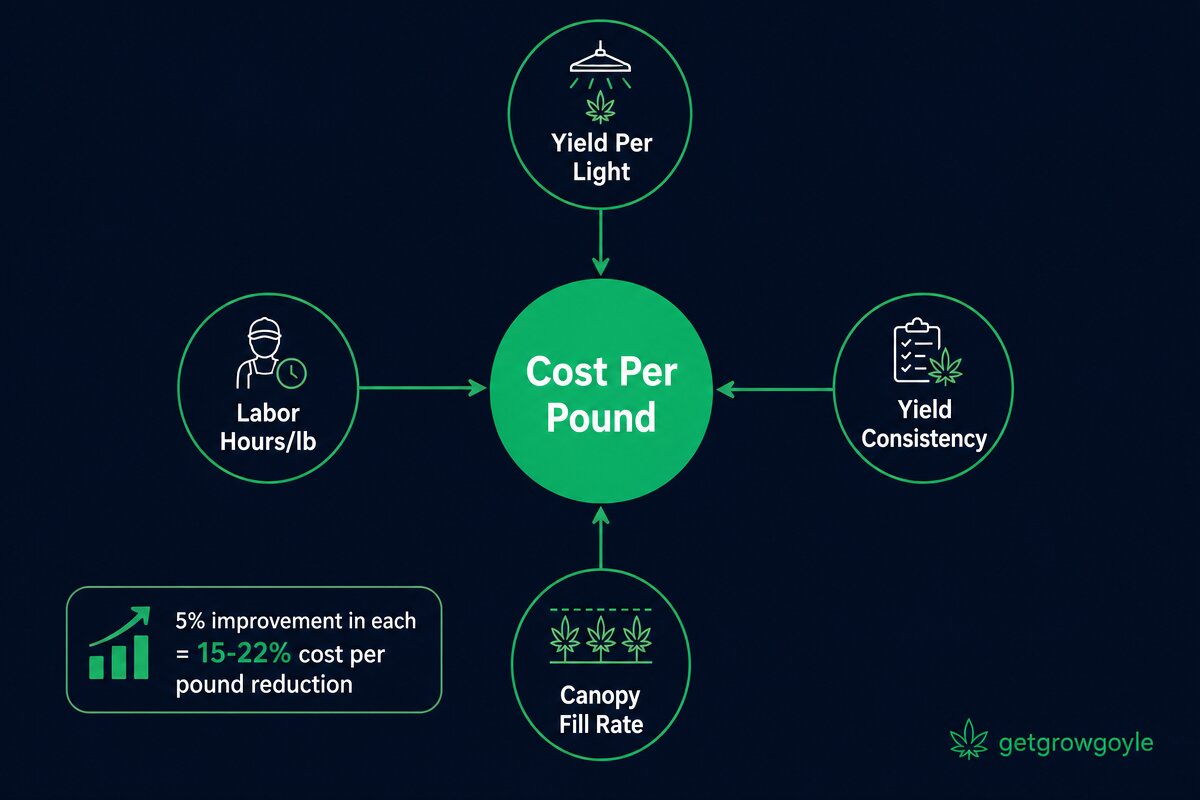
    When you’re working to lower your cannabis cost per pound (and in a wholesale market estimated at $500-600, every operator is), the opportunity isn’t in cheaper compliance software or fancier sensor dashboards. It’s in the intelligence layer that turns all that raw data into better decisions, run after run.

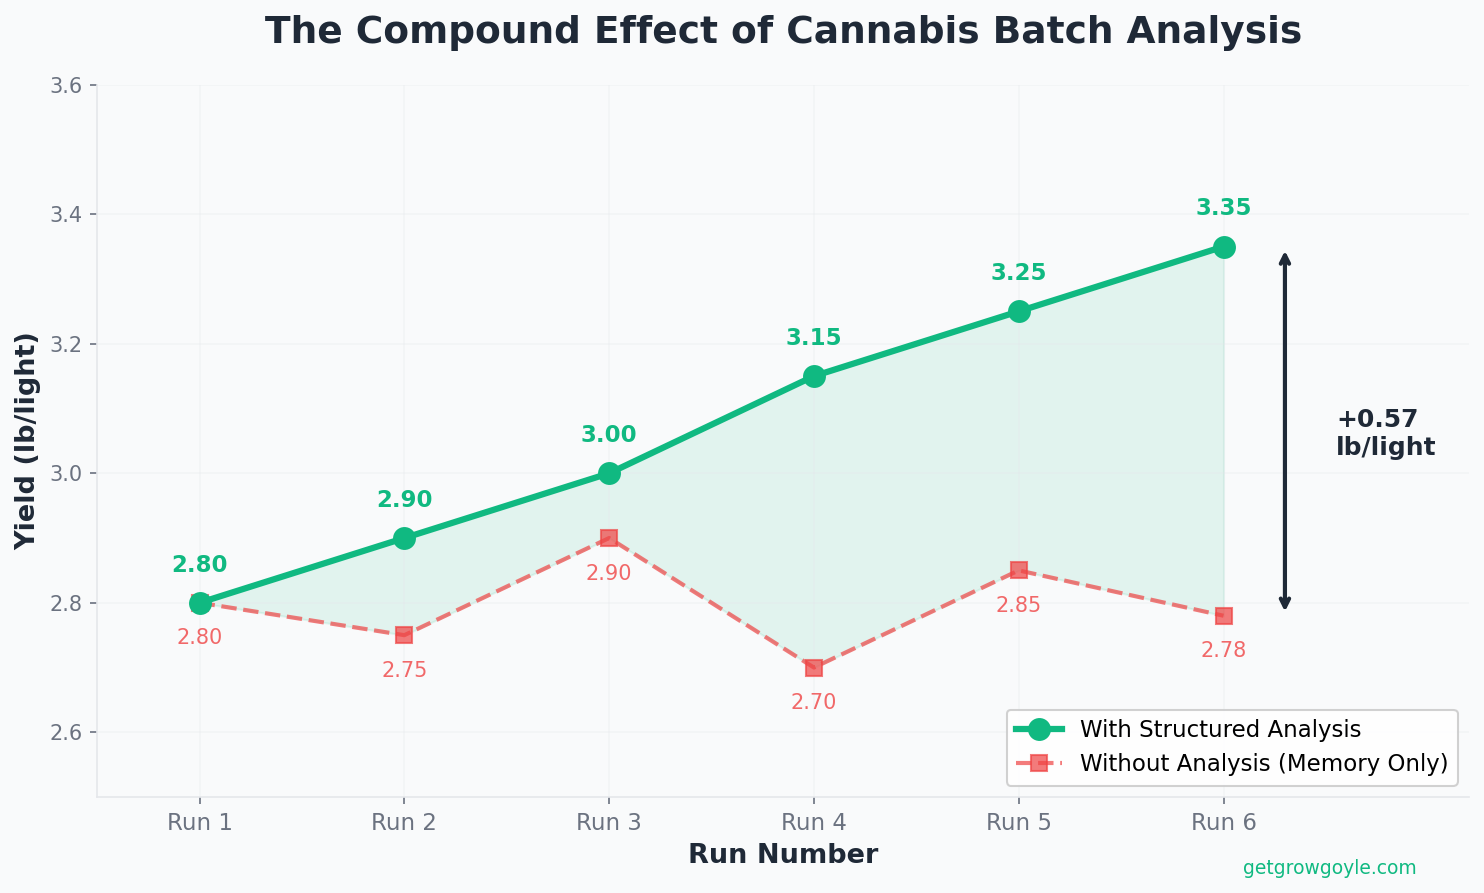
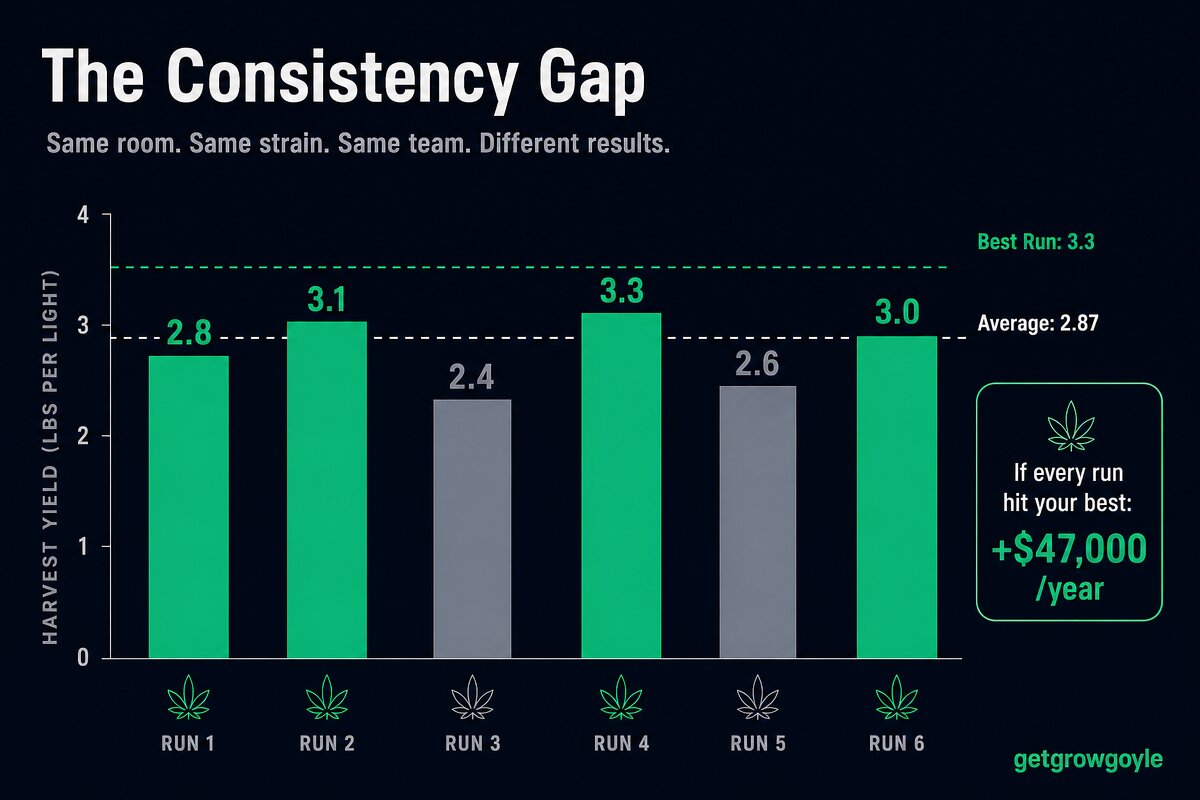
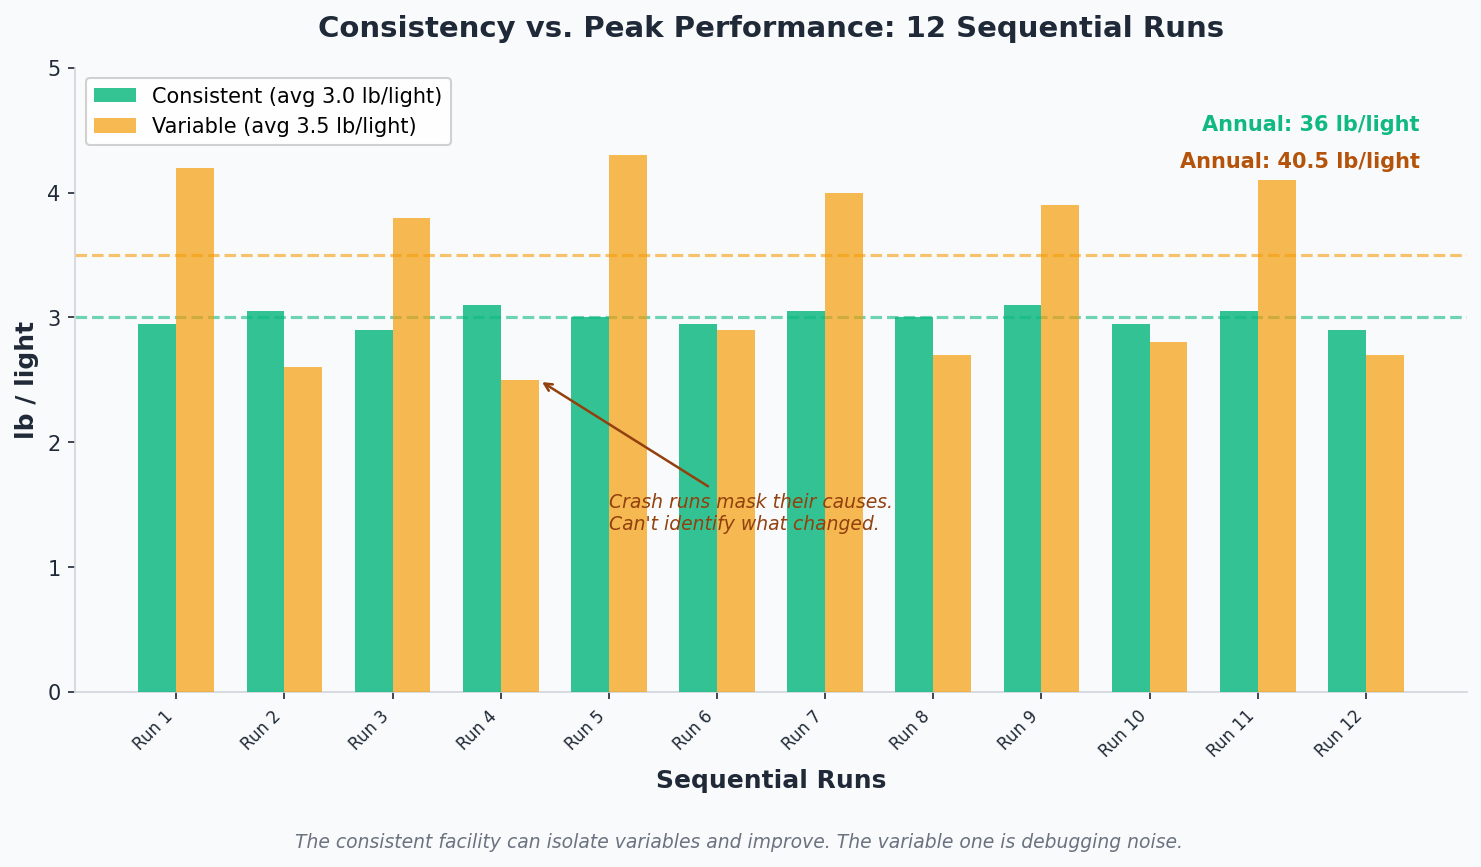
    Here’s the math that makes this concrete. If your cannabis operation runs 8 harvests per year and your yield varies by even 10% between your best and worst runs, that variance is costing you real money. Not because you’re doing anything wrong, but because the data that would explain the difference isn’t being captured, compared, or analyzed in any systematic way. The compliance system doesn’t see it. The sensor system sees part of it. Only a cultivation intelligence platform connects all the dots.

    Data inputs for each category of cannabis cultivation software showing the cultivation intelligence gap
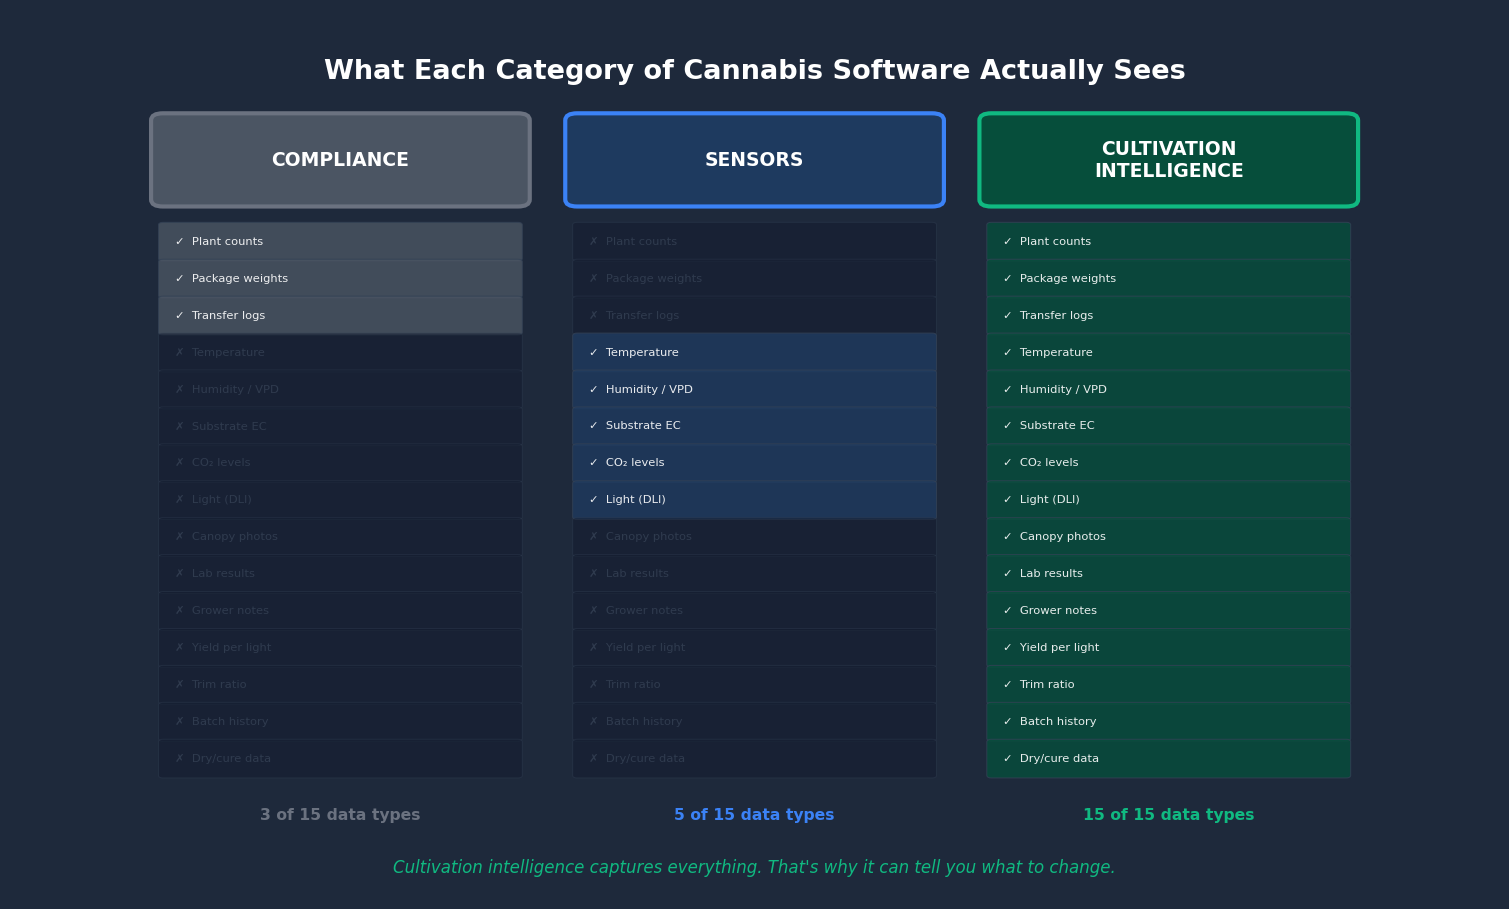
    Compliance tools see plant counts. Sensors see environment. Cultivation intelligence sees everything, and connects it to outcomes.

    What to Look For in Cannabis Grow Management Software

    If you’re evaluating cannabis cultivation software in 2026, the compliance and sensor categories are relatively straightforward. Your state tells you which compliance system to use. Your budget and facility size narrow the sensor options. The real question is what to look for in the intelligence layer, because that’s where the selection actually matters.

    Here’s the checklist:

    Does it track batch-level data across the full lifecycle? Clone to cure. Not just flower. Not just what’s in the room right now. The full history of every batch: environment conditions, nutrition, training decisions, harvest weight, trim ratio, lab results, dry weight, cure parameters. If the system only captures a slice of the lifecycle, the analysis will always be incomplete.

    Does it compare runs automatically? You shouldn’t have to build a spreadsheet to figure out what changed between Run 12 and Run 14. Batch comparison should be built in, not something you piece together manually on a Sunday afternoon. When you can instantly see what your best runs had in common, the path to consistency gets a lot shorter.

    Does it tell you specifically what to change? Charts are not recommendations. A good cannabis cultivation intelligence platform doesn’t just show you that yield dropped. It identifies what was different about the environment, the timing, the process. It gives you three concrete opportunities for improvement, not a wall of data and a “good luck.”

    Does it learn from YOUR data? Generic growing advice is everywhere. What you actually need is analysis based on your genetics, your facility, your process. The system should score you against your own best runs, not industry averages that may have nothing to do with your setup. Every grower’s operation is different. The intelligence layer should reflect that.

    Does it work with the sensors you already have? If the platform requires proprietary hardware to function, you’re not buying software. You’re buying into a hardware ecosystem with all the vendor lock-in that implies. Your cannabis grow management software should ingest data from whatever sensor system you’re already running. No rip and replace.

    Can you actually try it before committing? If it requires a $10K setup, a 60-minute demo with a sales team, and a 12-month contract before you see value, that tells you something about who their customer is. Mid-market cannabis growers need something they can evaluate on their own terms, with their own data, before writing a check.

    The Integration Question

    Your cannabis operation probably runs three or four software systems already. Maybe more. The question isn’t whether to add another tool. The question is whether the tools you have actually talk to each other and, more importantly, whether any of them connect inputs to outcomes.

    Here’s what a functional cannabis cultivation software stack looks like:

    Your compliance tool handles Metrc (or whatever your state mandates). It tracks what the regulators need. It should export data cleanly, though most don’t make that easy.

    Your sensor system monitors environment parameters across your zones. It should export historical data (CSV at minimum, API ideally). This data is the raw material for understanding what happened during each run.

    Your cultivation intelligence layer sits on top of both. It ingests environment data, batch records, canopy photos, lab results, and grower notes. It connects inputs to outcomes. It doesn’t require you to rip out your existing sensors or switch compliance platforms to get value.

    The vendor lock-in risk in cannabis software is real. AROYA requires their proprietary sensors. Most compliance tools don’t export data in a useful format. Some sensor platforms make it deliberately difficult to get your own data out. When you’re evaluating any new cannabis cultivation software, ask one question first: does this work with what I already own, or does it require me to replace my infrastructure?

    Growgoyle is built to work with any sensor system. You keep your existing hardware. The platform ingests your environment data, combines it with everything else (batch logs, photos, lab results, grower observations), and delivers the analysis layer that was missing.

    The practical test is simple: can you get value from the platform without replacing anything you already own? If the answer is no, you’re looking at a hardware sale disguised as a software platform. If you’re looking for practical ways to reduce your cultivation costs, it starts with getting more intelligence out of the data you’re already collecting. Not buying more sensors.

    Where Cannabis Cultivation Software Is Going

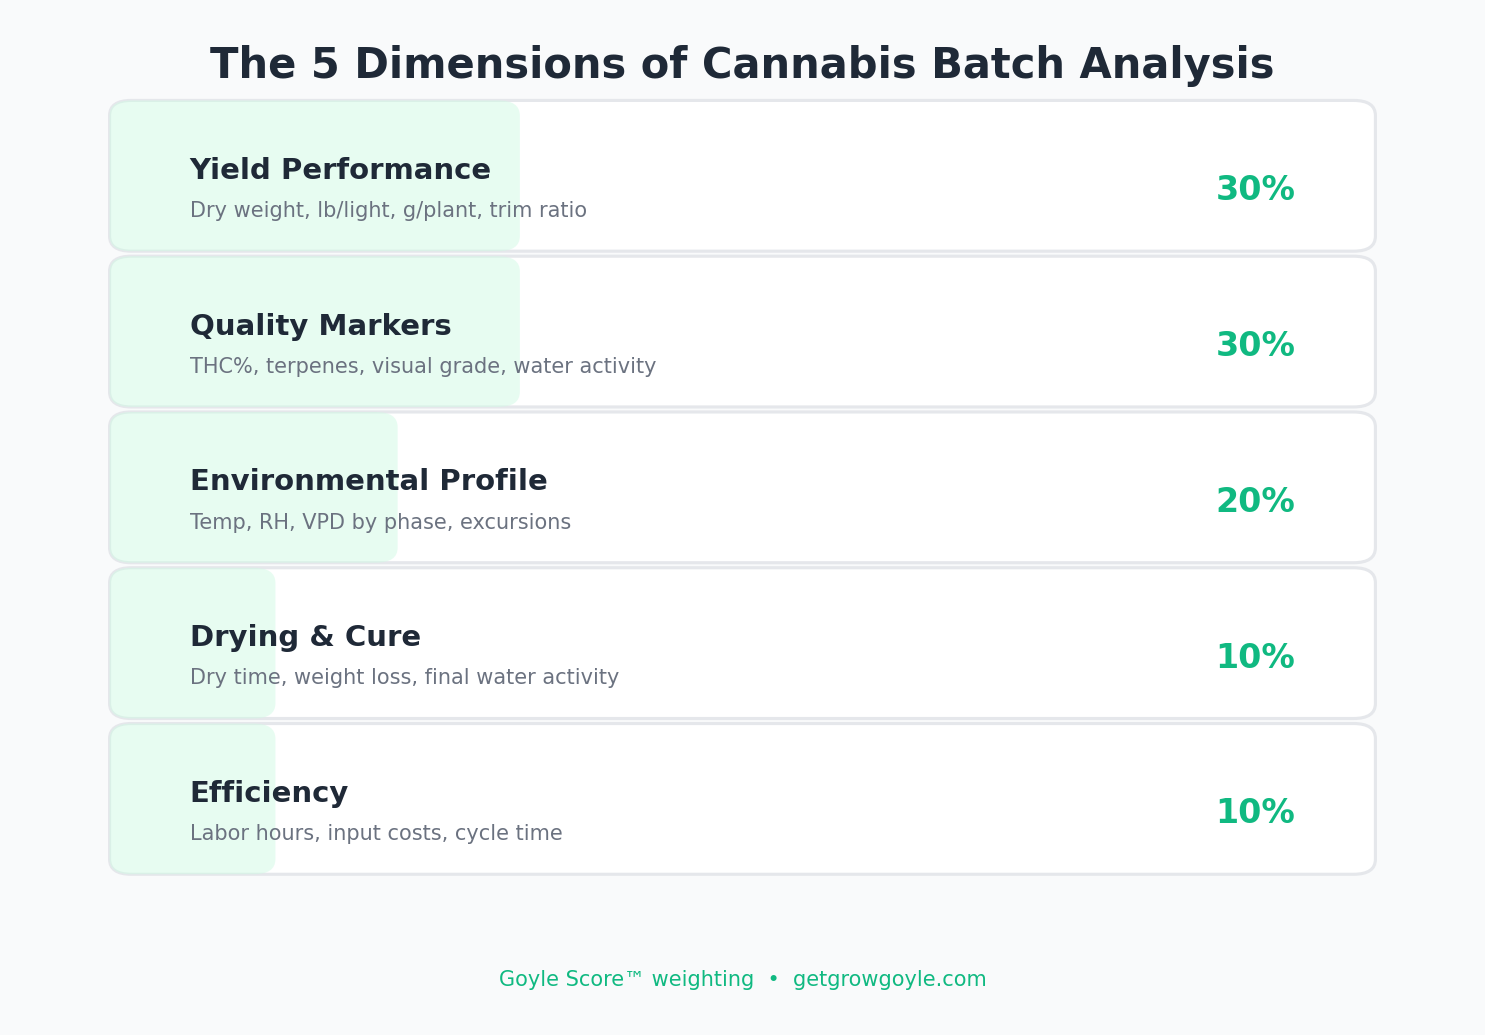
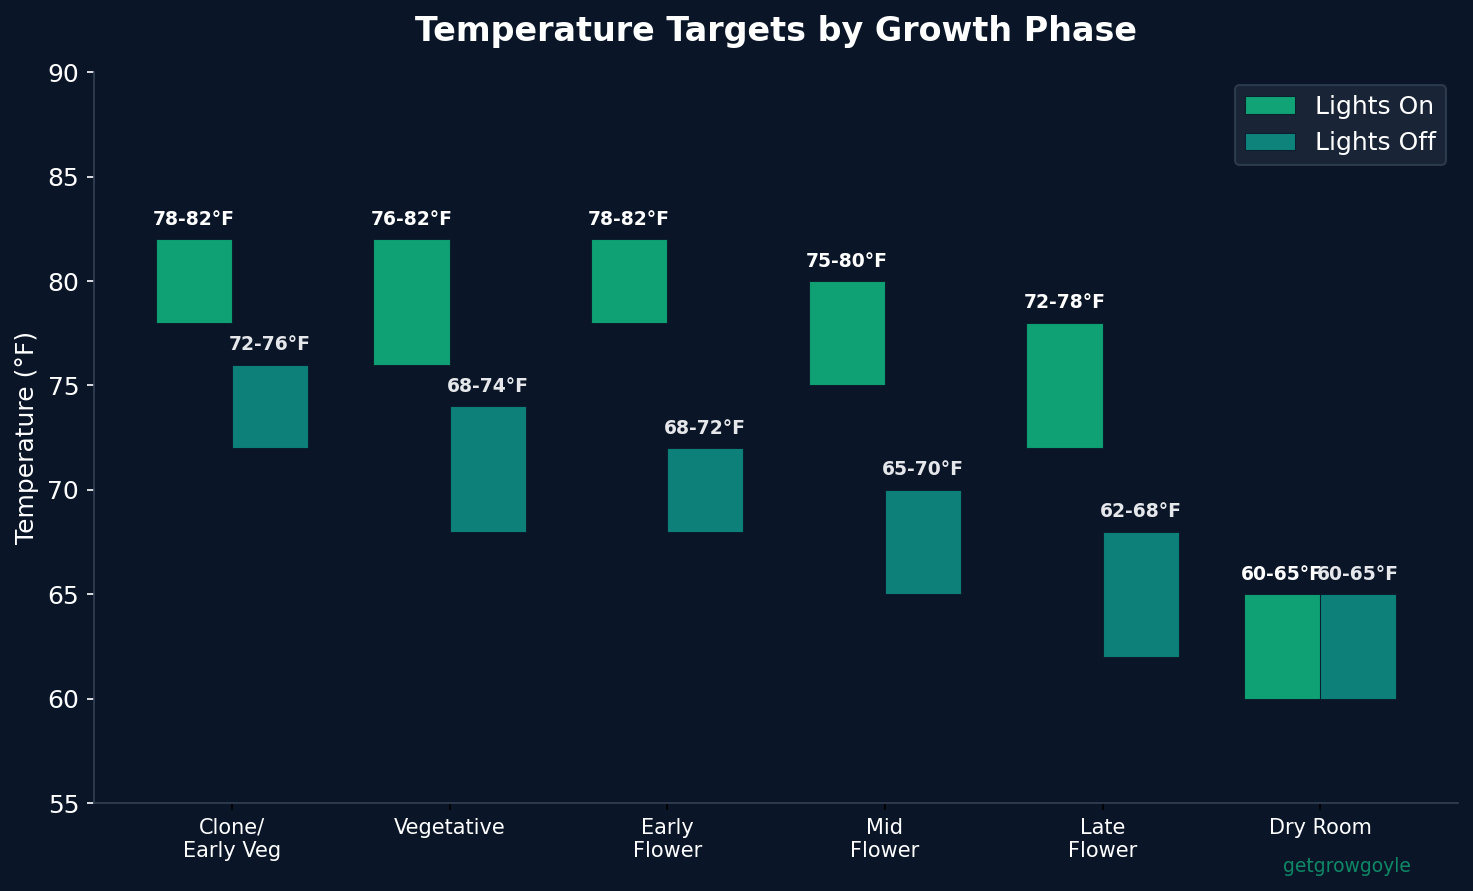
    AI is making the cultivation intelligence layer dramatically more capable in 2026. Photo analysis that delivers a master grower-level assessment of your canopy in 60 seconds. Lab result interpretation that ties cannabinoid and terpene profiles back to specific environmental conditions. Automated post-harvest analysis that breaks down every completed batch across five dimensions: yield, quality, environment, drying, and efficiency.

    But here’s what’s happening competitively, and it matters for every cannabis grower making software decisions right now.

    The compliance companies are trying to bolt on “analytics.” It’s an afterthought. They started as state reporting tools and they’re adding dashboards that show aggregated numbers with no context. There’s no batch-level AI, no run comparison, no personalized recommendations. The analytics look good in a demo. They don’t change outcomes in the grow room.

    The sensor companies are trying to bolt on “AI.” But their AI is equipment control: automated irrigation triggers, real-time environment adjustments. That’s valuable for automation, and it’s genuinely useful infrastructure. But it’s not cultivation intelligence. It doesn’t tell you why Run 15 outperformed Run 14. It doesn’t remember what your best batches had in common. It doesn’t break down your post-harvest data and say, “here are three things that would improve your next cycle.”

    The future of cannabis cultivation software is purpose-built intelligence that integrates with whatever compliance and sensor stack you’re already running. Not a sensor company that added a software layer. Not a compliance tool that added charts. A system designed from the ground up to make your next run better than your last one, using your own data as the foundation.

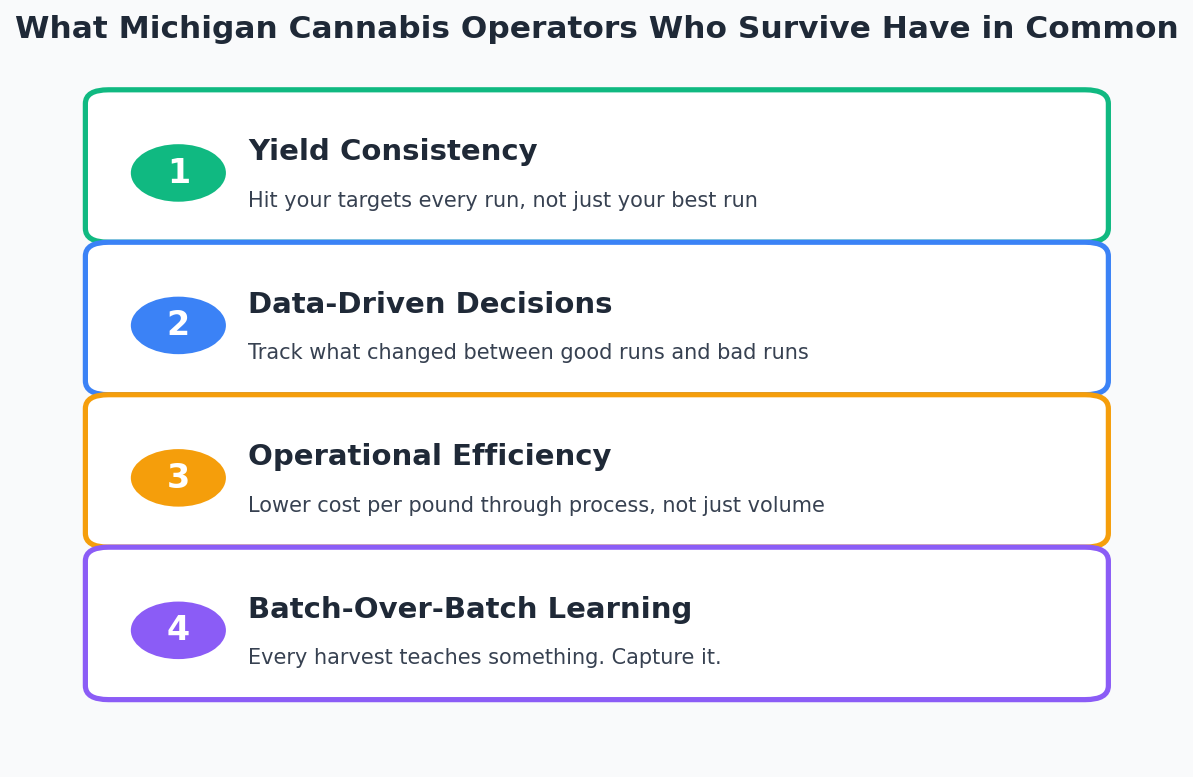
    The operators who survive the next two years of margin compression won’t be the ones with the most sensors or the fanciest compliance dashboards. They’ll be the ones who systematized learning: who built a process where every completed batch feeds the next one, where institutional knowledge lives in a system instead of someone’s head, and where the data from twelve months of growing actually compounds into better outcomes.

    That’s the category Growgoyle was built to own. AI-native cultivation management for commercial cannabis growers who want to stop relying on memory and start building on data. Your data, your facility, your genetics. Scored against your own best performance, not industry averages that have nothing to do with your operation.

    Frequently Asked Questions About Cannabis Cultivation Software

    Q: What is the difference between seed-to-sale software and cultivation intelligence?

    Seed-to-sale software handles regulatory compliance: tracking plants from propagation through sale for state agencies like METRC. It tells the government where your plants are. Cultivation intelligence is different. It analyzes your growing data, photos, environment readings, and harvest results to help you improve yields and consistency from one batch to the next. Most commercial operations need both: compliance software because it is legally required, and cultivation intelligence because it is how you get better.

    Q: Can I use AI cultivation software without buying new sensor hardware?

    Yes. Software like Growgoyle works with any sensor system you already have through CSV import or API connections. You do not need proprietary hardware. If you have sensors from Pulse, SensorPush, Agrowtek, or any other brand, you can connect them. Operations without sensors can still use photo-based AI analysis and manual environment logging to get started.

    Q: How much does cannabis cultivation software cost in 2026?

    Costs vary widely by category. Basic compliance software may be included in your state licensing fees or cost a few hundred dollars per month. Sensor-based platforms like AROYA require hardware investment plus ongoing subscriptions and are typically priced via custom demos for larger operations. AI cultivation intelligence like Growgoyle ranges from $499 to $999 per month depending on the number of active flower zones, with a 7-day free trial at the Pro tier.

    Q: Do I need both compliance software and cultivation management software?

    If you operate in a regulated state, you need compliance software because it is a legal requirement. But compliance software only tells regulators where your plants are. It does not help you grow better. Cultivation management or AI software is what helps you improve yields, identify problems early, and lower your cost per pound. They solve completely different problems, and serious commercial operations typically use both.

    Q: What is the best cannabis software for mid-sized commercial grows?

    For operations with 3 to 50 employees, the key is finding software that does not require a six-figure hardware investment or an enterprise sales process. Look for tools that work with your existing sensors, provide AI-driven insights specific to your facility data, and offer transparent pricing. Growgoyle was built specifically for this market segment by a commercial grower who operates a mid-sized facility in Michigan.


    Growgoyle doesn’t track your costs. It helps you lower them through better yields, tighter consistency, and the habit of reviewing every run. Want to see what the AI catches on your plants? Upload a few canopy photos and find out in 60 seconds. Try it free for 7 days, no credit card required.

    Keep Reading

    About the Author

    Eric is a 15-year software engineer who operates a commercial cannabis cultivation facility in Michigan. He built Growgoyle to solve the problems he faces every day: inconsistent yields, forgotten lessons from past runs, and the constant pressure to lower cost per pound. Every feature in Growgoyle comes from real growing experience, not a product roadmap.

  • Cannabis Yield Optimization: What the Data Actually Shows

    Cannabis Yield Optimization: What the Data Actually Shows

    Key Findings: Cannabis Yield Optimization

    Based on published research and commercial facility data, the three highest-impact yield optimization techniques for commercial cannabis are genetics selection (20-40% improvement potential), CO2 supplementation at 1,200-1,500 ppm (widely reported in commercial settings to boost yields 20-30%), and light intensity optimization through DLI management (Rodriguez-Morrison et al. 2021 showed linear yield increases with light intensity up to the highest levels tested). However, the factor most operations overlook is consistency: repeating peak performance across every batch compounds into more total pounds per year than any single technique improvement.

    Cannabis Yield Optimization Techniques Compared

    Technique Typical Yield Impact Cost to Implement Complexity Best Phase Key Research
    Genetics selection +20-40% Variable (cuts/seeds) Low (selection), High (phenohunting) Pre-cycle Backer et al. 2019, various cultivar trials
    CO2 supplementation (1,200-1,500 ppm) +20-30% $200-500/mo (tank + controller) Low Flower Chandra et al. 2008, 2011
    Light intensity / DLI optimization +15-25% $0 (dimmer adjustment) to $5,000+ (fixture upgrade) Medium Flower Rodriguez-Morrison et al. 2021; Eaves et al. 2020
    VPD optimization (0.8-1.2 kPa flower) +10-15% $0 (controller adjustment) Medium All phases Backer et al. 2019
    Irrigation and EC management +8-15% $0-200/mo Medium All phases Caplan et al. 2017
    Defoliation timing +5-12% $0 (labor only) High (skill-dependent) Week 3 and Week 6 of flower Danziger & Bernstein 2021
    Batch-over-batch analysis +10-20% cumulative over 3-5 cycles $499-999/mo (software) Low Post-harvest Emerging practice (see below)

    Individual techniques matter, but the real gains come from stacking them and then repeating the results. A facility that optimizes VPD, light, and CO2 but cannot replicate the results from one batch to the next leaves more pounds on the table than a facility with average technique but tight consistency.

    See What Your Canopy Is Telling You

    Snap a photo of your plants. Growgoyle’s AI identifies stress signals, uniformity issues, and optimization opportunities in 60 seconds. Free, no signup required. Growgoyle doesn’t track your costs. It helps you lower them through better yields and consistency.

    Analyze Your Plants Free
    Check Your Yield Consistency →

    Most yield optimization content comes from two places: home growers sharing anecdotes, and equipment companies telling you their product is the missing piece. Neither is particularly useful if you’re running a licensed commercial indoor operation where cost per pound determines whether you stay open next year.

    This is what the published research actually says about cannabis yield optimization, filtered through the reality of running a commercial facility. Not fixture specs. Not strain reviews. The actual controllable variables and how much they matter.

    What Yield Actually Means in a Commercial Context

    Before you can optimize yield, you need to measure the right thing. Three metrics matter, and they answer different questions.

    Grams per square foot measures canopy utilization. It tells you how efficiently you’re using the physical space you’re paying for. Watch this one when canopy management is the constraint.

    Pounds per light measures capital efficiency. Since lighting is a major fixed cost, lb/light tells you how much production you’re extracting per dollar of infrastructure. For most facilities with fixed canopy, this is the most actionable number.

    Grams per watt measures energy efficiency. Useful when comparing strains or light recipes, but less useful as an operational benchmark because it conflates genetics with environment.

    Total pounds is the wrong metric for optimization purposes. A facility producing 200 lb/run across 80 lights is underperforming one that produces 160 lb across 40 lights. Infrastructure matters. Yield per square foot is often a vanity metric. lb/light gives you a cleaner signal on operational performance.

    For benchmarks: Cannabis Business Times data (Lange, 2019) puts the commercial indoor range at roughly 1.5 to 3.0 lb/light, with top performers pushing above 3.0. A separate CBT/Fluence 2025 survey of 185 growers found g/sqft medians in the 35-80 range for indoor canopy. If your numbers consistently land in the bottom half of those ranges, something is leaving yield on the table. You can benchmark your operation in about 30 seconds with a free efficiency scorecard.

    Light Is the Primary Yield Driver (But Not How You Think)

    Every equipment company will tell you their fixture increases yield. Some of them are even right. But the mechanism matters more than the hardware.

    The variable that drives cannabis yield from lighting isn’t wattage. It’s DLI: Daily Light Integral, measured in mol/m²/day. DLI is the cumulative photons your canopy receives across the full photoperiod. Two facilities running the same fixture at different heights, for different hours, with different canopy depths will see dramatically different results even though their “wattage” is identical.

    Rodriguez-Morrison et al. (2021) found that increasing PPFD and DLI simultaneously increased both flower yield and cannabinoid content. That’s important because conventional growing wisdom has long treated potency and yield as a tradeoff. The data doesn’t support that in well-managed environments. You can get more of both by increasing DLI within the productive range.

    The diminishing returns curve is real, though. Beyond roughly 40-50 mol/m²/day, additional DLI produces less incremental yield while adding heat load and energy costs. Most facilities running modern LED fixtures are working in the 30-45 mol/m²/day range, which is appropriate. The issue is usually not total DLI but uniformity: canopy hotspots and cold spots that create uneven development.

    The most common LED optimization failure isn’t choosing the wrong fixture. It’s upgrading fixtures without adjusting canopy management. A high-output LED at 24 inches with an uneven canopy lights the tops of the tallest plants and leaves the rest underserved. An uneven canopy (popcorn, larf, poor light penetration) means more trim labor and lower effective yield even when the top colas look great.

    Cannabis yield response curve to Daily Light Integral (DLI) showing diminishing returns above 45 mol/m2/day
    Cannabis yield response to DLI: gains are significant up to roughly 45 mol/m²/day, then level off. Most operations underperform their fixture potential through canopy management gaps, not wrong hardware.

    Environment Sets the Ceiling, Genetics Sets the Floor

    VPD, CO2, and temperature don’t produce yield. They remove the cap on what your genetics can express. That’s a meaningful distinction when you’re troubleshooting a run that underperformed.

    Llewellyn et al. (2022) published a comprehensive review of environmental factors in cannabis cultivation (Front. Plant Sci.), documenting the interaction effects between temperature, humidity, CO2, and light intensity. The key finding for commercial operators: environmental variables have multiplicative effects, not additive ones. Dialing in CO2 at 1200 ppm when VPD is out of range doesn’t deliver the CO2 benefit. The plant can’t use it. The whole stack has to be right.

    The practical ceiling for most operations sits around 1200-1500 ppm CO2, 80-85°F canopy temperature, and VPD held in the 1.2-1.6 kPa range during late flower. Getting those numbers right doesn’t guarantee yield, but getting them wrong guarantees you’re leaving some on the table.

    On genetics: the trap many commercial operations fall into is chasing new cultivars when proven performers aren’t dialed in yet. If a strain isn’t consistently hitting its genetic potential after 10 runs, a new strain isn’t the answer. The environment or execution has a constraint. Find it first.

    One yield thief that’s genuinely underappreciated in commercial cannabis cultivation: Hop Latent Viroid (HLVd). Tumi Genomics data suggests 20-30% yield reduction in infected plants, and the infection accumulates in mother stock. Symptomatic or not, infected mothers propagate the problem into every cut taken from them. Test your mothers. Run clean stock. This one isn’t glamorous, but the yield impact is real and measurable.

    Consistency Is Worth More Than Peak Performance

    Here’s the argument that most commercial operators haven’t fully run the math on.

    A facility that averages 3.0 lb/light with tight run-to-run consistency has a fundamentally different business than one that averages 3.5 lb/light with high variance. Work through the numbers across six runs per room:

    • Consistent facility: 3.0 lb/light, every run. Six runs. 18 lb/light/year.
    • Variable facility: Three runs at 4.2 lb/light, three runs at 2.8 lb/light. Average 3.5. Same six runs. 21 lb/light/year on paper.

    The variable facility wins on raw numbers. But here’s what the math doesn’t capture: the three runs at 2.8 lb have a cause. Something changed between those runs and the good ones. Without systematic batch tracking, that cause doesn’t get identified, documented, or corrected. The same pattern shows up again, or something slightly different produces the same kind of drop.

    High variance also means the signal from any intentional change gets lost in the noise. Adjust the dryback protocol, next run comes in at 3.8 lb. Was it the dryback? The weather pattern that kept the facility cooler? Without enough controlled runs to separate signal from noise, outcomes get attributed to interventions that may not have caused them.

    The consistent facility can make one change at a time, observe the result, and build on it. That’s how 3.0 becomes 3.2, then 3.4 lb/light over 18 months. Yield consistency in cannabis cultivation is the foundation that makes compound improvement possible.

    What drives variance? Four primary sources: execution timing differences (the same task done at different intervals, slightly different ways), environmental drift between runs that doesn’t get compensated for, pest or disease events that go undetected until they’ve already affected yield, and undocumented protocol changes where a recipe was adjusted without a log entry.

    Bar chart comparing consistent 3.0 lb/light cannabis facility vs variable 3.5 lb/light facility across 12 sequential runs
    High variance looks good on a highlight reel. Across a full year, crash runs mask their own causes and prevent systematic improvement. The consistent facility can see what changed; the variable one is working with noise.

    Turnaround Time: The Yield Metric Nobody Measures

    Every day between chop and the next flip is a day your lights aren’t producing flower. Run the math and this stops being obvious and starts being alarming.

    Pipp Horticulture’s 2023 benchmarking data puts average turns per year for commercial indoor operations at 4.5 to 5.5, with high-efficiency operations hitting 6 or more. The difference between 5 and 6 turns per year isn’t just one extra run. At 3 lb/light across 100 lights, one additional turn is 300 lb of production. At $500-600 per pound wholesale, that’s $150,000 to $180,000 in additional revenue from the same facility, same team, same infrastructure.

    Two extra turnaround days per run across six annual runs equals 12 lost flower days per room. That’s roughly half a harvest cycle sitting empty while cleaning timelines stretch, transplants wait, or clone readiness doesn’t align with harvest schedule.

    Where turnaround time hides: cleaning that takes longer because it isn’t scheduled with the same precision as the flowering calendar, transplant delays when the mother room isn’t keeping pace with harvest frequency, and scheduling gaps when team availability doesn’t line up with room readiness. These are operations problems, not grow problems. The plants are fine. The calendar is where the yield disappears.

    The Compounding Effect

    Here’s what happens when you pull these levers together.

    Start with a baseline: 2.8 lb/light, five turns per year, 40 lights. That’s 560 lb/year. At $550/lb wholesale (a reasonable mid-market number), you’re looking at $308,000 in annual revenue.

    Now: tighten DLI management and canopy uniformity, add 10% to yield per run. 3.08 lb/light. Add one additional turn per year through tighter scheduling. Reduce variance by systematically comparing runs and correcting drift. True average stabilizes and improves another 5-8%.

    Result: roughly 3.2 lb/light at six turns per year. Same 40 lights. 768 lb/year. At $550/lb wholesale, that’s about $422,000 versus your $308,000 baseline at the same price.

    That’s roughly 40% more revenue from the same physical infrastructure, through optimization rather than expansion. This is how cost per pound drops without adding a single dollar of fixed cost: more production from the same square footage, same team, same utility bills.

    Batch comparison is the tool that makes this systematic. When any two runs can be placed side by side with data on what actually changed between them, the pattern becomes visible and actionable. A sensor dashboard that just displays readings doesn’t give you that. You need analysis that connects the variables to the outcome across runs, not just within them.

    You don’t need a bigger facility. You need more from the one you have. The data to do it is already sitting in your runs.

    Frequently Asked Questions

    Q: What is the biggest factor in cannabis yield?

    Genetics sets the floor and ceiling. Even with perfect environment control, a low-yielding cultivar cannot match a high-yielding one. Published cultivar trials show yield differences of 20-40% between strains grown in identical conditions (Backer et al. 2019). After genetics, light intensity (measured as DLI or daily light integral) is the strongest controllable factor, with research showing linear yield increases with no saturation point even at the highest light levels tested. Rodriguez-Morrison et al. (2021) demonstrated a 4.5-fold yield increase across their tested PPFD range in a controlled indoor study, confirming that more light continues to produce more flower up to at least 1,800 μmol/m²/s (approximately 78 mol/m²/day DLI).

    Q: What is a good yield per light for commercial cannabis?

    For modern commercial facilities using 600-700W LED fixtures, 2.0 to 2.5 pounds per light per cycle is common for average operations. Well-optimized facilities consistently hit 2.5 to 3.5 pounds per light. Above 3.5 is exceptional and typically requires strong genetics, dialed environment control, and experienced cultivation practices. Yield per light is more meaningful than yield per square foot or per plant because light is the primary energy input driving photosynthesis and biomass accumulation.

    Q: How does VPD affect cannabis yield?

    Vapor pressure deficit controls how fast your plants transpire, which directly affects nutrient uptake and photosynthetic rate. The optimal VPD range for flowering cannabis is approximately 0.8 to 1.2 kPa. Below 0.8, transpiration slows and the plant cannot move nutrients efficiently. Above 1.4, the plant closes stomata to conserve water, which reduces CO2 intake and slows growth. Commercial facilities that actively manage VPD within the optimal range typically see 10-15% yield improvements compared to those running off a static temperature and humidity setpoint.

    Q: Can AI improve cannabis yields?

    AI does not directly grow plants, but it can identify patterns across multiple batches that are difficult to spot manually. After each harvest, AI batch analysis can compare environment data, cultivation practices, and outcomes to previous runs and identify what drove improvements or declines. Over 3 to 5 cycles, this type of iterative analysis typically compounds into 10-20% cumulative yield improvement because each batch builds on lessons from the last. The key is consistent data collection: environment readings, harvest weights, photos, and grower notes.

    Q: How do you measure yield consistency?

    The standard statistical measure is coefficient of variation (CV%), which shows how much your yields swing from batch to batch. A CV below 10% means your operation is dialed in and repeatable. Between 10-20% is solid but has room to tighten. Above 20% means significant variation that is costing you pounds and profit. You can calculate this with as few as 4 harvests of the same strain. Track yield per light (or per plant or per square foot) across consecutive runs and look at the spread. A free tool for this is available at app.growgoyle.ai/consistency.


    Growgoyle doesn’t track your costs. It helps you lower them. Upload a few canopy photos and see what the AI catches. Or connect your batches and see what your run data actually shows about yield patterns across harvests. Try it free on your own plants.

    About the Author

    Eric is a 15-year software engineer who operates a commercial cannabis cultivation facility in Michigan. He built Growgoyle to solve the problems he faces every day: inconsistent yields, forgotten lessons from past runs, and the constant pressure to lower cost per pound. Every feature in Growgoyle comes from real growing experience, not a product roadmap.