Cannabis Water Activity (aw): The Post-Harvest Metric You’re Probably Ignoring
Here’s a question that should make every cannabis grower uncomfortable: how much weight are you throwing away at the end of every run? Not trim waste. Not larf you didn’t bother bucking. I’m talking about perfectly good, fully developed flower that you’re overdrying into dust because you’re not measuring water activity.
Most commercial cannabis cultivation facilities dry by time, by feel, or by some combination of “the stems snap, so it’s done.” And most of them are leaving real money on the table because of it. Water activity (aw) is the single most important post-harvest metric for determining whether your flower retains its weight, its trichomes, and its potency through drying and curing. Almost nobody is measuring it properly.
Let’s fix that.
What Cannabis Water Activity Actually Measures
First, let’s clear up the confusion between water activity and moisture content, because they are not the same thing.
Moisture content is a percentage. It tells you what fraction of your flower’s total weight is water. A reading of 12% moisture content means 12% of what’s on the scale is water. Simple enough.
Water activity measures something different. It’s the availability of water in the plant tissue, expressed on a scale from 0 to 1.0. Pure water is 1.0, bone dry is 0.0. What matters about aw is that it tells you how active that remaining moisture is. Two samples can have identical moisture content percentages but very different water activity readings, because the water is bound differently within the plant structure.
Why does that matter for cannabis drying? Because water activity determines three things that moisture content alone cannot predict:
- Microbial stability. Mold and bacteria need available water to grow. Below 0.65 aw, you’ve effectively shut down the conditions for microbial growth. This is the same food science principle that keeps beef jerky safe at room temperature.
- Trichome integrity. The resin glands on your flower are fragile structures. How much available moisture surrounds them affects whether they stay intact or become brittle and shatter during handling.
- Retained weight. Every point of aw below your target is weight you didn’t need to lose. And weight is revenue.
Moisture content tells you what happened. Water activity tells you what’s going to happen. That’s the difference, and it’s the reason the food and pharmaceutical industries moved to aw measurements decades ago. Cannabis is finally catching up.
The Optimal Cannabis Water Activity Zone: 0.55 to 0.63 aw
After tracking hundreds of batches across multiple harvests, the target zone for cannabis flower is clear: 0.55 to 0.63 aw.
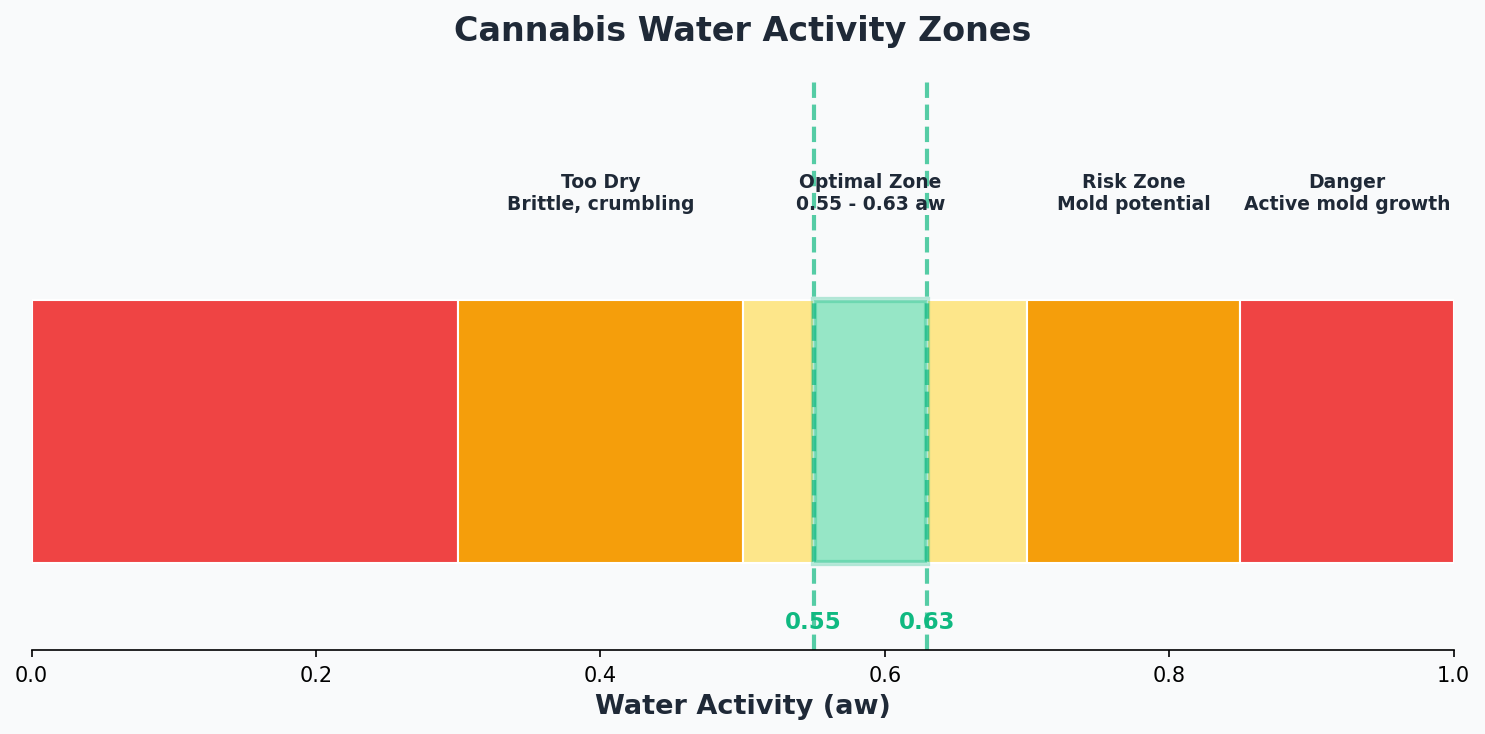
The three cannabis aw zones: microbial risk above 0.65, the optimal range at 0.55 to 0.63, and the overdry zone below 0.55 where compounding losses begin.
At the top of this range (0.60 to 0.63), you’re retaining maximum weight while still being well below the microbial danger zone. Your flower feels right. It has that slight give when you squeeze it, the stems have a clean snap, and the trichomes are intact. This is the sweet spot for flower that’s going to be sold on quality and bag appeal.
At the bottom of the range (0.55 to 0.58), you have even more safety margin for microbial stability. This makes sense for flower heading into long-term storage or into markets with particularly strict testing requirements. You’re trading a small amount of weight for extra insurance.
Below 0.55? That’s where the trouble starts. And most growers I talk to are living down there without realizing it.
The Three Compounding Losses of Overdrying Cannabis
Here’s what makes overdrying so expensive: the losses don’t just add up. They compound. You’re not dealing with one problem. You’re dealing with three problems that multiply each other. If you’re not tracking your trim ratio alongside your drying data, you’re seeing half the picture at best.
Loss #1: Moisture Weight (3-5% of Dry Weight)
This one is obvious but still underappreciated. Every unnecessary point of water activity you remove below 0.55 is weight that walks out the door. On a batch that should finish at 60 lbs, overdrying to 0.50 aw instead of landing at 0.60 can mean 2 to 3 lbs of lost weight. That’s pure moisture you pulled out of the flower that you didn’t need to. At estimated ~$500 per pound wholesale in many markets (and higher for top-shelf), those few pounds add up fast over the course of a year.
Loss #2: Shatter and Breakage During Processing (10-15% of Dry Weight)
This is the one that kills you. Overdried cannabis flower is brittle. When you buck it, trim it, sort it, bag it, every time someone touches it, small pieces break off. Trichome heads snap. Calyxes crumble. What should be premium top-shelf flower becomes shake and trim.
At 0.60 aw, flower has enough flexibility to survive mechanical handling. At 0.50 aw, it shatters like dry leaves in October. The difference in processing losses between properly dried and overdried flower can be 10 to 15% of total dry weight. On a 60 lb batch, that’s 6 to 9 lbs of flower that went from “A-grade” to “trim bin.”
Loss #3: Trichome and THC Degradation (1-3% Absolute)
Overdrying doesn’t just break trichomes mechanically. It degrades them chemically. When flower gets too dry, terpenes volatilize faster and THC begins converting to CBN. The result is a measurable drop in total cannabinoid potency.
We’re talking 1 to 3% absolute THC loss. That might sound small until you realize it can mean the difference between testing at 28% and testing at 25%. In competitive markets where buyers are sorting by potency brackets, that drop can push you into a lower pricing tier entirely.
The Compounding Effect
Stack those three losses together and the math gets ugly. You lose weight directly from over-removal of moisture. You lose more weight from breakage because the flower is too brittle. And then what’s left tests lower because the cannabinoids degraded. Less flower, at a lower grade, testing at a lower potency. That’s not a 5% problem. That’s a 20 to 30% revenue problem on a single batch.
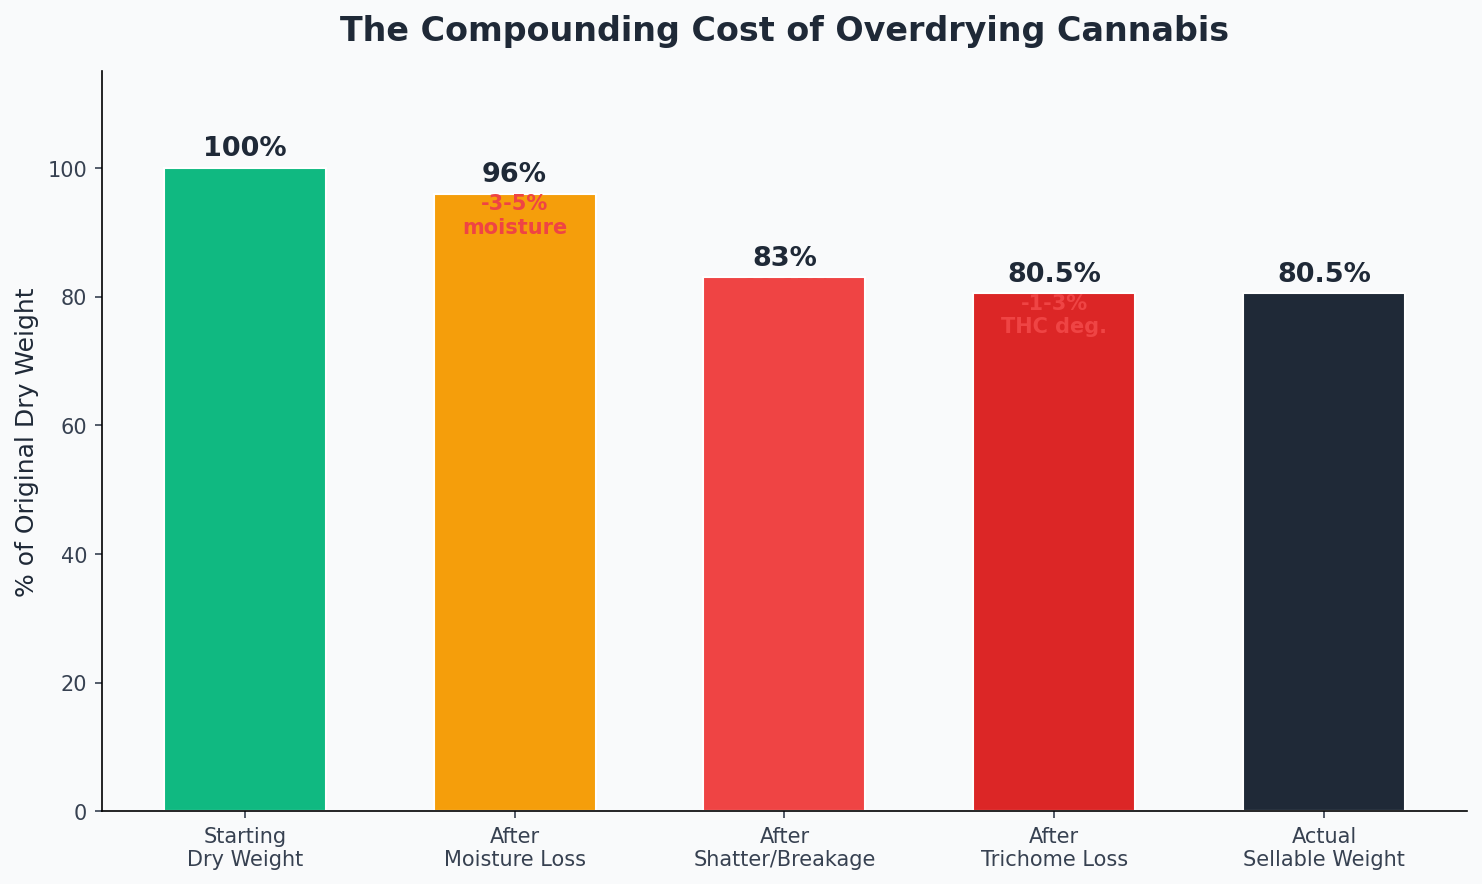
Overdrying losses compound: 3-5% moisture loss, 10-15% breakage, and 1-3% potency degradation stack into a 20-30% revenue hit per batch.
This is exactly the kind of pattern that shows up when you run a proper AI batch analysis after every harvest. The data doesn’t lie about where the weight went.
Real Numbers from a Real Cannabis Grow
Let me give you a concrete example, because abstractions don’t pay bills.
We had a batch of 67 lbs that was consistently finishing at around 0.50 aw. The flower looked fine visually. Stems snapped. By the old-school “it feels done” standard, it was done. But we were measuring, so we knew we were overshooting.
We dialed in the dry room parameters, slowed down the last 48 hours of drying, and started pulling batches at 0.61 aw instead. Same genetics. Same veg and flower environment. Same trim crew.
The result: that batch came in at 85 lbs. An 18 lb gain (27% more saleable flower) from the same plants. And the THC results came back 3% absolute higher. Same cultivar, same inputs, just better post-harvest execution.
Now multiply that across 12 or 20 harvests per year. Inconsistent yields aren’t always about what happened in flower. Sometimes the problem is what happened in the dry room, and the fix is knowing exactly when to pull.
Choosing a Cannabis Water Activity Meter
You need a dedicated water activity meter. Not a moisture meter. Not a hygrometer sitting in a jar. A dedicated aw instrument that uses either a chilled-mirror dew point sensor or a capacitance-based sensor to measure equilibrium relative humidity in a sealed chamber.
The good news: a solid portable water activity meter for cannabis operations runs $300 to $600. Lab-grade benchtop instruments cost more (often several thousand dollars), but most commercial grows don’t need that level of precision. Here are the brands worth looking at:
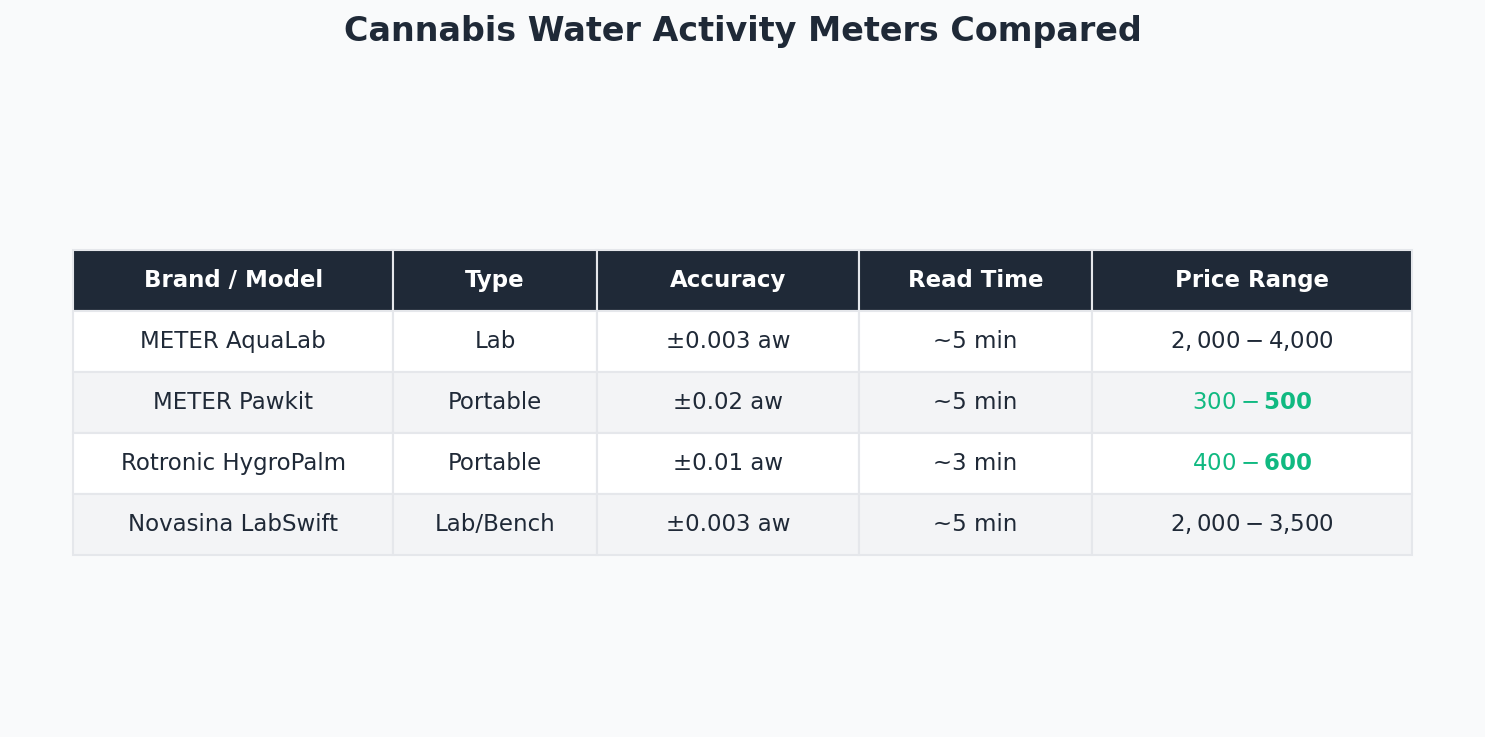
Popular water activity meters for cannabis operations. Portable models in the $300-$600 range are accurate enough for drying room use.
| Brand | Type | Accuracy | Read Time | Price Range |
|---|---|---|---|---|
| METER Group (AquaLab) | Lab / Benchtop | ±0.003 aw | ~5 min | $2,000+ |
| METER Group (Pawkit) | Portable | ±0.02 aw | ~5 min | $300-$500 |
| Rotronic (HygroPalm) | Portable | ±0.01-0.02 aw | ~5-10 min | $400-$600 |
| Novasina (LabSwift) | Compact Lab | ±0.01 aw | ~5-10 min | $500-$800 |
For most commercial cannabis grows, a portable meter in the $300 to $600 range is the right call. Lab-grade AquaLab instruments are excellent if your budget allows, but you don’t need ±0.003 precision to know the difference between 0.50 and 0.60 aw. A portable unit at ±0.02 gets you there.
The investment pays for itself on the first batch if you’re currently overdrying. Which, statistically, you probably are.
Cannabis Water Activity Measurement Protocol
Owning a meter is step one. Using it correctly is step two. A sloppy measurement protocol gives you data you can’t trust, and bad data is worse than no data.
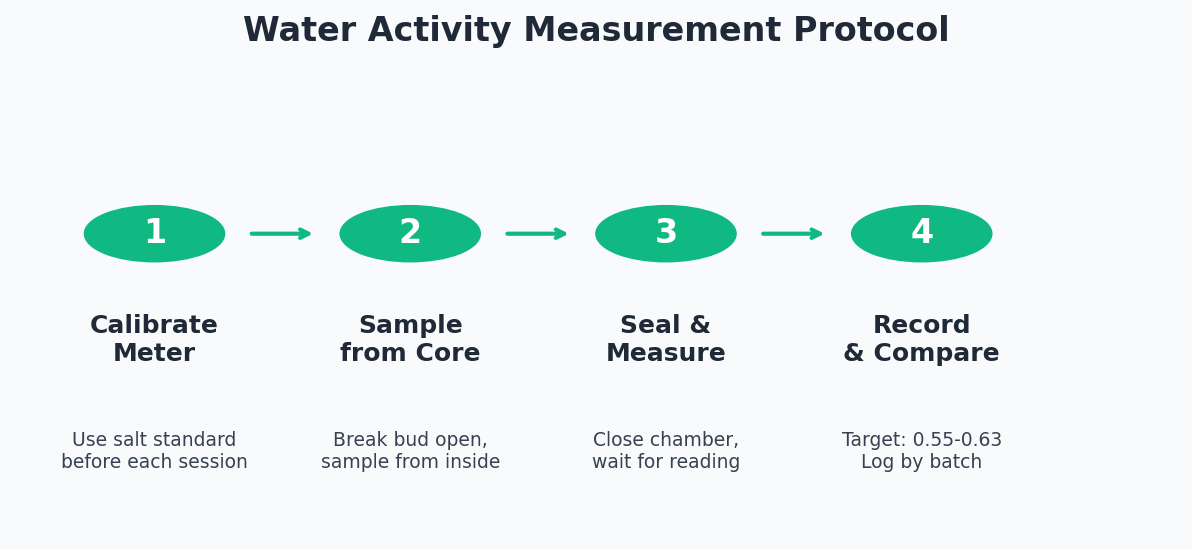
A consistent measurement protocol turns aw readings from random spot checks into reliable batch data.
Sample from multiple locations in your dry room, not just the bottom rack closest to the door. Cannabis water activity can vary significantly from rack to rack and room to room, depending on airflow patterns, proximity to dehumidifiers, and plant density. Sample at least 3 to 5 spots per batch.
Break or grind the sample to expose interior tissue before placing it in the meter chamber. The reading you want is the water activity of the flower itself, not just the surface. Let the meter reach full equilibrium before recording. Record every reading alongside the batch ID, the rack location, and the hours elapsed since chop.
Once you start tracking aw over time, you’ll see patterns in your drying curve that you never noticed before. You’ll know exactly when to pull each batch instead of guessing. And when you combine this data with environment data from your grow rooms, you start to see the full picture of how your facility actually performs from seed to sale.
How Growgoyle Tracks Cannabis Drying Performance
This is where it gets interesting if you’re already using Growgoyle or thinking about it.
The Goyle Score, which rates every batch from 0 to 100 across five dimensions, includes a dedicated Drying dimension worth 10% of the total score. This isn’t some generic pass/fail. It evaluates your post-harvest execution against your own historical performance, looking at how your dry times, conditions, and outcomes compare to your best runs.
When you complete a batch and run it through Growgoyle’s AI batch analysis, the system flags overdrying specifically. It doesn’t just tell you “your drying score was low.” It tells you why and estimates exactly how many pounds the batch left on the table. Not a vague “you could improve.” An actual number: “Based on your batch weight and drying parameters, an estimated X lbs were lost to overdrying.”
That’s the kind of information that changes behavior, because it puts a dollar sign on the problem. It’s one thing to know overdrying is bad in theory. It’s a different thing to see that last Tuesday’s batch gave up $12,000 in revenue that didn’t need to be lost.
The batch comparison feature is especially valuable here. You can pull up your best-performing run of a cultivar and compare it side by side with a run that underperformed on drying. The differences jump out immediately: where the drying curves diverged, what environmental conditions were different, how long the batch spent in each phase. It turns “that run was better” into “here’s specifically what made that run better.”
Over time, these insights compound. The same post-harvest patterns stop repeating. Your drying consistency tightens. And your cost per pound drops because you’re converting more of what you grow into sellable product.
Stop Leaving Pounds on the Drying Room Floor
Cannabis water activity measurement isn’t complicated. It isn’t expensive relative to what it saves you. And it isn’t optional if you want to run a competitive commercial grow in today’s market.
Get an aw meter. Start measuring every batch. Target 0.55 to 0.63. Track your results. You will find pounds you didn’t know you were losing.
The grows that survive the next few years will be the ones that stopped leaving money in the dry room. Water activity is where that starts.
Growgoyle doesn’t track your costs. It helps you lower them. See it in action. Try it free on your own plants.