If you have been growing for a while, you already know VPD is the number that ties your temperature and humidity together into something a plant actually feels. In veg, the goal is different from flower. You are not protecting dense buds from rot. You are pushing fast, healthy growth and building leaf area. That changes the numbers you want to hit.
This post is strictly about the vegetative stage. When you are ready to think about the back half of the run, read our companion post on VPD in Flower. If you want the full picture across every stage, start with our complete VPD guide.
Why Veg Runs a Lower VPD
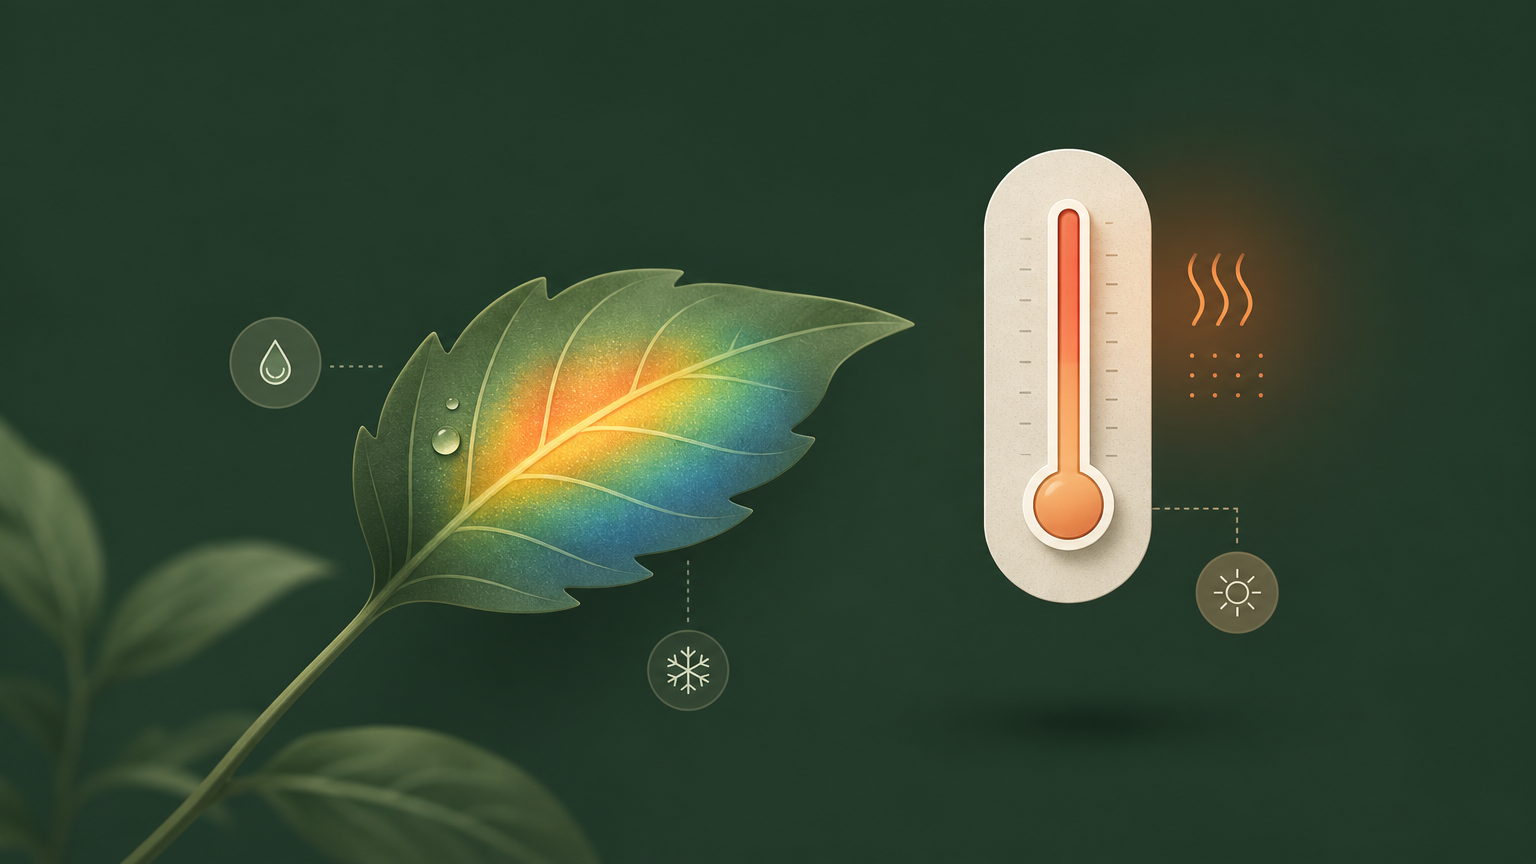
VPD measures how hard the air is pulling moisture out of the leaf. Higher VPD means drier air and faster transpiration. Lower VPD means softer, more humid conditions and gentler water loss.
In veg you want a softer environment. A lower VPD keeps stomata open, lets the plant transpire comfortably, and encourages the large, thin leaves that catch light and drive growth. Push VPD too high in veg and plants close their stomata to conserve water, which slows carbon uptake and stunts the growth you are trying to build.
Zheng’s work on plant environment control shows that transpiration and stomatal behavior track closely with VPD, and that young, actively growing tissue is more sensitive to water stress than mature tissue (Zheng, ed., Handbook of Cannabis Production in Controlled Environments, 2022). Llewellyn and colleagues have also documented how cannabis morphology responds to environmental drivers during vegetative growth (Llewellyn et al., University of Guelph). The practical read: keep veg comfortable and the plant spends its energy on leaves and shoots, not on defense.
Target Ranges for Veg
Here are the ranges most commercial growers settle into for cannabis in veg. Treat these as leaf-aware targets, meaning they assume leaf temperature is a few degrees below air temperature under typical airflow.
Rooted clones and fresh transplants: about 0.6 to 0.8 kPa. Small root systems cannot replace water fast, so keep the air soft.
Established veg plants: about 0.8 to 1.1 kPa. This is the working range for most of veg once roots have filled in.
Late veg, approaching the flip: about 1.0 to 1.2 kPa. Start nudging upward here to prepare plants for the drier flower environment.
These are starting points, not gospel. Your genetics, airflow, and canopy density all shift the sweet spot. Always confirm your exact temperature and humidity combination against a chart or the free VPD calculator rather than guessing.
Clones and Young Plants Need the Softest Air
A freshly cut clone has no roots at all. It cannot pull water from media, so its only defense against a dry room is closing stomata and hoping. That is why domes and high humidity exist for propagation.
Aim very low, around 0.4 to 0.6 kPa, until roots appear. As roots develop, you can ease the humidity down and let VPD climb toward the 0.6 to 0.8 kPa range. The data on rooting success is clear that low VPD during propagation reduces wilt and improves strike rates, because the cutting is not fighting to hold water it cannot yet absorb.
Move too fast here and the data will show it as slow rooting and dieback. That is an environment signal, not a skill failure. Soften the air and the numbers usually recover.
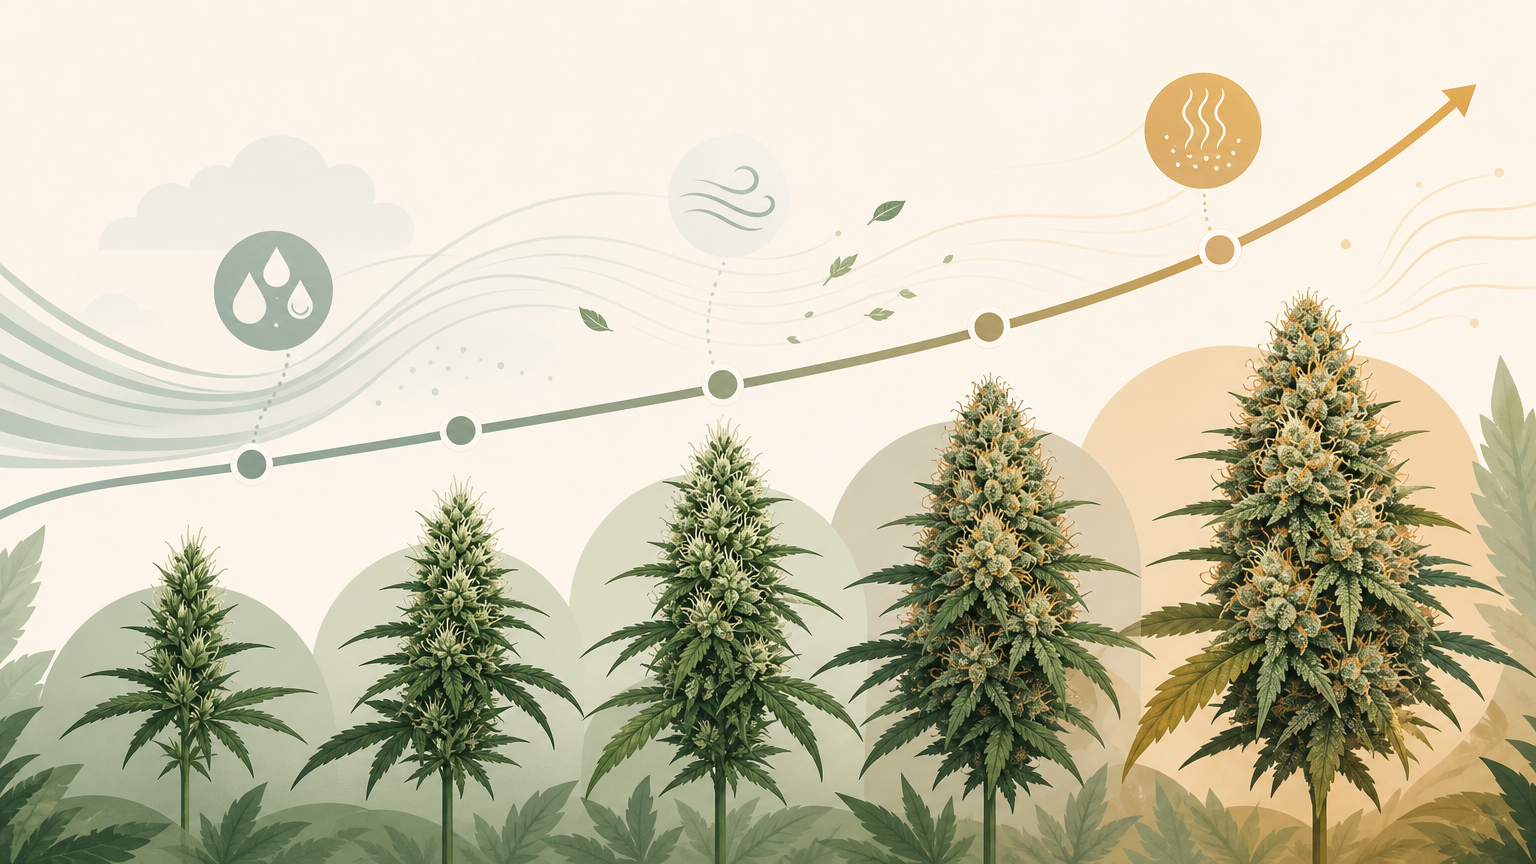
Stepping VPD Up as Plants Mature
Once plants are rooted and running, they can handle a firmer environment. A slightly higher VPD in mid to late veg drives stronger transpiration, which pulls more water and nutrients through the plant and supports vigorous growth.
The move is gradual. Raise VPD in small steps of roughly 0.1 kPa over several days rather than jumping the setpoint overnight. You do this mostly by lowering humidity a few points at a time, or nudging temperature, while watching how leaves respond.
Healthy plants at a good VPD show flat, reaching leaves and steady growth. Leaves that taco, cup, or show tip curl are telling you the air got too aggressive for where the roots are. Back off and let the data settle.
Transitioning to Flower Without Shocking Plants
The flip is where a lot of environments go sideways. Flower generally wants a higher VPD than veg, often in the 1.2 to 1.5 kPa range depending on stage and genetics. Slamming plants from a soft veg environment straight into dry flower air is a stress event you can avoid.
Start the transition in the last week or so of veg. Bring VPD up toward the top of the veg range, around 1.1 to 1.2 kPa, so the jump into early flower is a step and not a cliff. Plants that arrive at the flip already acclimated to firmer air transition with less stall.
Keep the changes small and let the plant confirm each one before the next. When you do reach flower, the VPD in Flower post covers where to take it from there.
Use a Chart, Not a Guess
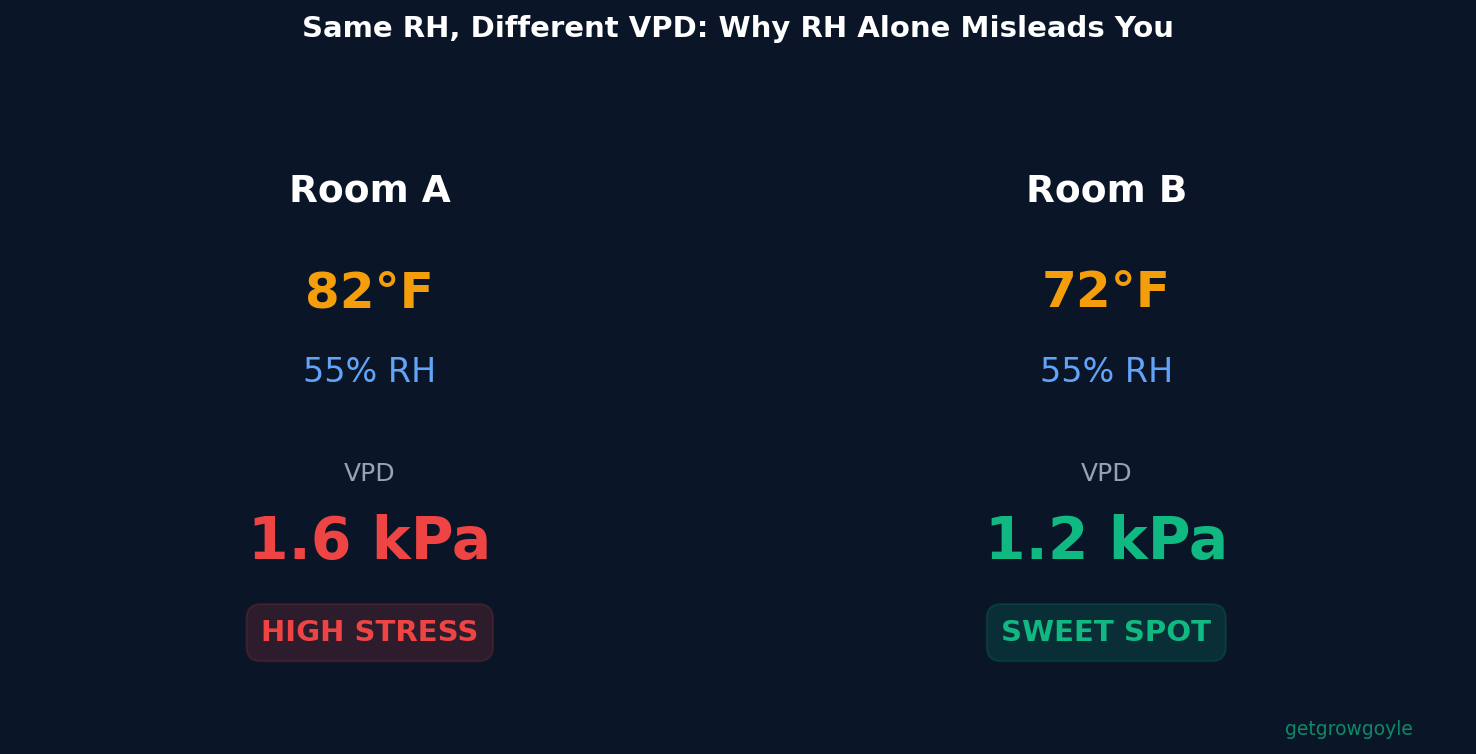
VPD is a calculation, not a feeling. The same 75 degrees at 60 percent humidity versus 70 percent humidity lands in two different places on the chart, and one of them might be out of range for your stage.
Keep a chart within reach of your controller. A printable VPD chart taped to the wall is a solid low-tech backup. For live numbers that account for leaf temperature offset, run your readings through the free VPD calculator.
The point of a target range is to give you a lane. The chart is what keeps you in it as your room conditions drift through the day.
Dial In Your Veg VPD
Growgoyle is software that runs your grow. It reads your room, tracks VPD against your stage targets, and tells you when the environment drifts out of the veg range so you can fix it before growth stalls. It works with the sensors you already run, so there is no new hardware to buy to get started. METRC tracks your grow for the state. Growgoyle tracks it for you.
Start with the free VPD calculator to check your current numbers against the veg ranges above. When you are ready to have your whole room watched instead of spot-checked, start your free 30-day trial.
Most VPD charts hand you a single number and call it a day. That is fine for a poster on the wall, but flower is not one stage. A plant in week 1 stretch is doing something completely different than a plant in week 8 with dense, resin-heavy colas. If your VPD target never moves across the cycle, you are leaving transpiration control on the table.
This is a walk through the flower cycle, week by week, from one grower to another. We will cover transition and stretch, mid-flower bulk, and the late-flower dryback that keeps botrytis out of your best buds. If you want the full background on what VPD actually is and how to calculate it, start with our complete VPD guide.
A Quick Note on Leaf VPD vs Air VPD
Before the numbers, one thing matters more than any chart: the target that counts is leaf VPD, not air VPD. Leaf temperature under LEDs often runs a couple degrees cooler than air temp, and that gap shifts the actual pressure gradient the plant feels.
Every range below is written as a leaf-VPD-aware target. Verify against a real chart or calculator with your own leaf temp offset before you dial your room. We break down the difference in Leaf VPD vs Air VPD, and you can run your exact numbers on the free VPD calculator.
Weeks 1 to 3: Transition and Stretch
The first three weeks of 12/12 are about establishing the canopy, not maxing out transpiration. Plants are still stretching, building the frame that will hold your yield. Push VPD too hard here and the data tends to show slowed growth and tighter, more defensive stomatal behavior.
Aim for roughly 1.0 to 1.2 kPa (leaf VPD) through the stretch. This keeps stomata comfortably open so the plant moves water and nutrients without fighting the environment. Rodriguez-Morrison, Llewellyn, and Zheng (2021) found cannabis photosynthesis and yield respond strongly to environment when stomata stay open and functional, and a moderate gradient early supports exactly that.
Keep humidity in the 60 to 65 percent range at typical flower temps to land in that window. The goal is steady, unstressed establishment. You are not trying to force anything yet.
Weeks 4 to 6: Mid-Flower Bulk
This is where the flowers pack on weight, and it is where a well-tuned VPD earns its keep. Transpiration is running high, the plant is pulling water and feeding hard, and the canopy is at full demand.
Target the 1.2 to 1.4 kPa band (leaf VPD) through the bulk phase. This slightly firmer gradient keeps transpiration strong, which drives nutrient uptake and calcium movement into developing tissue. If the data shows stomata closing (leaf temp climbing, transpiration flattening), the gradient has been pushed too far and the plant is protecting itself.
Practically, that usually means holding humidity around 55 to 60 percent as temps sit in the high 70s to low 80s. Watch your dryback and runoff, not just the wall sensor. If the numbers say the plant is drinking well and growing, the environment is working.
One trap to avoid in bulk: chasing a tighter VPD by dropping humidity too fast. If transpiration outruns what the roots can supply, the data shows tip burn and stalled feeding even when your kPa reading looks textbook. The gradient and the root zone have to move together. A perfect number on the sensor means nothing if the plant cannot keep up with it.
Every room is a little different, so verify your exact target against a printable VPD chart you can keep near the controller.
Weeks 7 and Beyond: Late Flower and Ripening
Late flower is the highest-risk stretch of the whole cycle. Buds are dense, humidity gets trapped inside the canopy, and that is exactly the microclimate Botrytis cinerea wants. Bud rot thrives in cool, humid, still air around tight flower clusters, and once it takes hold in a dense cola it spreads fast.
This is why the late-flower dryback strategy exists. As buds densify, you raise VPD to push transpiration and pull moisture out of the canopy, lowering the humidity that mold needs to establish. Aim for 1.2 to 1.5 kPa (leaf VPD) in the final weeks, leaning toward the higher end if your buds are especially dense or your room holds humidity.
Zheng’s work on controlled-environment cannabis reinforces the same principle growers see in the room: managing humidity and keeping air moving is central to reducing gray mold pressure in dense canopies. A firmer VPD is one of your cleanest levers for that.
VPD does not work alone here, though. Dehumidification and canopy airflow do the heavy lifting alongside it. Raising VPD tells the plant to transpire, but you still need the equipment to pull that moisture out of the room and keep air moving through the interior of the canopy where rot starts. Think of VPD as the setpoint and your dehu and fans as the muscle behind it.
The Dryback Tradeoff
Here is the honest part. A more aggressive late-flower VPD is a tradeoff, not a free win. Push too high and the data shows stomata closing, transpiration stalling, and ripening slowing down. The plant stops drinking and effectively hits the brakes.
The move is to raise VPD deliberately, not blindly. Nudge it up, watch transpiration and dryback for two or three days, and confirm the plant is still moving water. If transpiration holds and humidity drops, you have found the sweet spot. If the plant clamps down, back off. Let the data tell you where the edge is instead of guessing.
The Week-by-Week Cheat Sheet
Keep these as starting points, all leaf-VPD-aware, all worth verifying against your own leaf temp:
Weeks 1 to 3 (stretch): 1.0 to 1.2 kPa
Weeks 4 to 6 (bulk): 1.2 to 1.4 kPa
Weeks 7+ (ripening): 1.2 to 1.5 kPa, leaning high for dense buds
Notice the trend: the gradient rises as the cycle progresses. Early flower stays gentle to protect establishment, and late flower firms up to protect the harvest from rot. That upward drift, tuned to what your plants are actually doing, is the whole game.
Where the Numbers Come From
None of this works if VPD is the only thing you look at. A target of 1.4 kPa means nothing if your leaf temp offset is off or your sensors are drifting. The growers who nail this are the ones checking VPD against transpiration and dryback, not just chasing a number on a chart.
That is the difference between reacting to problems in week 8 and preventing them in week 4. The data is there in every room. Most operations just are not watching it closely enough to act in time.
Run Your Own Numbers
Growgoyle is software that runs your grow. It watches your environment and your plants together, so the week-by-week VPD shifts above stop being guesswork and start being decisions backed by your own room data. It works with the sensors you already run, so there is no new hardware to buy to get started. METRC tracks your grow for the state. Growgoyle tracks it for you.
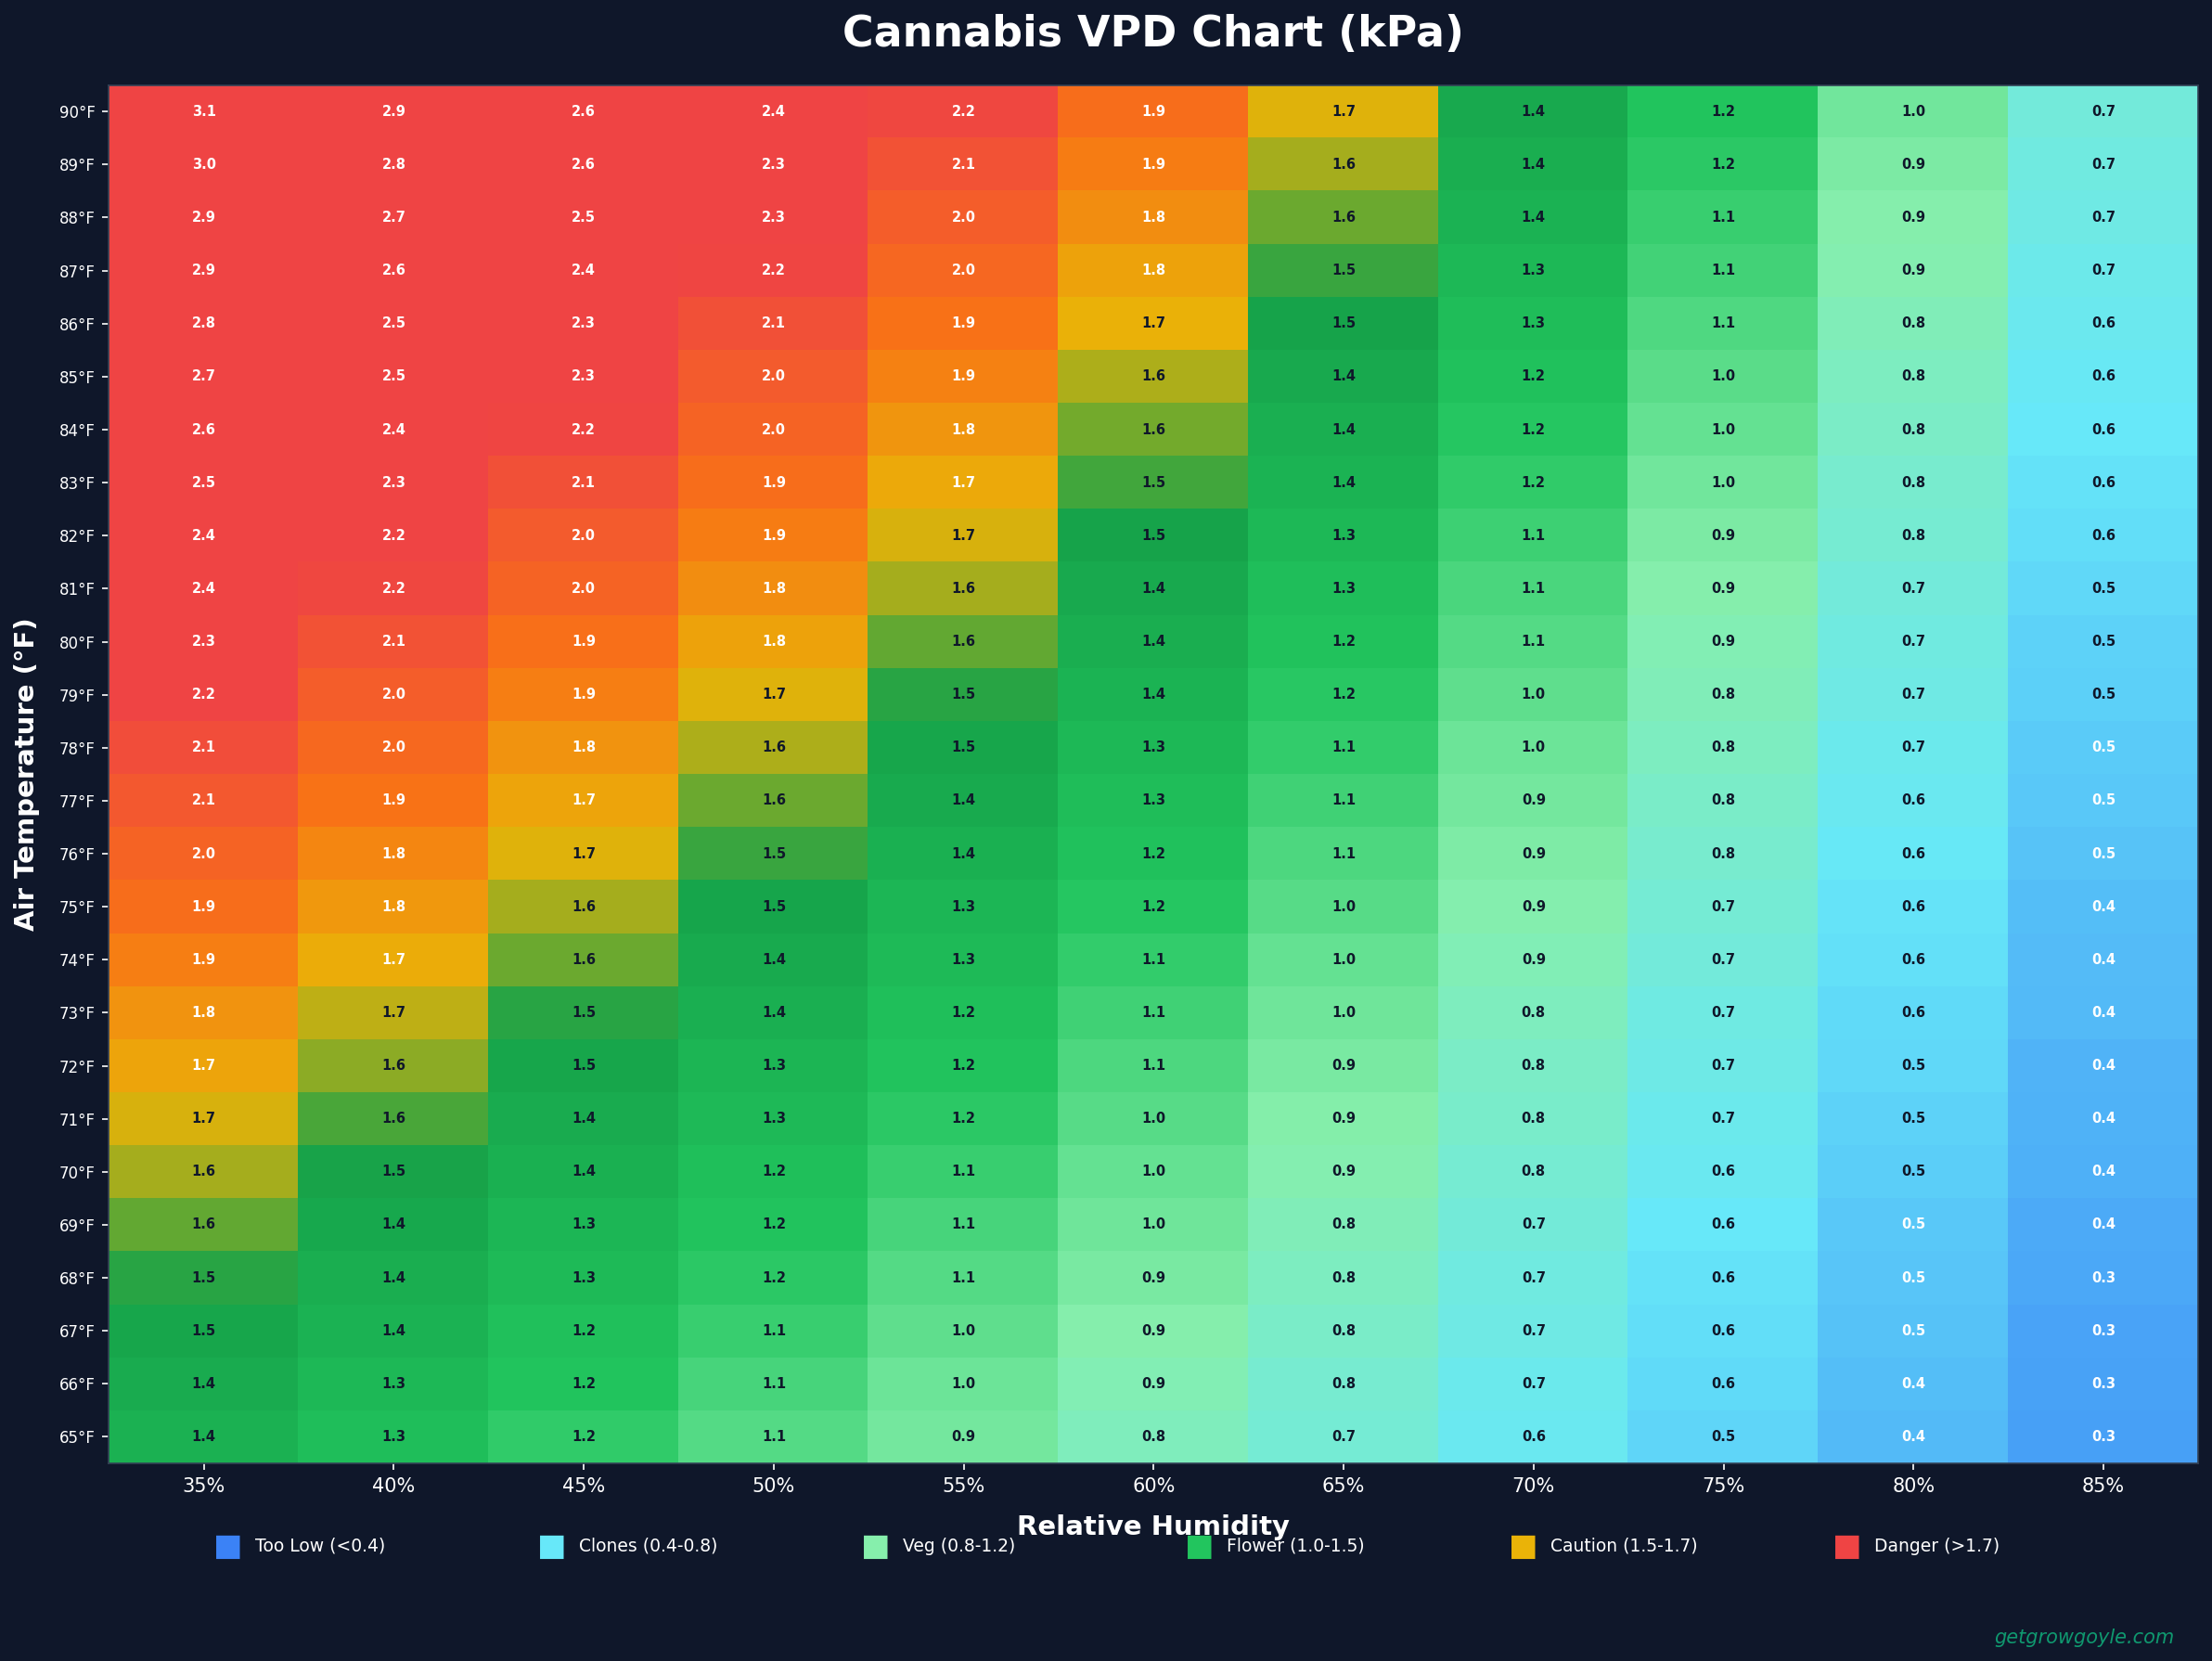
If you have spent any time in grower forums, you have seen the VPD chart. It is that grid of red, yellow, green, and blue squares that everybody posts and nobody fully explains. People tell you to “stay in the green,” and that is about where the advice stops.
So let me walk you through it the way I wish someone had walked me through it. Grower to grower, no jargon for the sake of jargon. By the end of this you will know what every part of the chart is telling you and how to actually use it in your room today.
What a VPD Chart Actually Is
VPD stands for vapor pressure deficit. In plain terms, it is a number that describes how thirsty the air is. Dry air pulls moisture out of your plants hard. Saturated air barely pulls at all.
A VPD chart is just a lookup table. You feed it two things you can measure in your room, temperature and relative humidity, and it hands back a single number in kPa. That number is the deficit. It is the gap between how much water vapor the air is holding right now and how much it could hold if it were completely full.
That is the whole trick. Temperature and humidity are inputs. VPD in kPa is the output. The chart just does the math for you so you do not have to run the formula by hand.
Reading the Two Axes
Every standard VPD chart is built the same way. One axis is temperature. The other is relative humidity. Where the two lines meet, you land on a colored cell, and that cell has a kPa value in it.
Most charts put temperature down the left side and humidity across the top, but some flip it. Do not assume. Read the labels first, every single time, because a chart with the axes swapped will send you the wrong direction.
Find your room temperature on one axis. Find your relative humidity on the other. Trace both until they intersect. That cell is your current VPD. That is all there is to the mechanics.
What the Colored Bands Mean
The colors are ranges, not hard walls. They are a visual shortcut for “too humid,” “good,” and “too dry.”
The high humidity corner (low VPD, often blue or purple) means the air is close to saturated. The plant cannot move much water, transpiration slows, and you raise your risk of mold, mildew, and slow nutrient uptake.
The low humidity corner (high VPD, usually red) means the air is aggressively pulling water. Plants can transpire faster than the roots can resupply, stomata close to protect themselves, and growth stalls.
The green band in the middle is the working range where transpiration stays steady without stressing the plant. Rough targets that most growers use: around 0.4 to 0.8 kPa for seedlings and clones, 0.8 to 1.2 kPa through veg, and 1.2 to 1.5 kPa in flower. Treat those as starting points, not gospel. Different genetics and different setups shift the sweet spot.
What kPa Actually Means
Here is the part most charts skip. kPa stands for kilopascal, which is a unit of pressure. So why is a humidity concept measured in pressure?
Because water vapor exerts pressure, and warm air can hold more of it than cold air. Scientists calculate the maximum vapor pressure the air could hold at a given temperature using a saturation vapor pressure formula (the Tetens and Magnus equations are the common ones). That maximum is called saturation vapor pressure.
The air right now is holding some fraction of that maximum, and relative humidity is exactly that fraction. Subtract what the air is holding from what it could hold, and the difference is your VPD in kPa.
So a VPD of 1.0 kPa is not abstract. It is a real measure of how much more moisture the air has room for, and by extension how hard the air is tugging on the water inside your leaves. Higher kPa, stronger pull. Lower kPa, weaker pull. That pull is the engine behind transpiration, and transpiration is how plants move water, cool themselves, and carry nutrients up from the roots (Zheng, 2022; Llewellyn et al., 2023).
Why Different Charts Show Different Numbers
Pull up two VPD charts and you will often see different kPa values for the same temperature and humidity. This confuses a lot of growers into thinking one chart is wrong. Usually neither is.
The difference comes from leaf temperature. The pressure deficit that matters to the plant happens at the leaf surface, not in the open air. Leaves in an actively transpiring canopy usually run cooler than the surrounding air, often by 2 to 3 degrees.
Some charts assume a leaf temperature offset (they subtract a couple of degrees before doing the math) and some assume no offset at all. A chart built with a 2 degree offset will report a lower VPD than a plain air chart for the same readings. That is the whole reason for the gap.
This is worth understanding before you trust any single grid. We break the difference down fully in our guide on leaf VPD vs air VPD, and it is the single most common reason two growers argue about numbers that are both correct.
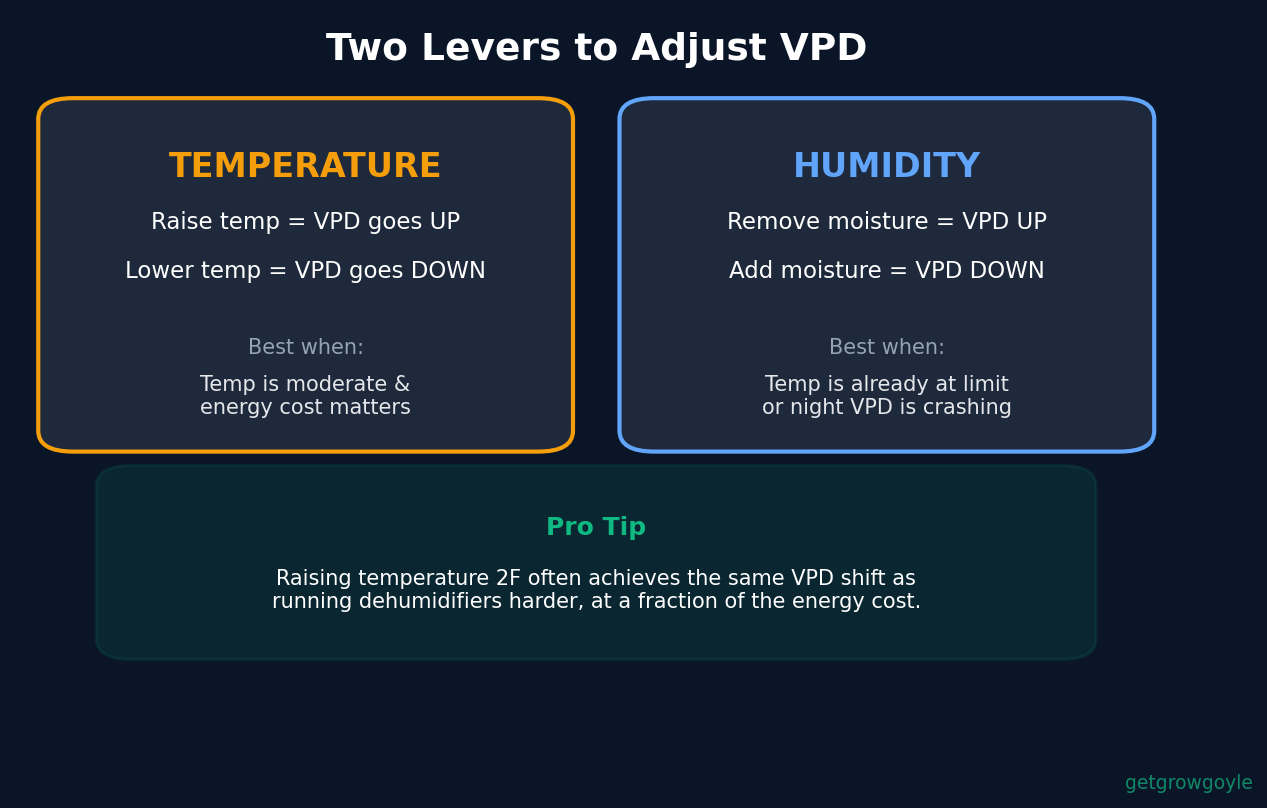
How to Use a Chart in Your Room Today
Theory is fine, but let me get practical.
First, measure at the canopy, not at the wall. Your controller sensor by the door and the air around your buds can read very differently. Put a sensor at plant height where the flowers actually live.
Second, decide whether you care about air VPD or leaf VPD. If you have an infrared thermometer, point it at a shaded fan leaf and read the real leaf temperature. If you do not, use a chart with a reasonable 2 to 3 degree offset and know it is an estimate.
Third, find your intersection on the chart and see which band you land in. If you are in the humid corner, your problem is usually not enough dehumidification or airflow. If you are in the dry corner, you are venting too hard or your humidity is crashing under the lights.
Fourth, change one thing at a time. Adjust humidity or temperature, wait a few hours, and re-read. Chasing both at once makes it impossible to see what worked.
If you want the math done automatically instead of squinting at squares, our free VPD calculator lets you punch in temperature, humidity, and a leaf offset and get the exact kPa. You can also grab a printable VPD chart to tape inside the room, and for the full picture, our complete VPD guide covers targets by growth stage in detail.
The Takeaway
A VPD chart is not magic. It is temperature and humidity turned into one number that tells you how hard the air is pulling water out of your plants. Read the axes, find the intersection, understand that the colors are ranges and the kPa is a real pressure gap, and remember that leaf temperature is why charts disagree.
Get that, and you are no longer just “staying in the green.” You know why the green is green.
Run Your Grow by the Numbers
Growgoyle is software that runs your grow, tracking the environment your plants actually live in so you are not guessing at squares on a chart. Log your canopy readings, watch your VPD trend over the day, and catch the swings before they cost you yield. It works with the sensors you already have, so there is no new hardware to buy to get started.
Start with the free VPD calculator to dial in your target, then start your free 30-day trial to track it over a full cycle. You don’t need to wait for a new batch. Got a room in flower right now? That’s all you need.
References: Zheng, Y. (Ed.). (2022). Handbook of Cannabis Production in Controlled Environments. CRC Press. Rodriguez-Morrison, V., Llewellyn, D., & Zheng, Y. (2021). Cannabis Yield, Potency, and Leaf Photosynthesis Respond Differently to Increasing Light Levels in an Indoor Environment. Frontiers in Plant Science, 12, 646020.
If you have been dialing VPD for a while, you already know the drill. You mount a sensor at canopy height, you read the number, you nudge temperature and humidity until you land in the range a chart told you to hit.
Here is the problem. That sensor is reading the air. Your plants do not transpire based on the air. They transpire based on the temperature of the leaf surface, and the leaf is almost never the same temperature as the air around it.
That gap is where a lot of “perfect on the chart, still not happy” rooms come from.
Air VPD and Leaf VPD Are Two Different Numbers
VPD is vapor pressure deficit, the difference between how much water vapor the air is holding and how much it could hold at saturation. The catch is which temperature you use to calculate the saturation point.
Air VPD uses air temperature. That is what your sensor and every standard VPD chart use. It is easy to measure and easy to publish, so it became the default.
Leaf VPD uses leaf temperature. It is the deficit between the saturated air inside the leaf (right at the stomata) and the air just outside it. Since the water actually leaves the plant at the leaf surface, leaf VPD is the number the plant experiences.
When leaf and air temperature match, the two numbers match. They rarely match.
Why the Leaf Runs Cooler (and Sometimes Warmer)
A transpiring leaf is a swamp cooler. As water evaporates off the leaf surface, it pulls heat out of the tissue. This is called transpirational cooling, and it is one of the most established principles in plant physiology, described in standard references like Jones’ Plants and Microclimate and covered in any crop physiology text.
Under healthy transpiration, a fan leaf commonly sits a few degrees below air temperature. Two to four degrees Fahrenheit is a normal range, though the exact offset depends on your room.
The direction can flip. Under intense LED with weak airflow, a leaf can run at or above air temperature because it is absorbing radiant energy faster than it can shed heat, and stagnant air will not carry that heat away. So the offset is not a fixed correction factor. It moves.
LED vs HPS Changes the Math
Light source matters here, and not for the reason most people assume.
HPS fixtures throw a lot of radiant heat, including infrared, straight at the canopy. That radiant load warms leaf tissue directly, which tends to shrink the cooling gap or even push leaves warmer than air.
LED delivers less radiant heat to the leaf surface for the same usable light. Under LED, a well watered plant with decent airflow often shows a wider cooling gap, meaning the leaf sits further below air temperature than growers expect.
The practical result: a room that switched from HPS to LED and kept the exact same air-VPD targets may now be running its plants at a different leaf VPD than before, even though the chart says nothing changed. The data shifted underneath the target.
How to Actually Measure Leaf Temperature
You cannot fix what you cannot see, and leaf temperature is measurable with cheap gear.
An infrared (IR) thermometer, the handheld point-and-shoot kind, is the entry point. It reads surface temperature without contact. An IR camera (or a phone IR attachment) gives you a full thermal picture of the canopy, which is more useful because it shows variation across the room.
Where you point it matters more than the tool. Aim at a healthy, fully expanded fan leaf in the upper canopy that is shaded from direct light at the moment you read it. You want a leaf that represents the working canopy, not an outlier.
Common Measurement Mistakes
A few errors will hand you garbage numbers.
Reading a leaf in a direct light beam measures the light hitting the leaf as much as the leaf itself. Move to a shaded leaf or shade it briefly before reading.
Holding the IR thermometer too far away widens the measurement spot until it is averaging leaf, air, and whatever is behind the leaf. Get close, within a few inches, so the spot stays on tissue.
Reading a wilting, damaged, or shaded-out lower leaf tells you about that leaf’s problems, not your canopy. And taking one reading tells you nothing about spread. Take several across the room. If the data shows a 3 degree difference corner to corner, that is an airflow story worth chasing.
A Practical Rule of Thumb
You do not need to abandon air VPD. You need to correct it.
Start by measuring the actual leaf-to-air offset in your room. Read air temperature at canopy and leaf temperature on several representative fan leaves during the middle of the photoperiod, when transpiration is running.
If your leaves sit, say, 3 degrees below air, then the leaf VPD is lower than your air-VPD reading suggests. To hit a true leaf VPD in your target range, your air VPD needs to sit a bit higher than the chart value. In plain terms, chart-based air targets tend to overshoot on the dry side once you account for cooler leaves, so many rooms are running plants harder than they think.
The correction is not permanent. The offset shifts with airflow, light intensity, and plant water status. A plant closing stomata under stress cools less, so its leaf warms toward air temperature and its true VPD climbs, which is exactly when you least want it to. Re-measure when conditions change: new lights, new airflow, a heat wave, a change in irrigation.
What This Means Day to Day
The point is not to chase a decimal. It is to stop trusting a single air number as if the plant felt it directly.
Measure your leaf offset a few times, learn your room’s habits, and treat your air-VPD target as a setting you adjust, not a law. When something feels off despite a “perfect” chart reading, leaf temperature is the first place the data usually hides.
If you want the underlying math without doing it by hand, the free VPD calculator will run both air and leaf VPD once you feed it a leaf temperature offset, so you can see how far your real target drifts from the chart.
Put a System Behind Your Numbers
Growgoyle is software that runs your grow, and VPD is one piece of that. Instead of reading a sensor, checking a chart, and guessing at the offset in your head, you get your environment tracked and your targets in one place so the numbers stay honest over a whole cycle. It works with the sensors you already run, so there is no new hardware to buy to get started.
METRC tracks your grow for the state. Growgoyle tracks it for you.
Run your rooms through the free VPD calculator to see air VPD and leaf VPD side by side. When you are ready to stop managing it in spreadsheets, start your free 30-day trial and let the software carry the tracking.
Every grow room I have ever run had a chart taped to the wall next to the door. Not because I could not pull the number up on my phone, but because a chart on the wall gets looked at. A number in an app gets ignored until something goes wrong.
This is that chart. It works in both Fahrenheit and Celsius, it covers every stage from clone to late flower, and it is free. Print it, tape it up, and use it as your quick gut check every time you walk the room.
What a VPD Chart Actually Shows You
VPD stands for vapor pressure deficit. In plain terms, it is the difference between how much moisture the air is holding and how much it could hold at that temperature. It is the real driver behind how fast your plants pull water and transpire.
A VPD chart takes two things you can read off any controller, air temperature and relative humidity, and turns them into a single VPD value measured in kilopascals (kPa). Instead of guessing whether 78F and 60% humidity is good or bad, you find the row and column and read the band.
The whole point is that temperature and humidity mean nothing on their own. 65% humidity is fine in veg and a problem in late flower. The chart bakes that relationship in so you do not have to do the math in your head.
How to Read the Axes
The chart is a grid. One axis is air temperature, the other is relative humidity.
Find your current temperature along one edge.
Find your current relative humidity along the other.
The cell where they meet is your VPD, shown in kPa and colored by band.
That is it. Two readings, one answer. The color tells you if you are sitting where you want to be.
One habit worth building: read the chart at the same points every day, not just when you happen to glance at the controller. First thing when lights come on, and again a few hours in, tells you more than a single random check. Rooms drift on a schedule, and the chart only helps if you catch the drift.
What the Color Bands Mean
Most VPD charts, including this one, use three bands.
Too dry (high VPD): the air is pulling water out of the plant faster than the roots can replace it. You will see taco-ing, curled leaf edges, and stress in flower.
Ideal (target band): transpiration and CO2 uptake are in a healthy range for that stage. This is where you want to live.
Too humid (low VPD): the plant cannot transpire fast enough. Growth slows and, more importantly, you are building the wet, stagnant conditions that botrytis and powdery mildew love.
The ideal band is not one fixed number. It shifts by growth stage, which is the part most charts get lazy about.
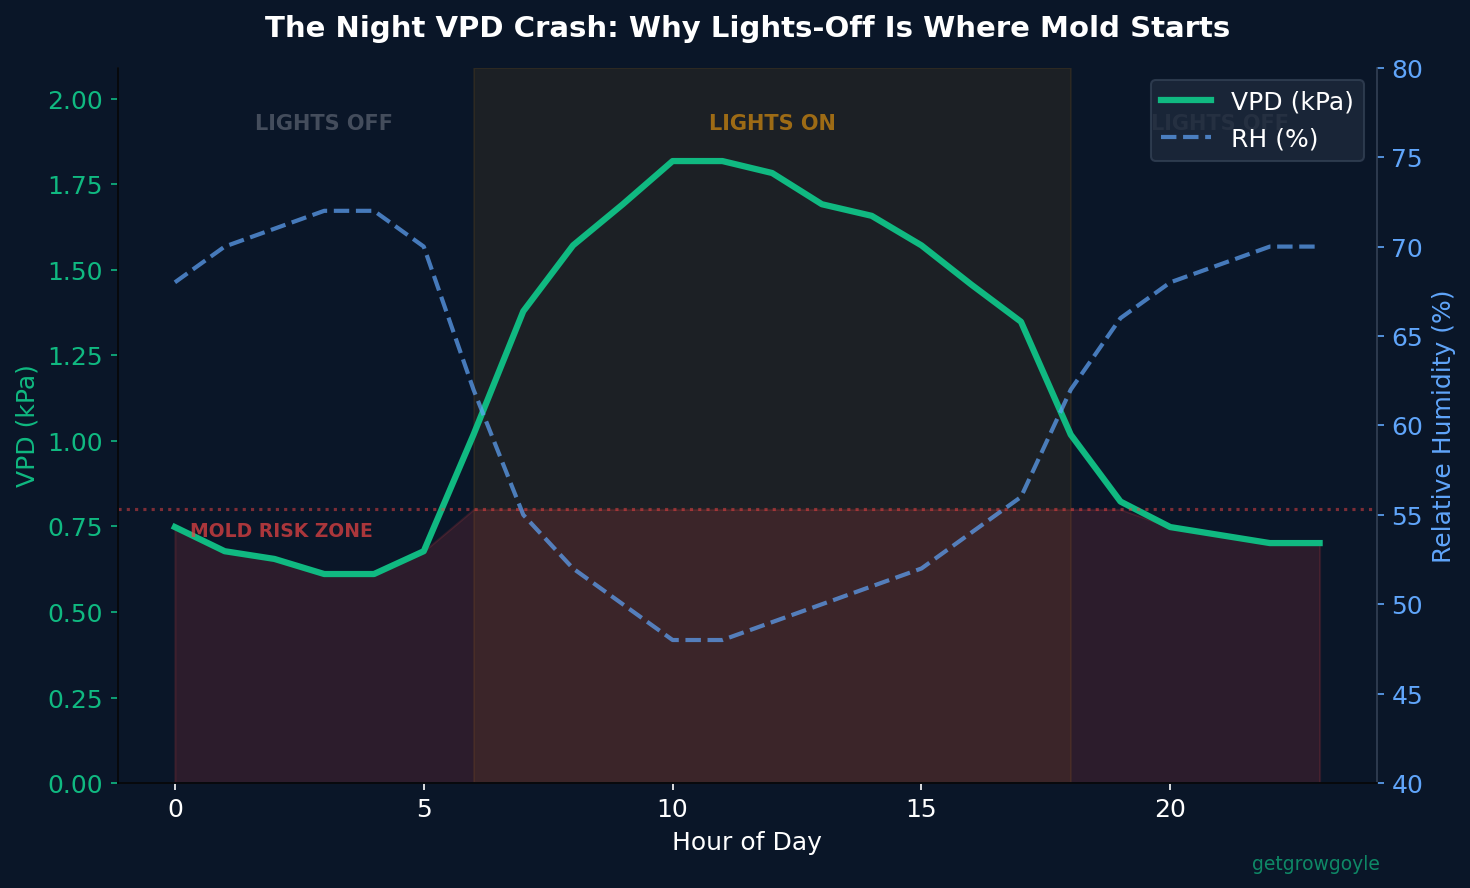
A quick note on the humid side, since that is where most rooms get burned. Sitting in the too-humid band for an afternoon will not hurt you. Sitting there every night while lights are off, week after week in flower, is how disease pressure builds quietly until you find it on a bud. Watch the band during your dark period, not just the middle of the day.
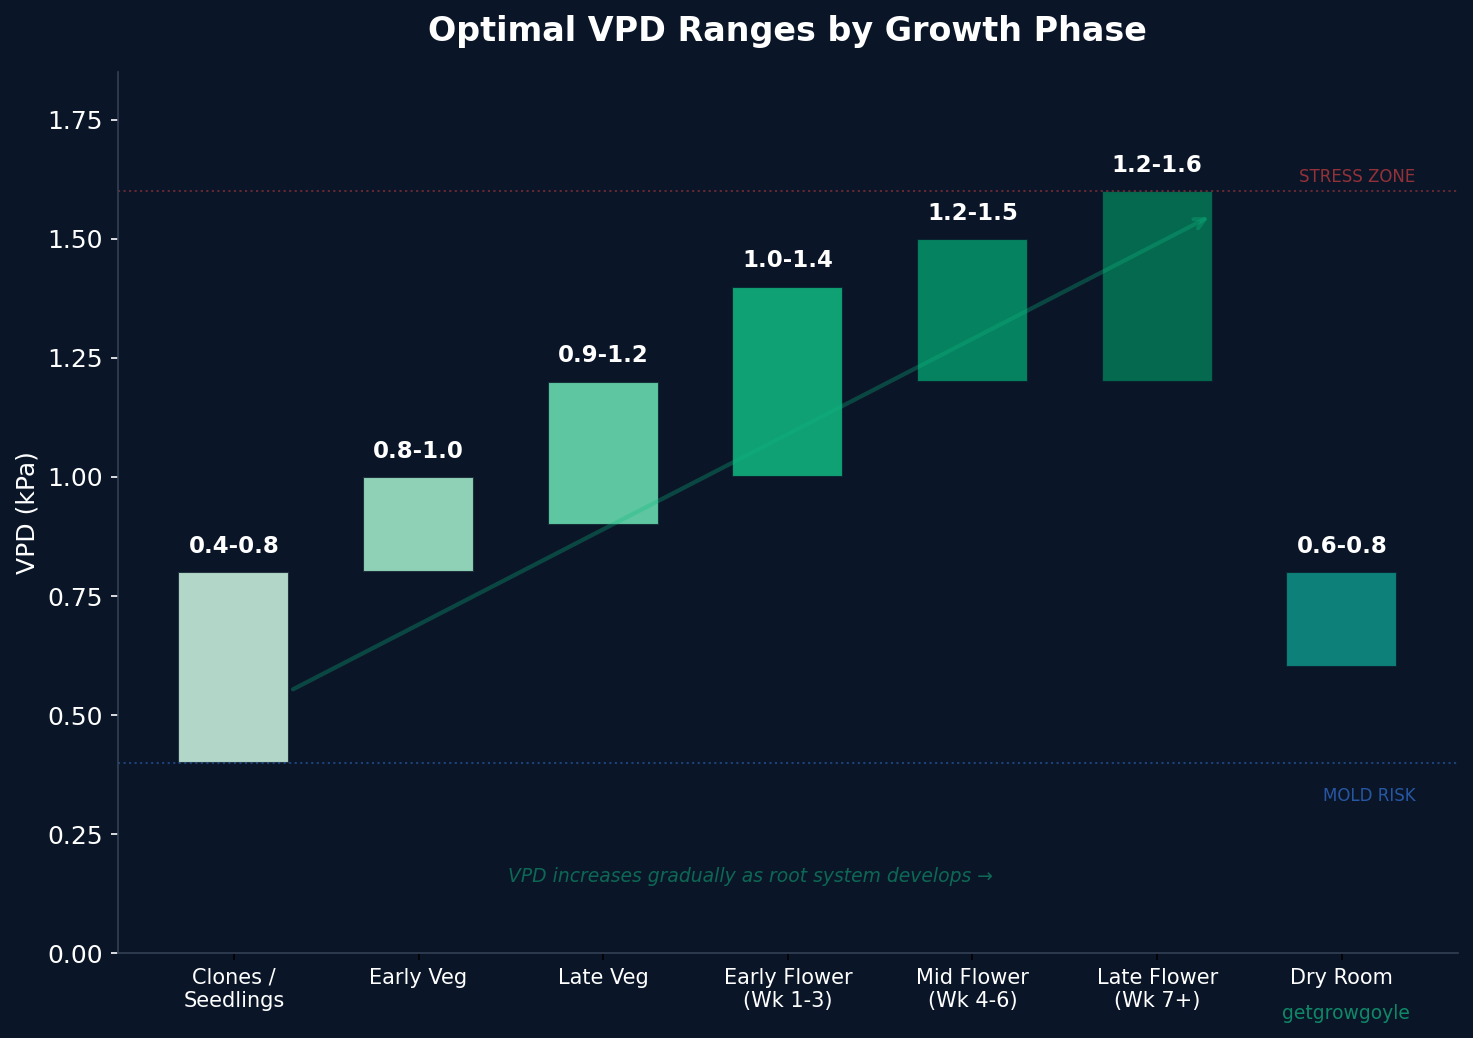
Target VPD Ranges by Stage
Younger plants have small root systems and undeveloped stomata, so they want a gentler deficit. As the plant matures you push VPD up to drive transpiration and keep humidity in check during flower.
Stage
Target VPD (kPa)
Clones / seedlings
0.4 to 0.8
Early veg
0.8 to 1.0
Late veg
1.0 to 1.2
Early flower
1.0 to 1.3
Late flower
1.2 to 1.6
These ranges line up with the controlled-environment research on cannabis and other high-value crops. Work by Zheng and colleagues at the University of Guelph on cannabis production environments, along with the broader greenhouse literature summarized by Llewellyn, supports keeping younger tissue in a lower deficit and raising it through the cycle. Rodriguez-Morrison’s light and environment studies reinforce how tightly climate and plant response are linked.
Treat the ranges as a starting point, not gospel. Your genetics, airflow, and light intensity all nudge the sweet spot. The chart gets you close, then your own data dials it in.
The One Thing a Printed Chart Cannot Do
Here is the honest limitation. A static chart calculates air VPD, which uses air temperature. The number that actually matters to the plant is leaf VPD, which uses leaf temperature.
Under strong LEDs, leaf temperature can run a couple of degrees cooler or warmer than the surrounding air depending on transpiration and airflow. That gap shifts the real target away from what the wall chart says. When the data shows plants underperforming inside a “correct” air-VPD range, leaf temperature is usually the missing piece.
A wall chart is still worth having as your fast reference. Just know that it is the air-VPD version, and leaf VPD is the more precise measurement once you are ready to chase it. That is a whole topic on its own.
Download the Printable Chart
The free PDF includes both a Fahrenheit chart and a Celsius chart, stage bands marked, sized to print clean on standard paper. Tape it inside the door where you do your walk-throughs.
A printed chart is great for a gut check. When you want the exact VPD for your current readings without hunting across a grid, the free VPD calculator gives you the number instantly and shows which stage band you land in.
Software That Runs Your Grow
The chart tells you where you should be. Growgoyle is the software that runs your grow and tells you where you actually are, batch by batch, without you logging it by hand.
HLVd in Cannabis: The Silent Yield Killer Most Commercial Growers Haven’t Tested For
You had a bad run. Yields came in light. Trichome coverage looked thin. THC tested lower than expected for that cultivar. You blamed the environment, maybe the nutrients, maybe just bad luck with the pheno.
But what if it wasn’t any of those things?
Hop latent viroid (HLVd) doesn’t kill your plants. It doesn’t cause obvious lesions or dramatic wilting. It sits inside your plant tissue, replicating quietly, and shaves 20-40% off your yield while the plants look “fine.” That’s what makes it so dangerous in a commercial cannabis facility. You can run HLVd-positive rooms for years and never know it, because infected plants still grow, still flower, still produce. Just less.
And if you haven’t tested, you’re guessing. Every adjustment you make to environment, nutrients, or light intensity is built on the assumption that your genetics are healthy. If that assumption is wrong, you’re chasing ghosts.
The 30% You Don’t Know You’re Losing
HLVd was first identified in cannabis by Warren in 2019, though it had been known in hops for decades. Since then, testing data has painted a grim picture. Dark Heart Nursery’s large-scale screening found HLVd in roughly 30-40% of cannabis samples from commercial facilities (Bektas et al.). That’s not a niche problem affecting a handful of unlucky operators. That’s an industry-wide crisis hiding in plain sight.
Here’s what makes HLVd so hard to catch without testing: the symptoms mimic a dozen other problems. Reduced trichome density? Could be environment. Looser bud structure? Maybe the pheno. Lower THC? Bad dry, bad cure, who knows. The data from an HLVd-positive room doesn’t scream “disease.” It whispers “mediocre run.”
Most growers I’ve talked to who eventually tested positive said the same thing. They’d been compensating for months or years. Adjusting feeds, tweaking VPD, swapping out cultivars, trying different nutrient lines, and never finding the real problem. The data kept showing underperformance, but nothing pointed to a single cause. That’s the hallmark of viroid infection. It degrades performance across the board without giving you a clear signal.
That’s the profile of HLVd in cannabis. Not catastrophic failure. Just a persistent drag on everything you’re trying to do. And that drag compounds over time, across rooms, across harvest cycles.
What HLVd Actually Looks Like in Flower
If you know what to look for, there are visual signs. But they’re subtle enough that you’ll miss them without comparing side by side against a known-clean version of the same cultivar.
Trichome coverage drops noticeably. Buds that should be caked look sparse under a loupe or microscope. This is one of the more reliable visual indicators, but you need a clean reference point to see the difference. Without that comparison, you’ll just think the cultivar “isn’t what it used to be.”
Bud structure loosens. Flowers that should stack tight come out airy and underdeveloped. They lack the density you’d expect from a cultivar you’ve grown before. Again, easy to blame on environment or light intensity. Hard to pin on a viroid you don’t know is there.
THC percentages come in 3-5% below the cultivar’s known potential. If your Gelato should test at 28% and you’re consistently hitting 23-24%, that gap might not be your environment. It might be HLVd quietly suppressing cannabinoid production.
Stunted growth shows up in some infected plants, but not all. Shorter internodes, smaller fan leaves, and reduced vigor during veg can indicate infection. But many HLVd-positive plants look completely normal during vegetative growth and only reveal problems in flower, if they reveal them at all.
The brutal truth is that many infected plants look “normal enough.” Normal enough to harvest. Normal enough to not trigger alarm bells. Normal enough to keep running cycle after cycle while the viroid spreads through your facility via contaminated tools, shared scissors, and infected clones moving between rooms.
The Math: What HLVd Is Actually Costing You
This is where most commercial growers stop and pay attention. Forget the biology for a second. Look at the numbers.
Say you’re running 50 lights in a flower room pulling 3 lbs per light, which is a solid commercial benchmark. That’s 150 lbs per harvest cycle.
A 30% yield reduction from HLVd drops that to 105 lbs. You just lost 45 lbs.
At an estimated $500-600/lb wholesale (Michigan market), that’s $22,500 to $27,000 gone. Per harvest. Per room.
Run that room four times a year and you’re looking at $90,000 to $108,000 in annual yield loss from a single flower room. If you’re running multiple rooms, multiply accordingly. A three-room facility could be leaving $270,000 to $324,000 on the table every year.
And that’s just the yield calculation. It doesn’t account for the lower THC percentages pushing your product into a cheaper pricing tier, or the labor and inputs you spent growing plants that underperformed. You paid the same electric bill, the same nutrient costs, the same labor hours to produce 30% less sellable product. Your cost per pound goes up even if your expenses stay flat.
Now compare that to the cost of testing.
PCR testing for HLVd runs $15-25 per sample. For a 200-plant room, individual testing would cost $3,000 to $5,000. That sounds steep until you compare it to losing $22,500+ every cycle. The testing pays for itself before you even finish the current harvest.
Why Most Commercial Growers Haven’t Tested
If the math is this clear, why isn’t everyone testing for HLVd? A few reasons, and none of them are good ones.
Cost perception. $3,000-5,000 to test a single room feels like a big line item, especially when margins are already compressed. Most operators look at that number in isolation, not compared to the potential loss. The hidden costs of running a facility are already stacking up, and adding another expense is a hard sell internally. But this isn’t an expense. It’s a diagnostic. You’d pay to fix a broken HVAC unit. This is the same category.
No visible crisis. HLVd doesn’t create an emergency. Plants aren’t dying. There’s no powdery mildew covering your canopy, no spider mite webbing, no root rot turning things to mush. It’s easy to deprioritize testing for a problem you can’t see and aren’t sure you have. The absence of obvious symptoms is exactly what makes HLVd so costly.
Misattribution. When yields drop 20-30%, most growers look at environment first. Light intensity. VPD. Nutrient lockout. CO2 levels. Irrigation timing. These are all real variables, and chasing them can eat months of troubleshooting time before anyone considers a viroid that requires lab testing to confirm.
Lack of protocol. Many facilities don’t have a testing program because they’ve never built one. It’s not that they’ve decided testing isn’t worth it. They just haven’t figured out when to test, how to collect samples, and who to send them to. The logistics feel like one more thing to figure out in an already demanding operation.
A Testing Protocol That Works at Scale
You don’t have to test every plant individually. Here’s a protocol that balances thoroughness with budget reality for commercial cannabis operations.
Mother Plants: Test Quarterly
Your mothers are the source of every clone in your facility. If a mother is HLVd-positive, every cut from that plant carries the viroid into your production rooms. Test all mother plants every quarter. This is non-negotiable. It’s the single highest-ROI testing you can do, because one clean mother protects hundreds of downstream plants.
Incoming Clones: Test Before Entry
Every clone that enters your facility from an outside source gets tested before it touches your rooms. No exceptions. Quarantine incoming genetics for 2-4 weeks while you wait for PCR results. This is your firewall. One infected clone from a vendor can spread through your entire facility within a single production cycle.
In-Room Testing: Batch to Reduce Cost
For plants already in your facility, you can pool samples to cut costs dramatically. Batch testing combines leaf tissue from 5-10 plants into a single sample. If the batch tests positive, you retest individually to find the infected plants. If it tests negative, you’ve cleared 10 plants for the price of one test. This can cut your per-room testing costs by 80% or more.
Sample Method: Petiole Tissue
Use leaf petiole (the stem of the leaf) for tissue samples. The petiole carries higher viroid concentrations than leaf blade tissue, which means more reliable detection. It’s also easy to collect without damaging the plant. Your lab will have specific instructions for sample prep and shipping, but petiole samples are the industry standard for HLVd PCR testing.
Labs Worth Calling
Tumi Genomics, Dark Heart Nursery (they pioneered large-scale HLVd screening in cannabis), and FloraDNA all run reliable PCR testing for HLVd. Shop around on price and turnaround time, but don’t cut corners on lab quality. A false negative is worse than no test at all, because it gives you confidence in genetics that are actually compromised.
Prevention: Keeping HLVd Out of Your Facility
Testing tells you where you stand. Prevention keeps you clean. Both matter, and neither replaces the other.
Tool Sanitation
HLVd spreads through sap. Every time you cut a clone, prune a plant, or defoliate, you risk transferring the viroid from one plant to another on your blade. Dedicate tools per room. If that’s not practical, sanitize between rooms (and ideally between plants) with a 10% bleach solution. Let tools soak for at least 30 seconds before using them on the next plant or in the next room.
Alcohol wipes are not sufficient for viroid deactivation. This is a common mistake. Isopropyl alcohol kills bacteria and some fungi, but HLVd is a viroid (a small, circular RNA molecule), not a living organism. It requires stronger oxidizing agents like bleach or commercial viroid disinfectants to neutralize.
Clone Sourcing and Documentation
This is where it gets uncomfortable. You need to ask your clone vendors hard questions, and some of them won’t like it.
What does “clean” mean to them? There’s a big difference between “we’ve never had HLVd” (meaningless without testing data) and “PCR-tested negative on [date]” (meaningful and verifiable). Ask for documentation. If a vendor can’t provide PCR test results, that’s a red flag you shouldn’t ignore.
Tissue culture is the gold standard for clean starting material. The tissue culture process eliminates viroids, viruses, and other systemic pathogens that PCR testing can only detect, not remove. Tissue-cultured clones run $15-25 each, compared to $7-12 for traditional clones. The premium is real, but so is the confidence that comes with it.
If you’re running a facility with 200+ plants per room, the difference between $7 and $20 per clone adds up to a few thousand dollars per cycle. Compare that to the $22,500+ per harvest you stand to lose from infected genetics. The tissue culture premium is cheap insurance against a very expensive problem.
Quarantine Protocol
New genetics should never go straight into your flower rooms or mother stock. Set up a quarantine area, physically separated from your main cultivation space if possible. Hold new clones for 2-4 weeks while PCR results come back. Only plants that test negative move into production.
This feels slow. It is slow. But one HLVd-positive clone introduced into your mother room can contaminate your entire genetic library through tool contact during routine cloning.
The Bigger Picture: Stacked Yield Drag
HLVd doesn’t exist in a vacuum. Commercial facilities deal with overlapping pressures: russet mites, powdery mildew, environmental inconsistencies, root zone problems, and more. Each one chips away at your potential yield.
When you stack HLVd yield loss (20-40%) on top of russet damage, environmental drift, and other issues, total yield drag can hit 25-30% or higher. That means a facility capable of producing 150 lbs per room is only pulling 105-115 lbs, and the team can’t pinpoint why because no single factor explains the whole gap.
Clean genetics are the foundation. Everything else you do, your environment dialing, your nutrient programs, your crop steering and KPI tracking, all of it is built on top of that foundation. If the genetics are compromised by HLVd, you’re spending more time, money, and effort to get less from every other input.
Getting your baseline right means knowing your genetics are clean. From there, the data you collect on environment and yield actually tells you something real. Without that baseline, every metric you track is filtered through noise you can’t account for.
What To Do This Week
You don’t need a perfect plan. You need a starting point. Here are four things you can do right now.
Test your mothers. If you do nothing else, test every mother plant in your facility. This week. PCR test, petiole tissue, sent to a reputable lab. If your mothers are clean, you have a foundation to build on. If they’re not, you need to know before you take another round of clones.
Stop incoming clones from entering without a quarantine. Set up even a basic quarantine area, a separate tent or room, and hold new genetics until test results come back. No more bringing outside clones straight into production.
Sanitize your tools. 10% bleach, 30-second soak, between rooms at minimum. Make it part of the SOP today, not next week.
Run the numbers for your facility. Calculate what a 30% yield reduction actually costs you per harvest, per room, per year. Compare that to the cost of testing and tissue-cultured clones. The math will make the decision for you.
HLVd isn’t going away. The facilities that test, prevent, and maintain clean genetics will outperform the ones that don’t. Not because of some secret advantage, but because they stopped losing 20-40% of their crop to a problem they didn’t know they had.
Crop Steering Without Proprietary Sensors: A Substrate-by-Substrate Guide for Commercial Cannabis
Every equipment vendor in the cannabis space wants you to believe that crop steering requires their hardware. Drop $10K on their sensor platform, subscribe to their dashboard, and suddenly you’re “steering” your crop. Miss a payment and you’re flying blind again.
That’s a sales pitch, not agronomy.
Crop steering is a set of principles. It works with whatever sensors you already own. The crop steering substrate you grow in matters far more than the brand name on your moisture probe. This guide breaks down cannabis crop steering protocols by substrate type, so you can build a system that actually fits your operation.
What Crop Steering Actually Is
Strip away the marketing and crop steering is simple: you manipulate irrigation timing, volume, and frequency to push plants toward either a vegetative or generative response. Vegetative steering encourages growth, stretch, and canopy development. Generative steering pushes energy toward flowering, fruit set, and resin production.
It’s controlled stress. That’s it.
The concept comes from commercial greenhouse production (tomatoes, peppers, cucumbers) where growers have used irrigation strategy to steer crops for decades. Cannabis borrowed the playbook. The science backs it up. Llewellyn et al. demonstrated that irrigation frequency and volume directly affect cannabis yield and cannabinoid concentration, with diminishing returns past certain thresholds (Llewellyn et al., 2024, Frontiers in Plant Science). Zheng’s research program at the University of Guelph has confirmed that substrate moisture management is one of the most controllable levers a grower has for influencing final product quality (Zheng, University of Guelph Cannabis Research).
None of that research was conducted on a proprietary sensor platform. It was conducted with calibrated moisture meters, scales, and careful observation. The tools matter less than the understanding.
Why Substrate Matters More Than Sensors
Here’s where most crop steering guides fall apart: they give you a single dry-back target and call it universal. “Dry back to 40% overnight for generative steering.” Cool. 40% of what? In what medium?
A rockwool slab at 40% water content behaves completely differently than coco at 40%. The air-to-water ratio, the EC dynamics, the buffering capacity: all different. A rockwool dry-back schedule applied to coco will wreck your crop. The roots hit stress thresholds at different moisture levels depending on the substrate’s physical properties.
Think about it this way. Rockwool has a very uniform pore structure. Water distributes evenly, drains predictably, and rewets consistently. Coco has irregular fiber structure with higher natural air porosity. It drains faster, holds less water at the same volume, and interacts chemically with your nutrient solution through cation exchange. Soil is a whole different animal, with microbial activity, organic matter decomposition, and moisture gradients that change over the life of the crop.
Your crop steering substrate choice determines your entire irrigation strategy cannabis growers need to build around. If you’re running rockwool, coco, or soil, you’re working with three fundamentally different water-holding profiles. Your sensors tell you what’s happening. Your substrate determines what those numbers mean.
This is why a $300 moisture meter and actual substrate knowledge will outperform a $10K sensor system operated by someone who doesn’t understand their medium.
Vegetative Steering by Substrate
The goal of vegetative steering is to keep plants comfortable. You want consistent moisture, moderate EC, and minimal stress. The plant’s job during veg is to build the frame that supports flower weight later. Let it work.
Rockwool: Keep It Wet, Keep It Steady
Rockwool is the most responsive substrate for crop steering because of its uniform pore structure. That’s its strength and its risk. It responds fast, which means mistakes show up fast too.
For vegetative steering in crop steering rockwool cannabis grows, maintain water content between 60-70%. Irrigate with frequent, small shots throughout the light period. The goal is to keep the slab consistently saturated without waterlogging. Each shot should be small enough that runoff stays under 10-15%. You’re maintaining, not flushing.
EC management matters here. Keep feed EC moderate (typically 2.0-2.8 depending on cultivar and water quality). In rockwool, EC can spike quickly during dry-backs because the remaining water concentrates salts. During veg, you don’t want that. You want steady, available nutrition without osmotic stress.
Start your first irrigation 1-2 hours after lights on. End your last irrigation 1-2 hours before lights off. This gives the slab a gentle overnight dry-back (maybe 5-10%) without triggering a generative response. The slab should still read 55-60% at lights on the next morning. If it’s dropping below 50% overnight during veg, you need to push more volume during the day or add a late irrigation event.
Monitor your runoff EC and pH daily. If runoff EC is climbing more than 1.0 above your feed EC, you’re not pushing enough volume through. Increase shot size or add an irrigation event. For more on tracking measurable KPIs in your grow room, a clear framework helps you separate signal from noise.
Coco: Faster Drainage, Faster Feedback
Coco has a higher air-to-water ratio than rockwool at the same moisture content. It drains faster. It dries faster. And EC builds faster because coco has cation exchange capacity, meaning it holds onto certain nutrients (especially calcium and magnesium) and releases others.
For vegetative steering in coco, your water content target is slightly lower than rockwool, around 55-65%. Irrigate to 10-20% drain-to-waste runoff each time. This runoff is critical in coco. It flushes accumulated salts and gives you a read on what’s happening in the root zone.
Feed EC in coco veg typically runs 1.8-2.5. Watch your runoff. If runoff EC is more than 1.5 above feed, you need more runoff volume or more frequent irrigation events. Coco will punish you for skipping runoff monitoring faster than rockwool will. A single missed day of runoff checks during a hot stretch can mean an EC spike that takes two days to flush out.
Irrigation frequency in coco veg should be moderate: enough to maintain consistent moisture, not so much that you’re waterlogging the medium. Depending on pot size and plant stage, this might be 4-8 events per light cycle. Smaller pots dry faster and need more frequent shots. A 1-gallon coco pot in week 4 of veg under 600W might need 6-8 irrigations. A 3-gallon pot under the same light might only need 4-5.
One thing to watch with crop steering coco: if you’re using buffered coco (and you should be), the initial calcium/magnesium charge will deplete over the first 2-3 weeks. Your cal-mag requirements will shift as the crop matures. This isn’t steering, it’s just coco management. But it will affect your data if you don’t account for it.
Soil and Soilless Mixes: The Long Buffer
Soil and peat-based soilless mixes are the least responsive substrates for cannabis crop steering. They hold more water, release it more slowly, and buffer EC changes over longer periods. This makes them more forgiving for beginners, but harder to steer precisely.
For vegetative steering in soil or soilless, maintain even moisture without saturation. Water when the top inch or two feels dry, or when your moisture meter reads in the lower third of your target range. These substrates don’t respond well to the rapid irrigation cycling that works in rockwool or coco. Changes take 24-48 hours to manifest instead of 4-8 hours.
EC management in soil is a different game entirely. The microbial activity and organic matter buffer nutrient availability in ways that a conductivity meter can’t fully capture. Focus on consistent feeding schedules and watch the plant’s response more than the numbers.
The honest truth: if you’re running soil or soilless at commercial scale and want precise crop steering, your substrate is working against you. Soil is great for many reasons. Rapid steering response isn’t one of them.
Generative Steering by Substrate
This is where crop steering gets interesting. Generative steering creates controlled stress that redirects the plant’s energy from vegetative growth into flowering, resin production, and fruit development. You’re telling the plant: “Conditions are changing. Time to reproduce.”
The primary tools are larger dry-backs, higher EC, and less frequent irrigations. But the targets vary dramatically by substrate.
Rockwool: Controlled Dry-Backs, Big Results
Generative steering in rockwool means allowing overnight dry-backs to 40-50% water content. This is a significant drop from the 60-70% vegetative target, and it creates real osmotic stress in the root zone as remaining water concentrates salts around the roots.
During the day, irrigate with larger, less frequent shots. Instead of 10 small irrigations, you might run 4-6 larger ones. Start your first irrigation later in the light cycle (2-3 hours after lights on) to extend the dry-back period. This extended dry period is the generative signal. The plant wakes up, roots are in a drier, higher-EC environment, and it gets the message.
Ramp your EC during generative steering. A common approach is to increase feed EC by 0.5-1.0 over the first two weeks of flower, then hold. Combined with dry-backs, the root zone EC spikes significantly overnight as water leaves and salts concentrate. This is the stress signal that triggers generative responses.
Rodriguez-Morrison et al. documented how environmental control variables, including root zone conditions, interact to determine final cannabis yield and quality (Rodriguez-Morrison et al., 2021, Frontiers in Plant Science). You can’t isolate irrigation from temperature or VPD. They work together. Generative steering with irrigation is most effective when your environment is also dialed in. A 5-degree temperature differential between day and night reinforces the generative signal your irrigation schedule is sending.
Coco: More Aggressive, More Risky
Coco allows more aggressive dry-backs than rockwool because of its higher air porosity. You can push dry-backs below 40% water content in coco and still recover, whereas rockwool at that level risks creating hydrophobic dry spots that never rewet properly.
But coco’s cation exchange capacity means salt accumulation during generative steering can spike harder and faster than in rockwool. If you’re ramping EC and extending dry-backs in coco, you need to monitor runoff EC religiously. A runoff EC of 2.0+ above feed is a warning sign. Above 3.0 and you’re risking root burn that will cost you yield in the final weeks when you need the plant healthy and finishing strong.
One approach that works: maintain your generative dry-back schedule but run a heavier flush irrigation as the first shot of the day. This clears overnight salt accumulation before the plant hits its highest transpiration period. Then resume normal generative shot sizes for the rest of the light cycle. You’re still getting the overnight dry-back signal, but you’re preventing the salt buildup that makes coco generative steering a gamble.
Crop steering coco requires more attention than rockwool during generative phases. The margin for error is narrower. If you’re running coco at scale, daily runoff monitoring isn’t optional. It’s the difference between a successful generative push and a room full of burned tips and locked-out roots.
Timing: When to Start Generative Steering
This is the part that trips people up. You don’t flip to generative steering the same day you flip to 12/12.
The plant needs the first 1-2 weeks of flower to stretch and set bud sites. If you slam generative steering on day one, you limit stretch and reduce the number of flowering sites. That means fewer, smaller flowers. The data consistently shows that growers who start generative steering too early leave yield on the table.
The standard approach is to begin generative steering in week 2-3 of flower. Start with mild dry-backs (drop overnight water content by 5-10% from your veg baseline) and work toward your full generative targets over 5-7 days. Don’t go from 65% overnight water content to 40% in one night. Ramp it. The plant needs time to adjust its root growth and transpiration rates.
The timing of your generative transition directly affects final plant structure. Earlier generative steering produces shorter, tighter plants with fewer but denser flowers. Later generative steering allows more stretch and more flower sites, but with potentially less density per site. There’s no universally “right” answer. It depends on your cultivar, your canopy management, and your yield targets.
Reading Your Plants vs. Reading Your Dashboard
Sensors tell you what’s happening in the substrate. Plants tell you what’s happening in the plant. You need both. And honestly, if you had to pick one, pick the plants.
Here are the physical signals that confirm whether your steering is working:
Internode spacing. Short internodes during flower mean your generative steering is working. Measure the distance between nodes on your main colas weekly. If nodes are still stretching after week 3, your dry-backs aren’t aggressive enough or your EC is too low. Compare across the room. Consistent internode length means your irrigation coverage is even. Uneven internodes often point to dry spots or uneven dripper flow rates, not a steering problem.
Leaf curl and taco-ing. Mild upward leaf curl during peak transpiration hours can indicate the plant is working harder to manage water loss. In moderate amounts, this is a sign of effective generative stress. If leaves are canoeing hard and not recovering by lights off, you’ve pushed too far. Back off the dry-back by 5% and reassess in 48 hours.
Stem diameter. A thickening stem during flower is a good sign. The plant is reinforcing its structure to support fruit weight. If stems stay thin and stretchy past week 3, the plant is still in vegetative mode despite your irrigation schedule. Check your actual substrate water content readings. The schedule on paper might not match reality in the slab.
Praying leaves. Leaves angled upward toward the light (not curled, angled) during early light hours typically indicate a happy, well-hydrated plant. This is what you want to see during veg steering. During generative steering, some of this “prayer” posture will diminish as the plant deals with controlled stress, and that’s expected.
Color changes. Rapid yellowing or tip burn during generative steering usually means your EC has spiked past the plant’s tolerance. The data showed a problem, not you. Pull back on EC or increase flush volume. Tip burn that appears on new growth is an active EC issue. Yellowing on lower leaves during late flower is normal senescence and not related to your steering.
The plant tells you if your steering is working before the sensors do. A grower who walks their room twice a day and knows what to look for will outperform someone staring at a dashboard from their office. Use both, but trust the plants first.
Building Your Own Crop Steering Protocol
You don’t need a $10K sensor system to crop steer. You need a $300 moisture meter, a notebook, and discipline. Here’s how to start.
Step 1: Baseline your current irrigation. Before you change anything, record your current irrigation schedule, water content readings, and runoff EC/pH for one full week. You need to know where you are before you can steer anywhere. If you don’t have baseline data, everything you do next is guessing.
Step 2: Pick one variable. Start with irrigation frequency. Don’t change volume, EC, and timing all at once. That’s not crop steering, that’s chaos. Reduce your irrigation frequency by one event per day and watch what happens to your water content readings and plant response over 3-5 days.
Step 3: Track the response. Write it down. Not in your head. In a log. Date, irrigation count, shot volume, substrate water content at lights on and lights off, runoff EC, and a brief note on plant appearance. This data is what turns guessing into a protocol. If you can’t tell someone else exactly what you changed and what happened, you haven’t tracked it well enough.
Step 4: Adjust one thing at a time. If reducing frequency dropped your overnight water content by 10% and the plants responded well (shorter internodes, no stress signs), hold that schedule for the rest of that growth phase. If the plants showed stress, add an event back and try a smaller adjustment. Small moves, documented results.
Step 5: Build your substrate profile. After 2-3 cycles of tracking, you’ll know how your specific substrate, in your specific environment, responds to irrigation changes. That’s your crop steering protocol. It’s yours. It fits your room, your water, your cultivars. No one can sell it to you because no one else has your data.
This process works whether you’re running $50 analog moisture meters or $5K wireless probes. The sensor quality affects your data resolution. It doesn’t affect the underlying principles. A grower with a cheap meter and good notes will build a better protocol than a grower with expensive sensors and no documentation.
Stop Renting Your Agronomy
The best crop steering protocol is the one you build yourself, from your own data, in your own rooms. Proprietary platforms can help, but they shouldn’t be the foundation. When the subscription lapses or the vendor pivots, your protocol needs to survive.
How Tight Is Your Equipment Control? The Hidden Cost of Temperature Swings in Commercial Flower Rooms
You check your controller. It reads 78°F. Everything looks fine.
But that 78°F is a snapshot. Over the last 24 hours, your room told a different story. Your AC cycled on and off hundreds of times. Each cycle pushed the room through a 4-8°F swing. Your lights cut at midnight and the temperature crashed 10°F in 10 minutes. Your dehumidifier spent 20 minutes catching up while relative humidity spiked into the danger zone. And then the whole thing repeated the next night.
None of this shows up when you glance at a controller screen. But your plants felt every minute of it.
Most commercial growers have their setpoints dialed. The real question is whether their equipment can actually hold those setpoints. The gap between what you set and what your room actually does is where yield, potency, and terpenes quietly disappear.
What’s Actually Happening in Your Room
There are three mechanical realities in almost every commercial flower room that create temperature instability. None of them are operator errors. They’re equipment limitations.
1. AC Deadband Swings During the Day
Every air conditioning system has a deadband: the temperature range around your setpoint where the compressor doesn’t engage. A standard controller might have a 4°F (2.2°C) deadband. That means your “78°F room” is actually cycling between 74°F and 82°F (23.3-27.8°C) all day long. The compressor kicks on at 82, drives the room down to 74, shuts off, and the room drifts back up.
That’s not a setpoint. It’s an average. And the plants don’t experience an average. They experience the swings.
2. The Lights-Off Crash
This is the single biggest environmental event in your room every 24 hours, and most facilities handle it poorly. When LEDs cut (or dim to off), the room loses its primary heat source instantly. Temperature drops 8-12°F (4.4-6.7°C) in minutes.
Here’s the cascade that follows:
Cooler air holds less moisture. Relative humidity spikes 15-20% almost immediately.
The dehumidifier, which was sized for steady-state conditions, takes 15-20 minutes to bring humidity back in range.
During that window, leaf surfaces cool faster than the surrounding air. Condensation forms on flowers. This is the #1 infection window for powdery mildew and botrytis in commercial flower rooms.
Every night. Every room. Unless you’ve specifically engineered the transition.
3. Dehumidifier Heat Rejection
Refrigerant-based dehumidifiers work by cooling air below its dew point, condensing water out, and then reheating the air before returning it to the room. That reheat cycle dumps heat back into the space. In a sealed flower room with high transpiration rates, the dehu is running hard, and that heat adds up.
The result: your night temperature slowly creeps up over the dark period as dehu heat rejection accumulates. Your intended 70°F (21°C) night temp might settle at 74-75°F (23.3-23.9°C) by the end of the dark period. Your DIF (day-night temperature differential) shrinks without you realizing it.
Why This Matters: What Temperature Instability Does to Your Plants
This isn’t theoretical. Peer-reviewed research has measured the effects of temperature swings on cannabis flower production.
DIF and Cannabinoid Production
DIF is the intentional temperature difference between day and night. It’s one of the most important environmental variables in flower, and most growers don’t manage it precisely because their equipment doesn’t let them.
A 2023 study by Bok et al., published in Agronomy, tested five different day/night temperature combinations in indoor cannabis, all averaging 24°C (75°F):
DIF
Day Temp
Night Temp
Flower Biomass
Cannabinoid Yield
-12°C / -22°F
18°C / 64°F
30°C / 86°F
Worst (4.7x less)
Lowest
-6°C / -11°F
21°C / 70°F
27°C / 81°F
Poor
Low
0°C / 0°F
24°C / 75°F
24°C / 75°F
Good
Good
+6°C / +11°F
27°C / 81°F
21°C / 70°F
Good
Highest
+12°C / +22°F
30°C / 86°F
18°C / 64°F
Moderate
Moderate
The sweet spot was a +6°C (+11°F) positive DIF: 27°C (81°F) days and 21°C (70°F) nights. Negative DIF (warmer nights than days) produced 4.7 times less flower biomass at its worst.
This is critical because uncontrolled equipment behavior actively undermines your DIF strategy. If your AC deadband swings the room 8°F during the day, you’re cycling through multiple effective DIF states every few hours. If your lights-off crash overshoots the target night temp and then dehu heat rejection pushes it back up, your actual DIF is never what you set it to be.
DIF is your friend. Uncontrolled swings are not. The goal isn’t a flat-line temperature. It’s a controlled step-down from day to night, held steady at each setpoint.
High Temperature Spikes and Cannabinoids
A 2025 study by Holweg et al. in Environmental and Experimental Botany compared cannabis grown at 25/21°C (77/70°F) versus 31/27°C (88/81°F). The higher temperature treatment reduced total cannabinoid concentrations and caused abnormal inflorescence clusters that disrupted normal flower maturation. The cannabinoid reduction was consistent across both cultivars tested.
Every time an AC deadband lets your room spike to 84-86°F (29-30°C), you’re temporarily entering the zone where cannabinoid production gets suppressed. One spike doesn’t kill a crop. But hundreds of spikes across an 8-week flower cycle add up.
Terpene Volatilization
Terpenes are volatile organic compounds. “Volatile” means they evaporate. They evaporate faster at higher temperatures. A 2024 study in the Journal of Fluid Flow, Heat and Mass Transfer measured significant increases in terpene evaporation rates between 30-50°C (86-122°F).
This means temperature spikes don’t just stress the plant. They’re actively boiling off terpenes that are already in the flower. Every swing above your target is a small terpene loss event. Over 56 days of flower, those losses accumulate into measurably lower terp profiles at harvest.
VPD Chaos and Stomatal Disruption
Temperature and humidity are mathematically linked through VPD (vapor pressure deficit), the metric that drives plant transpiration and nutrient uptake. When temperature swings, VPD swings with it.
An 8°F (4.4°C) temperature oscillation means your “1.3 kPa VPD” is actually bouncing between roughly 1.0 and 1.6 kPa throughout the day. Stomata respond to these changes within minutes (Nievola et al., 2017, Temperature). They’re opening and closing repeatedly instead of holding a steady transpiration rate.
The downstream effects: nutrient uptake becomes inconsistent, calcium and magnesium delivery fluctuates, and the plant diverts energy to managing water stress instead of building flowers. None of this shows up as a dramatic problem. It shows up as slightly lower yields, slightly less density, slightly more tip burn. The kind of results that get chalked up to genetics or a “weird run.”
Oxidative Stress from Rapid Changes
Temperature fluctuations trigger reactive oxygen species (ROS) production in chloroplasts and mitochondria. The plant responds by building antioxidant defense compounds. That biosynthetic energy has to come from somewhere. It comes from growth and flower production.
A steady 78°F is metabolically cheap for the plant. A room that cycles between 74°F and 82°F six times a day is metabolically expensive, even though the average is the same 78°F. The plant is spending resources managing stress that could have gone into bud weight.
Solutions: Tightening the Hold
The good news: every one of these problems has a practical fix. Some cost nothing. Others require equipment upgrades. All of them pay for themselves in yield.
Smooth the Lights-Off Transition
Add supplemental heat at lights-off. A simple radiant or convection heater on a timer, set to run for 20-30 minutes after lights cut, stretches the temperature drop from a 10-minute crash to a 30-minute glide. This gives your HVAC and dehumidifier time to adjust to the new load profile instead of scrambling to catch up. The humidity spike gets smaller because the air stays warmer longer, and VPD transitions smoothly instead of crashing.
Dim LEDs to off instead of cutting them. If your fixtures support dimming (most commercial LEDs do), program a 15-30 minute ramp-down at the end of the light cycle. The thermal load reduces gradually, which means no sudden temperature cliff for the HVAC to chase. This is free if your lights support it. Check your controller manual.
Upgrade Your Controller
The single biggest improvement most commercial rooms can make is moving from a basic thermostat or timer-based controller to one with adjustable deadbands and separate day/night programs.
Controller
Deadband Control
Day/Night Programs
Price Range
TrolMaster HCS-2 Hydro-X Pro
Adjustable per parameter
Yes
$500-700
TrolMaster HCS-3 Hydro-X Plus
Adjustable + setpoint offset
Yes
$700-900
Agrowtek GC-Pro
Fully customizable logic
Yes, multi-zone
$1,000-2,500
Link4 iPonic 624
Dual-zone independent
Yes
$1,500+
The TrolMaster HCS-2 is probably the most common upgrade path for mid-size commercial rooms. It lets you set deadband per device module, program completely different control profiles for day and night, and coordinate HVAC with dehumidification so they’re not fighting each other.
The key feature to look for in any controller: separate day/night control programs with independent deadbands and response speeds. The lights-off transition is a fundamentally different HVAC load than steady-state daytime. Your controller should treat them as two different jobs.
Right-Size Your Dehumidification
Size for the spike, not the average. Most facilities size their dehumidifiers based on steady-state transpiration during lights-on. But the moment that costs you product quality is the 15-20 minute humidity spike after lights-off. If your dehu capacity is sized for that peak demand, the recovery window shrinks from 20 minutes to 5. That’s the difference between a condensation event on every flower surface and a smooth transition.
Decouple dehumidification from cooling. If your mini-split is doing double duty as your dehumidifier (overcooling the air to condense moisture), every humidity spike drives temperature below your target. You end up with unstable temperature AND unstable humidity because one system is trying to manage both. Standalone dehumidification units let temperature and humidity be controlled independently.
Consider Variable Speed Compressors
An on/off air conditioner with a 4°F deadband produces a 4°F swing. That’s not a flaw. That’s how on/off control works. A variable speed (inverter-driven) compressor modulates its output continuously, holding the room within 1-2°F (0.5-1°C) of the setpoint. The deadband problem goes away because there is no deadband.
Variable speed systems cost more upfront. They also use less energy at partial load because they’re not constantly cycling a compressor on and off. For a commercial flower room where environmental consistency directly affects revenue, the payback period is usually measured in harvests, not years.
Stagger Lights-Off Across Rooms
If you’re running multiple flower rooms, don’t schedule lights-off at the same time in every room. When all rooms dump their heat load simultaneously, the facility’s HVAC system is suddenly managing multiple transition events at once. Staggering lights-off by 30-60 minutes per room spreads the load and lets each room’s transition settle before the next one starts.
Measure It or You’re Guessing
You can implement every solution on this list and still not know if it’s working unless you’re measuring the actual hold over time. A controller shows you a setpoint. Your plants experience the variance.
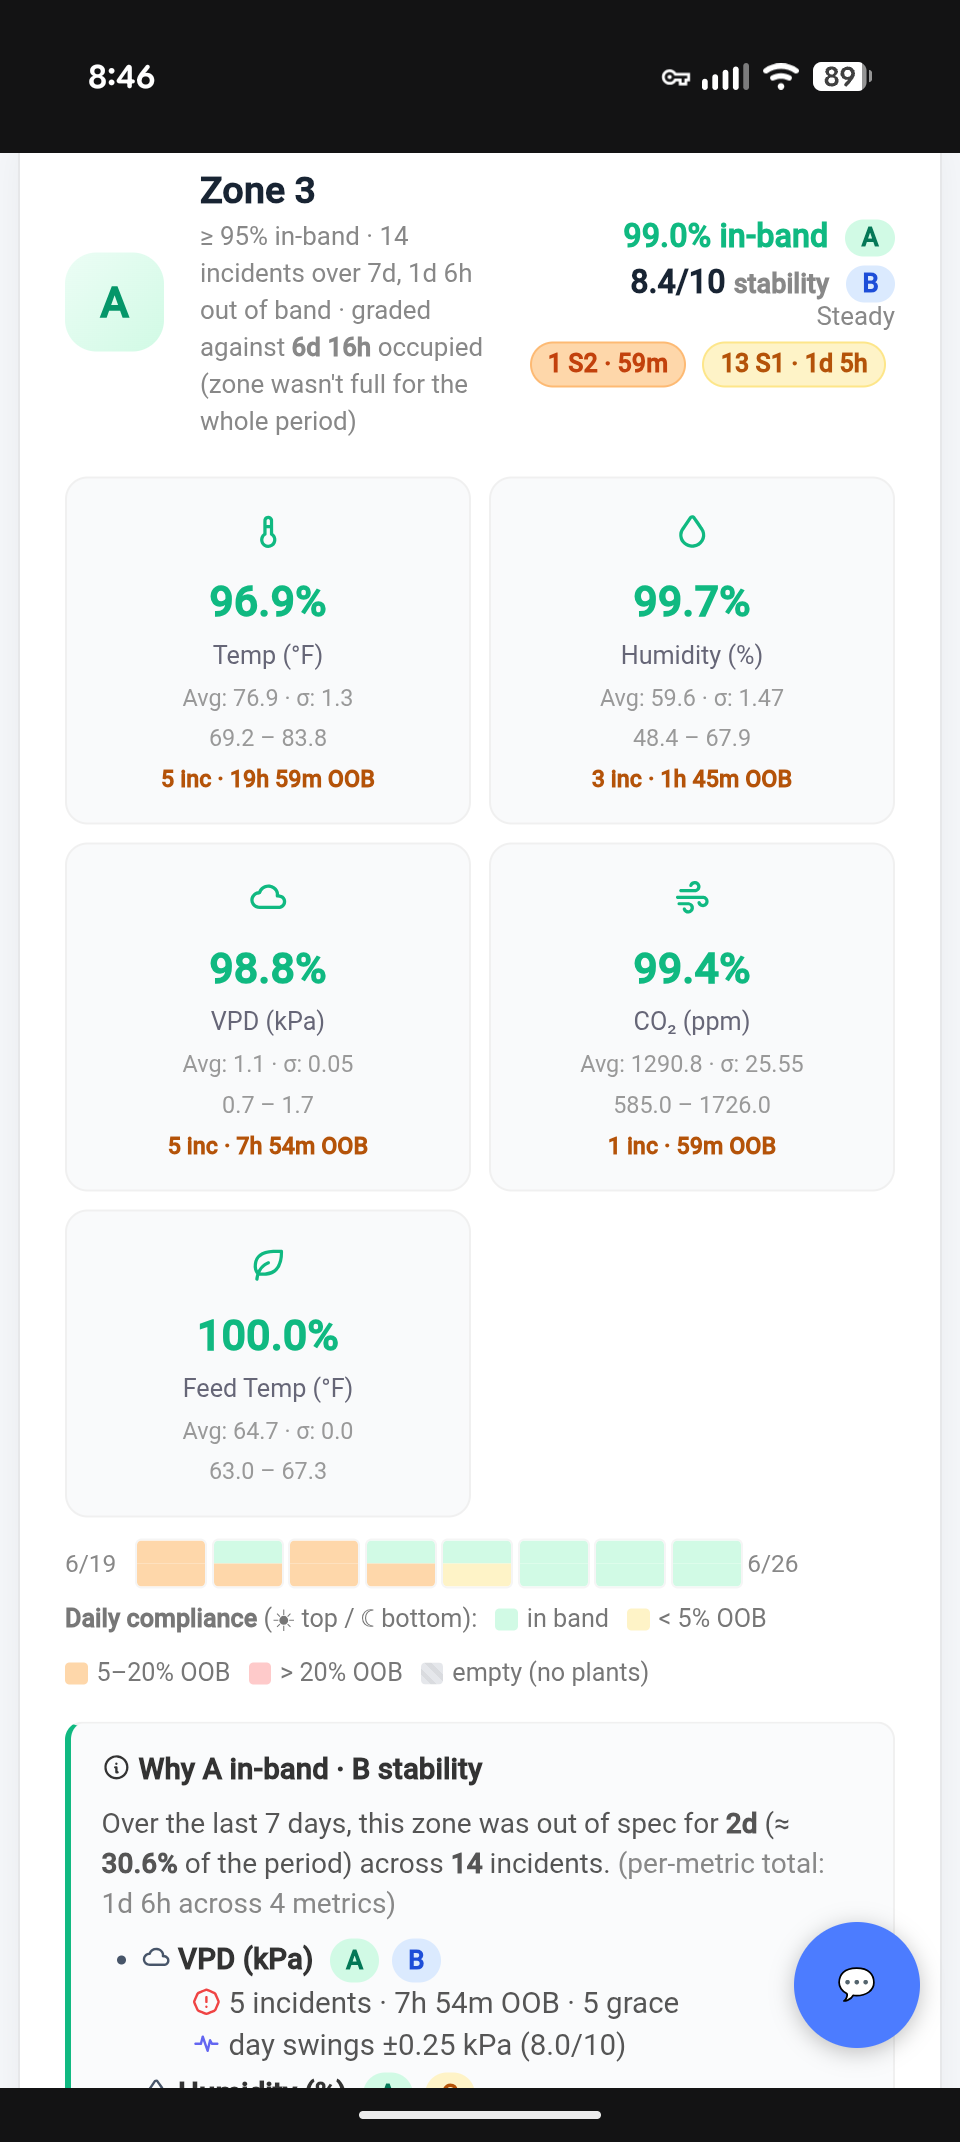
This is exactly what Growgoyle’s zone consistency scoring is built to surface. Here’s what it looks like in practice:
Zone consistency scoring: 99% in-band, but the 14.6°F temperature spread and 5 incidents tell the real story.
Each zone gets two scores:
In-band percentage measures how much time your readings stayed within your target range. An “A” grade means 95%+ of readings were in-band.
Stability score (1-10) measures how much your readings moved around within those bands. A room can be 99% in-band but still swinging 14°F from min to max. The stability score catches that.
The system tracks temperature, humidity, VPD, CO2, and feed temperature independently. Each metric shows its average, standard deviation, full range, number of out-of-band incidents, and total time spent outside your targets. A daily compliance heatmap breaks down performance by day and night phases, because a room that’s perfect during the day and chaotic at night will look fine on a 24-hour average but terrible when you split it out.
The consistency score answers the question this entire article is about: is your equipment actually holding the environment you think it’s holding?
Because here’s the reality. You can set perfect targets. You can run the right DIF strategy. You can have the right VPD and CO2 levels programmed in. But if your AC has a 6°F deadband, your lights crash the room every night, and your dehu can’t keep up with the transition, then your plants are living in a different environment than the one you think you’re providing.
The growers who are consistently pulling top yields and quality aren’t running secret genetics or exotic nutrients. They’re running tight rooms. Their equipment does what the controller says. Their transitions are smooth. Their DIF is intentional and held. That’s the difference.
If you’re managing a commercial grow room by relative humidity alone, you’re flying with half the instrument panel dark. Relative humidity tells you about the air. VPD tells you about the plant.
Vapor Pressure Deficit is the climate metric that ties temperature and humidity into a single number the plant actually responds to. It directly measures the atmospheric demand on your plants and influences how fast they transpire and how efficiently they uptake nutrients. Once you understand VPD, you’ll never look at a humidity reading the same way again.
🌡️ Free Cannabis VPD Calculator
Enter your temperature and humidity, get your VPD instantly. Includes leaf temperature offset and phase-specific targets.
VPD measures the difference between how much moisture the air holds and how much it could hold at saturation. The unit is kilopascals (kPa).
In plain terms: VPD tells you how “thirsty” the air is. High VPD means the air is dry and aggressively pulling moisture from every surface, including your plants’ leaves. Low VPD means the air is nearly saturated and the plants can barely transpire at all.
Why this matters more than RH: Relative humidity is relative to temperature. The same 55% RH reading creates completely different conditions for the plant depending on whether the room is 72°F or 84°F.
At 55% RH and 82°F, VPD is approximately 1.6 kPa. The air is pulling hard. Plants are transpiring heavily, and nutrient uptake is high.
At 55% RH and 72°F, VPD drops to approximately 1.2 kPa. Same humidity reading, very different plant response.
The math behind it: VPD = SVP(leaf) – AVP(air), where SVP is the saturation vapor pressure at leaf temperature and AVP is the actual vapor pressure of the air. You don’t need to calculate this manually. The Growgoyle VPD Calculator does it instantly.
The Cannabis VPD Chart: Optimal Ranges by Phase
This chart represents the target VPD ranges for cannabis at each growth phase, based on published research and commercial cultivation experience.
Stretch phase. Plants are metabolically active and water demand is increasing.
Mid Flower (Wk 4-6)
1.2 – 1.5
75-80°F
45-55%
Peak transpiration. Bud development requires consistent nutrient delivery.
Late Flower (Wk 7+)
1.2 – 1.6
72-78°F
40-50%
Dense buds create mold risk. Higher VPD keeps moisture moving out of the flower structure.
Dry Room
0.6 – 0.8
60-65°F
55-65%
Slow, controlled moisture loss. Low VPD prevents case hardening.
The pattern to notice: VPD gradually increases from clone through late flower. You’re progressively asking the plant to work harder as its root system and vascular capacity develop. Think of it like training. You don’t start a new clone at the same VPD you run in week 7 of flower for the same reason you don’t hand a new employee the most complex task on day one.
A note on precision: Dr. Bruce Bugbee at Utah State University has noted that the optimal VPD range is wider than many growers assume, particularly with adequate root zone moisture and supplemental CO2. He’s right. The difference between 1.1 and 1.3 kPa is unlikely to make or break a run. These phase targets are guidelines based on commercial experience, not rigid rules you need to hit exactly. Where VPD awareness becomes important is the fundamentals: knowing your actual VPD, understanding that two rooms with the same RH can have very different VPD, and recognizing when you’ve drifted into ranges that create real problems (below 0.8 kPa at night, for example).
Cannabis VPD Lookup Chart: Every Temperature and Humidity Combination
This is the cannabis VPD chart most growers want taped to the wall. Find your air temperature on the left, your relative humidity across the top, and read your VPD in kPa. Color coding shows which growth phase each value is appropriate for.
How to read this cannabis VPD chart:
Blue zones (below 0.4 kPa): VPD is too low. Transpiration is stalled. Mold risk is elevated.
Cyan zones (0.4-0.8 kPa): Appropriate for clones, seedlings, and the dry room.
Light green zones (0.8-1.2 kPa): Vegetative growth range. Plants are transpiring at a healthy, moderate rate.
Green zones (1.0-1.5 kPa): Flower sweet spot. Peak nutrient uptake and bud development.
Yellow zones (1.5-1.7 kPa): Caution. Plants can handle this briefly but water demand is high.
Red zones (above 1.7 kPa): Danger. Expect leaf curl, tip burn, and reduced growth.
For real-time calculations with leaf temperature offset, use the free VPD calculator instead of eyeballing the chart. It accounts for the leaf-to-air temperature difference that can shift your actual VPD by 0.2-0.3 kPa under high-intensity lighting.
The Night VPD Problem (That Most Growers Miss)
Most VPD discussions focus on the lights-on period. That’s a mistake. Night VPD is where most crop losses actually originate.
When lights turn off:
Temperature drops 8-15°F
Moisture content of the air stays the same
Relative humidity spikes (cooler air holds less moisture)
VPD crashes
A room running a healthy 1.3 kPa during the day can easily drop to 0.4 kPa during lights-off. At 0.4 kPa, the air is nearly saturated. Transpiration virtually stops. And the conditions are perfect for Botrytis cinerea (gray mold) and powdery mildew to establish.
The target: Keep lights-off VPD above 0.8 kPa. This usually requires dedicated dehumidification that ramps UP when lights go off, not down. Some facilities add supplemental heat during the dark period to keep the temperature drop manageable and prevent VPD from cratering.
Night VPD is the number one reason late-flower rooms develop botrytis. Dense flower structures trap moisture at the bud site, and if the surrounding air is already near saturation (low VPD), there’s nowhere for that moisture to go.
Raising temperature increases the air’s capacity to hold moisture, which raises VPD (makes the air “thirstier”). Lowering temperature reduces that capacity, which lowers VPD.
Which lever to pull depends on where you’re starting:
Scenario
Best Lever
Why
VPD too low, temp is already high
Dehumidify
Can’t raise temp further without heat stress
VPD too low, temp is moderate
Raise temp 2-3°F
Cheaper than running dehumidifiers harder
VPD too high, RH is very low
Humidify or slow down airflow
Adding moisture is the only option
VPD too high, temp is high
Lower temp
Reduces atmospheric demand and saves on cooling
Night VPD crashing
Dehumidify + minimal heat
Prevent temp drop from pulling VPD below 0.8
The cost angle: Adjusting temperature by 2°F to shift VPD often costs less in energy than running additional dehumidification. When you’re managing a 50-light room, every watt matters on the electric bill. Knowing which lever is cheaper for a given situation is the difference between a $30 adjustment and a $300 one.
Why VPD Matters More Than RH: A Real Scenario
Consider two rooms running identical RH at 55%:
Room A: 82°F, 55% RH = VPD of 1.6 kPa Plants are transpiring aggressively. Nutrient uptake is high. Water demand is extreme. If irrigation can’t keep up, you’ll see leaf curl and tip burn.
Room B: 72°F, 55% RH = VPD of 1.2 kPa Plants are transpiring comfortably. Nutrient uptake is moderate and manageable. Irrigation stays ahead of demand.
Same RH. Totally different plant experience. A grower monitoring only RH would think both rooms are identical. A grower monitoring VPD knows Room A is pushing the plants harder and would adjust irrigation scheduling accordingly.
This is why VPD profile is worth investigating when two rooms with the same strain, same feed, and same light produce different results. Different HVAC configurations create different VPD profiles, and different VPD profiles mean different transpiration rates, different nutrient uptake speeds, and different water demand throughout the cycle.
Leaf Surface Temperature: The Missing Variable
The standard VPD calculation uses air temperature and relative humidity. But the plant doesn’t experience air temperature. It experiences leaf temperature.
Under high-intensity lighting (LED or HPS), leaf surfaces can be 3-8°F warmer than the surrounding air depending on distance to light, airflow, and transpiration rate. This means the “real” VPD the plant feels is different from what your controller calculates.
The practical impact: If your sensor reads 78°F and 55% RH, it calculates a VPD of about 1.4 kPa. But if leaf surface temperature is actually 83°F due to radiant heat from LEDs, the plant is experiencing a VPD closer to 1.7 kPa. That’s a meaningful difference and could explain why plants show water stress even when your VPD “looks fine.”
Measuring leaf temperature: Infrared thermometers (point-and-shoot at the canopy) are cheap ($20-40) and give you a direct leaf surface reading. Some commercial sensor systems include IR leaf temperature sensors. If you’re running high PPFD (1,000+ µmol), checking leaf temps regularly is worth the 30 seconds it takes.
LED vs. HPS leaf temperature: Contrary to common belief, LEDs can create higher leaf temperatures than HPS at the same PPFD. HPS produces radiant heat that warms the entire room volume. LEDs concentrate photon energy more directly at the leaf, and the reduced ambient heat means less convective cooling around the leaf surface. Research in controlled environment agriculture has shown that leaf temperatures under LEDs can run 2-4°F higher than under HPS at equivalent light output, due to reduced convective air heating and more concentrated photon energy at the leaf surface.
VPD and Irrigation Timing
VPD directly influences when and how much you should water. Higher VPD means faster transpiration, which means faster substrate dry-back.
The connection:
High VPD (>1.4 kPa): Plants drink faster. Shorter irrigation intervals or larger shot sizes may be needed. Monitor substrate VWC (volumetric water content) closely.
Low VPD (<0.9 kPa): Plants drink slowly. Longer intervals between irrigation events. Over-watering risk increases because the plant isn’t pulling moisture from the substrate fast enough.
VPD crash at night: Substrate stays wet longer during lights-off because transpiration nearly stops. This is why many commercial operations use their final irrigation event 2-3 hours before lights-off, giving the substrate time to partially dry before the VPD drops.
This is a feedback loop. VPD drives transpiration, which drives water demand, which drives irrigation timing, which affects substrate moisture, which affects root zone oxygen availability, which affects nutrient uptake. If VPD is wrong, every downstream decision in your fertigation program is compensating for it.
VPD Across the Facility: Room-to-Room Consistency
Every room in a facility has slightly different thermal characteristics. South-facing walls, different HVAC duct lengths, varying insulation quality, and different equipment layouts all create room-specific VPD fingerprints.
This matters because persistent yield differences between rooms can have environmental roots that aren’t obvious from temp and RH readings alone. If Room 1 consistently produces 3.2 lb/light and Room 3 consistently produces 2.8 lb/light with identical genetics and nutrients, comparing the VPD profiles of both rooms across a full cycle is worth investigating. Night, day, transition periods. The data often reveals the answer.
Tracking VPD data alongside harvest outcomes over multiple runs is the only way to isolate environmental factors from everything else. One run’s data is noise. Five runs of the same strain in two rooms with recorded VPD profiles starts telling you something real about what’s driving the difference.
Quick-Reference VPD Troubleshooting
Symptom
Likely VPD Issue
Check This
Leaf tips curling upward
VPD too high
Leaf temperature, airflow intensity, RH
Leaf edges browning
VPD too high + inadequate irrigation
Substrate VWC, irrigation frequency
Slow growth despite good feed
VPD too low
Night VPD especially. Transpiration may be stalled.
Powdery mildew appearing
VPD too low, likely at night
Lights-off VPD. Target > 0.8 kPa overnight.
Botrytis in dense flowers
Night VPD crashing
Dehumidification capacity during lights-off
Uneven ripening across canopy
VPD microclimates
Airflow dead zones, canopy-level measurements
Nutrient lockout despite correct pH
VPD driving over/under-transpiration
Match irrigation to actual VPD, not schedule
FAQ
What is the ideal VPD for cannabis in flower?
During lights-on in flower, target 1.2-1.5 kPa. Early flower (weeks 1-3) can run slightly lower at 1.0-1.4 kPa during the stretch phase. Late flower (week 7+) benefits from the higher end of the range (1.2-1.6 kPa) to reduce moisture at the bud site and preserve terpenes.
What VPD is too high for cannabis?
Above 1.6 kPa, most cannabis cultivars show signs of water stress: upward leaf curl, reduced growth rate, and increased irrigation demand. Some desert-adapted genetics handle higher VPD, but for most commercial strains, staying below 1.5 kPa is the safe zone. Above 2.0 kPa is problematic for almost all cultivars.
How do I calculate VPD?
VPD = SVP(leaf temperature) – AVP(air). The saturation vapor pressure is calculated from temperature using the Tetens formula, and actual vapor pressure is derived from RH. Use a VPD calculator rather than doing this manually.
Should I monitor VPD at night?
Absolutely. Night VPD is where most mold and mildew problems originate. When lights go off, temperature drops, RH spikes, and VPD can crash to 0.3-0.5 kPa. Keeping lights-off VPD above 0.8 kPa should be a non-negotiable target for commercial flower rooms.
Does VPD affect cannabis potency?
Indirectly, yes. Terpene volatility increases at higher temperatures and VPD levels. Running excessively high VPD (and the high temperatures that usually accompany it) in late flower can reduce terpene content in the finished product. On the other end, a 2025 peer-reviewed study published in Plants (MDPI) found that elevated relative humidity during flowering, creating low VPD conditions of 0.62 kPa and below, significantly decreased cannabinoid concentrations and delayed flowering. Both extremes have documented consequences. Maintaining moderate VPD (1.2-1.5 kPa) at appropriate late-flower temperatures (72-78°F) preserves the aromatic and flavor compounds that affect perceived potency and bag appeal.
Where can I find a cannabis VPD chart?
The printable cannabis VPD chart above covers every temperature from 65-90°F and humidity from 35-85%, color coded by growth phase. For dynamic calculations that account for leaf temperature offset, use the Growgoyle VPD calculator.
What VPD should I run in the dry room?
Target 0.6-0.8 kPa at 60-65°F and 55-65% RH. Low VPD in the dry room prevents case hardening (the outside of the flower drying faster than the inside), which traps moisture and creates conditions for mold during cure. A slow, even dry at controlled VPD preserves terpenes and produces a more consistent final product.
VPD is the metric that connects everything in your grow room: temperature, humidity, transpiration, irrigation, and ultimately yield. Understanding it turns environmental management from guesswork into a repeatable system.
Growgoyle tracks your environment data alongside harvest outcomes across every run and uses AI to identify which climate factors actually drove results. It doesn’t track your costs. It helps you lower them through better yields and tighter consistency.
Your genetics don’t change between runs. Your nutrients don’t change between runs. Your lights don’t change between runs. But your yields do. The variable almost every time? Environment.
Climate control isn’t a checkbox on a facility build-out list. It’s the single biggest factor separating a 2.5 lb/light average from a 3.5 lb/light average. And the gap between those two numbers, multiplied across a commercial facility, is the difference between surviving wholesale compression and getting squeezed out.
This guide breaks down what actually matters in grow room climate management, what the research shows, and where most operations lose yield without realizing it.
The Four Pillars of Grow Room Climate
Every grow room environment comes down to four things working together:
Temperature controls metabolic rate and terpene preservation
Humidity (and its relationship to temperature via VPD) drives transpiration and nutrient uptake
CO2 fuels photosynthesis when light levels justify it
Airflow distributes everything evenly and prevents microclimates
Miss one and the other three can’t compensate. A room running perfect VPD with dead spots in airflow will still produce uneven canopies and inconsistent harvests.
Temperature Targets by Growth Phase
Temperature requirements shift as plants move through their lifecycle. Running the same setpoint from clone to harvest is one of the most common mistakes in commercial cultivation.
Optimal temperature ranges shift with each growth phase. Late flower runs coolest to preserve terpenes.
Phase
Lights On
Lights Off
Key Notes
Clone/Early Veg
78-82°F
72-76°F
Higher temps promote root development. Domes help maintain humidity.
Vegetative
76-82°F
68-74°F
Warmer temps drive faster growth. Don’t exceed 85°F even with CO2.
Begin stepping temps down. Resin production increases at cooler temps.
Late Flower (Wk 7+)
72-78°F
62-68°F
Coolest phase. Enhances anthocyanin expression and terpene preservation.
Dry Room
60-65°F
60-65°F
Constant. No light cycle. Target 55-65% RH.
The DIF principle: The difference between day and night temperatures (called DIF) directly influences plant morphology. A 10-15°F DIF promotes compact growth and stronger stems. Research published in the Journal of the American Society for Horticultural Science demonstrated that negative DIF (cooler days, warmer nights) reduces stem elongation, though this is more applicable in vegetable production than cannabis flowering.
For cannabis, maintaining a positive DIF of 8-12°F during flower is the practical sweet spot. It preserves terpene profiles (many terpenes are volatile above 80°F) while keeping metabolic processes active during the day.
Humidity and VPD: Why RH Alone Misleads You
Relative humidity is what most growers monitor. But RH is relative to temperature, which means the same RH percentage at two different temperatures creates completely different transpiration conditions for the plant.
This is where Vapor Pressure Deficit (VPD) matters. VPD measures the actual drying power of the air independent of temperature. It tells you how hard the plant has to work to move water through its vascular system.
Growth Phase
Target VPD (kPa)
Equivalent Conditions (example)
Clones
0.4-0.8
78°F / 80% RH
Veg
0.8-1.2
80°F / 65% RH
Early Flower
1.0-1.4
80°F / 58% RH
Late Flower
1.2-1.6
76°F / 50% RH
When VPD is too low (humid, stagnant air), transpiration slows. Nutrient uptake drops. Stomata close. Botrytis and powdery mildew thrive.
When VPD is too high (dry, aggressive air), plants transpire faster than roots can deliver water. Leaf edges curl. Stomata close defensively. Growth stalls.
The critical insight: you can hit the same VPD target by adjusting temperature OR humidity. Most growers reach for the dehumidifier first, but sometimes raising the temperature 2°F achieves the same VPD shift with less energy cost.
CO2 Supplementation: When It Helps and When It Doesn’t
CO2 enrichment is one of the most oversold and under-understood inputs in commercial cannabis.
The baseline: Ambient air contains approximately 420 ppm CO2. Plants can use more, up to a point. Research from Plant Physiology journals consistently shows photosynthetic rates in C3 plants (which includes cannabis) increase with CO2 concentration up to approximately 1,200-1,500 ppm, after which returns plateau.
But CO2 only helps when light is the limiting factor it removes. At low light levels (below 600 PPFD), plants can’t use the extra CO2. You’re just venting money.
CO2 supplementation only pays off when light levels support it. Most commercial LED rooms operate in the 900-1,200 PPFD range.
A study by Chandra et al. (2008) in Physiology and Molecular Biology of Plants found that cannabis photosynthesis increased 50% when CO2 was raised from 250 to 750 ppm at saturating light levels. But the delta from 750 to 1,500 ppm was much smaller. The biggest bang for your CO2 dollar comes from getting to 800 ppm, not from pushing to 1,500.
The timing mistake: CO2 should only run during lights-on. During lights-off, plants respire (consume O2, release CO2). Supplementing CO2 at night is pure waste, and can create dangerously high concentrations in sealed rooms.
The temperature relationship: Higher CO2 levels allow plants to tolerate (and benefit from) slightly higher temperatures. At 1,200+ ppm, running 82-85°F during lights-on is acceptable and can increase photosynthetic efficiency. At ambient CO2, those temperatures cause stress.
Airflow Design: The Invisible Yield Killer
You can have perfect temperature, perfect humidity, and perfect CO2 levels at your sensor. And still have problems. Because your sensor measures one point in the room. The canopy doesn’t care about the average. It cares about what’s happening at leaf level.
Canopy-level microclimates are responsible for more mold, more uneven ripening, and more inconsistent yields than most growers realize. The center of a dense canopy can be 5-8°F warmer and 15-20% higher RH than the data your controller sees.
Common Airflow Mistakes
Oscillating fans pointed at the canopy create hot spots and cold spots on a timer. Constant, directional airflow from multiple angles is better.
Fans too strong cause wind stress, thickened stems (which sounds good but actually diverts energy from flower production), and localized drying.
Fans too weak or too few leave dead zones. The center of the room, directly under lights, is always the worst spot.
No vertical air exchange allows heat to stratify at ceiling level. Ceiling fans or ducted air returns prevent this.
The benchmark: A well-designed commercial room moves enough air to achieve 0.5-1.0 air exchanges per minute at canopy level. This isn’t the same as HVAC air changes per hour (ACH) for the whole room. It specifically means the air touching the leaves is being replaced constantly.
The Night Climate Problem
When lights go off, VPD crashes into the mold risk zone. This is where most crop losses actually originate.
Most climate discussions focus on daytime parameters. But the lights-off period is where climate control breaks down in the majority of commercial operations.
VPD plummets into the danger zone for mold and mildew
CO2 from plant respiration accumulates in sealed rooms
Night VPD management is arguably more important than daytime VPD for crop health. A room that runs 1.2 kPa VPD during the day but drops to 0.4 kPa at night is creating the exact conditions Botrytis cinerea needs to establish.
The fix: Dehumidification ramps UP when lights go off, not down. Some operations add a small amount of supplemental heat during lights-off to keep the day/night VPD gap manageable. The target is keeping lights-off VPD above 0.8 kPa through the entire dark period.
Sealed Rooms vs. Open Rooms
Most commercial facilities run sealed rooms with dedicated HVAC and dehumidification. This is the right approach for flower rooms because:
Full environmental control (no outside air variables)
CO2 retention (supplemented CO2 doesn’t escape)
Pest pressure reduction (no intake from outdoors)
Humidity control (no ambient moisture entering)
HVAC sizing rule of thumb: Plan for 4-5 tons of cooling per 1,000 square feet of canopy in a sealed room with modern LED fixtures. HPS rooms need more (6-7 tons) due to higher radiant heat.
HVAC System Types for Commercial Grows
Not all cooling is created equal, and the system you choose shapes how well you can manage climate long-term. Here is what each option actually looks like in a commercial flower room.
System Type
Best For
Upfront Cost
Operating Cost
Dehumidification
Ductless Mini-Splits
Small rooms (1-4 lights)
Low ($2-5K/room)
Moderate
Minimal. Needs standalone dehumidifier.
Ducted Split Systems
Mid-size rooms (5-20 lights)
Moderate ($5-15K/room)
Moderate
Partial. Still needs supplemental dehumidification in flower.
Chilled Water Systems
Multi-room facilities
High ($30-80K+ for chiller plant)
Lowest at scale
Excellent with proper air handlers. Best overall control.
Integrated. Designed for high-transpiration crops.
Mini-splits are the entry point. They cool well but remove almost no moisture. In a flower room with 50+ plants transpiring gallons per day, a mini-split alone will leave you chasing humidity every night. They work for veg rooms and small personal grows. For commercial flower, plan on adding standalone dehumidification.
Ducted split systems are the standard for rooms in the 5-20 light range. Better air distribution than wall-mounted heads, and some passive dehumidification during cooling cycles. The limitation is that cooling and dehumidification are still partially coupled. When the thermostat is satisfied, the compressor cycles off and humidity creeps back up.
Chilled water systems are the commercial standard for multi-room facilities. A central chiller produces cold water, which circulates to air handlers in each room. The advantage: you size the chiller for the entire building’s load, and each room gets precisely the cooling it needs through its own air handler. Operating costs are significantly lower at scale, and the central plant can run at partial load during lights-off rather than cycling compressors on and off.
Purpose-built grow room HVAC units from companies like Desert Aire, Surna, and Quest integrate cooling and dehumidification into a single system designed for the specific conditions cannabis creates. They handle the high latent loads (moisture removal) that general HVAC systems struggle with. The tradeoff is higher per-unit cost, but for a single large flower room, they often outperform a split system plus standalone dehumidifier at a similar total price point.
Niu et al. (2020) published research in Energy and Buildings showing that LED fixtures reduce HVAC cooling requirements by 30-40% compared to HPS at equivalent light output. If you recently switched from HPS to LED, your existing HVAC may be significantly oversized, which sounds like a benefit but actually causes short-cycling: the compressor reaches setpoint too quickly, shuts off, humidity climbs, compressor kicks back on. Short-cycling wears equipment faster and creates the temperature and humidity swings that hurt consistency.
Seasonal Climate Challenges
Most climate control discussions assume a static outdoor environment. Reality is different. The hardest weeks to manage are not peak summer or deep winter. They are the transition seasons, when outdoor conditions swing 30-40°F in a single day and your controllers spend the whole time chasing setpoints.
Summer
The primary challenge is heat load stacking. Your lights produce heat. Your dehumidifiers produce heat (they are essentially refrigeration units, and all the energy they consume becomes heat in the room). Your HVAC fights both. On a 95°F day with high outdoor humidity, cooling capacity that was comfortable in April starts falling short in July.
The secondary summer challenge is nighttime outdoor conditions. In many climates, summer nights stay warm and humid enough that there is no free cooling available from outside air. Sealed rooms handle this fine, but operations that rely on any nighttime air exchange lose their usual assist.
Winter
Winter flips the problem. Indoor air becomes extremely dry, especially in northern climates where outdoor air at 10°F holds almost no moisture. Humidification suddenly becomes necessary in veg rooms and clone areas. Flower rooms usually have enough transpiration to maintain humidity, but veg rooms with fewer plants per square foot can drop to 30% RH without supplementation.
The other winter risk is cold surfaces. Exterior walls, poorly insulated ceiling corners, and any surface touching the outside can drop below the dew point of room air. Condensation forms. Mold follows. Insulation and vapor barriers on exterior walls are not optional in cold climates.
Transitions (Spring and Fall)
This is where the data shows the most climate failures. A day that starts at 45°F and ends at 78°F creates a moving target for HVAC. The room that was slightly over-cooled at 8 AM is under-cooled by 2 PM. Controllers that work fine in steady-state conditions lag behind rapid outdoor changes.
The practical fix is slightly more aggressive setpoints during transition months: tighter deadbands, faster response times, and closer monitoring. Operations that track environment data across entire runs will see yield inconsistency cluster in the spring and fall harvests. That pattern is a direct signal to tighten climate control during those months. Scoring your operational efficiency across seasons helps identify whether climate is the weak link.
The Dehumidification Challenge
Cannabis plants transpire heavily, especially in flower. A room of 50 plants in mid-flower can release 50+ gallons of water per day into the air. If your dehumidification can’t remove it as fast as the plants release it, humidity climbs every evening and your VPD falls apart during lights-off.
This is where most operations fail at climate control. Not during the day, when HVAC cooling provides some passive dehumidification. At night, when lights go off, temperature drops, and relative humidity spikes because cooler air holds less moisture.
The solution is dedicated dehumidification sized for the lights-off period, not the lights-on period. Quest, Anden, and similar commercial units designed for grow rooms are built for continuous operation at the temperature and humidity ranges cannabis requires.
Sizing rule of thumb: In flower, budget 2-3 pints of moisture removal capacity per plant per day. A 50-plant flower room needs 100-150 pints/day of dehumidification capacity. Size for the lights-off peak, not the average. The hours after lights turn off are when transpiration continues (plants don’t stop immediately) while temperature drops and RH spikes. That two-hour window after lights-off is the highest-demand period for your dehumidifier.
Monitoring: What to Measure and Where
A single temperature/humidity sensor on the wall tells you almost nothing about what the canopy is experiencing.
Minimum monitoring for a commercial room:
Temperature and RH at canopy level (not wall-mounted, not ceiling-mounted)
Temperature and RH at multiple points if the room exceeds 500 sq ft
CO2 concentration at canopy level
Substrate metrics (VWC, EC, temperature) if running automated irrigation
What sensors miss: Even good sensor placement captures a point in time at a point in space. It doesn’t capture microclimates, gradual drift within a day, or the cumulative impact of small environment deviations across an entire run.
This is where AI-powered environment analysis adds a layer that sensors alone can’t provide. Cultivation intelligence platforms can analyze environment data alongside yield outcomes, photo-based plant health assessments, and historical batch data to identify which environmental factors actually drove results on a specific run. A sensor tells you the humidity spiked Tuesday night. AI batch analysis tells you that the same pattern preceded the quality drop in your last three harvests.
Automation: What to Automate First
Full environmental automation is expensive. But not all automation is equal. Some investments pay for themselves immediately, others are nice-to-have. Here is the priority order based on where manual control fails most often.
Tier 1: Automate immediately.
Temperature and dehumidification. No human can maintain consistent VPD through an 8-12 hour dark period. The transition from lights-on to lights-off requires dehumidification to ramp up within minutes, not whenever someone checks the room. This is the single highest-value automation in any grow.
CO2 injection tied to light schedule. A simple relay that kills CO2 at lights-off prevents waste and dangerous nighttime buildup. Timer-based works. Sensor-based is better but not mandatory for most operations.
Tier 2: High value, moderate cost.
Integrated environmental controllers that manage HVAC, dehumidification, and CO2 from a single brain. TrolMaster, Agrowtek, and IntelliClimate are the most common in commercial cannabis. The reason these matter: without coordination, your HVAC and dehumidifier fight each other. The HVAC cools the room (which raises RH). The dehumidifier removes moisture (which adds heat). They cycle back and forth, wasting energy and creating unstable conditions. An integrated controller manages both simultaneously to reach the combined temperature and humidity target.
Tier 3: Nice to have.
Automated irrigation tied to substrate sensors. VWC-based irrigation removes the guesswork from watering frequency and helps maintain consistent rootzone conditions. Valuable, but environment automation pays off first.
Light dimming schedules. Stepping PPFD up gradually during early flower and dimming during the last week of flower can optimize DLI without manual adjustment. Most modern LED controllers support this natively.
The common mistake is automating irrigation before automating climate. A perfectly watered plant in a room where VPD swings from 0.6 to 1.8 kPa every night is still going to produce inconsistent results.
What temperature should I run my cannabis grow room?
It depends on the growth phase. Vegetative rooms run 76-82°F during lights-on, dropping to 68-74°F at night. Flower rooms start at 78-82°F in early flower and step down to 72-78°F in late flower. Late-flower night temps of 62-68°F help preserve terpenes and can enhance color expression.
Is VPD more important than relative humidity?
Yes. RH is a relative measurement that changes meaning with temperature. VPD directly measures the atmospheric demand on the plant. A room at 55% RH and 82°F has a completely different VPD than 55% RH at 72°F. Monitor VPD, not RH alone.
How much CO2 should I add to my grow room?
Only supplement CO2 if your light intensity supports it. Below 600 PPFD, ambient CO2 (420 ppm) is sufficient. At 900-1,200 PPFD (most commercial LED rooms), target 800-1,200 ppm during lights-on only. The photosynthetic benefit plateaus above 1,500 ppm.
Why does my humidity spike at night?
When lights turn off, temperature drops but the moisture content of the air stays the same. Cooler air has a lower capacity to hold moisture, so relative humidity rises. The fix is dedicated dehumidification that ramps up during the dark period, not down.
How do I prevent mold in a grow room?
Mold prevention is a climate control problem. Maintain VPD above 0.8 kPa during lights-off, ensure consistent airflow at canopy level, avoid dead zones, and size dehumidification for the lights-off worst case. Botrytis establishes during the exact conditions that occur when dehumidification fails at night.
How many BTUs do I need for a grow room?
The standard estimate for LED flower rooms: 3,500-4,000 BTU per 1,000W equivalent of LED lighting. A 24-light room running 720W LEDs produces roughly 17,000W of heat load, which translates to approximately 60,000 BTU of required cooling capacity. Always oversize by at least 20% to account for dehumidifier heat output, which adds back into the room. Facilities that switched from HPS to LED may have oversized HVAC that short-cycles. Caplan et al. (2019) in HortScience documented that LED-grown cannabis achieved comparable yields to HPS at lower environmental heat loads, which directly affects HVAC sizing requirements.
What size dehumidifier do I need for a grow room?
In flower, budget 2-3 pints of removal capacity per plant per day. A 50-plant flower room needs 100-150 pints/day of dehumidification capacity. The critical sizing factor is lights-off performance, not rated capacity at standard conditions (most manufacturers rate at 80°F/60% RH, which is warmer than your lights-off room). Check the unit’s performance specs at 65-70°F, which is closer to your actual lights-off conditions. Many units lose 30-40% of their rated capacity at lower temperatures.
How do I control humidity in a sealed grow room at night?
Three strategies work together. First, dedicated dehumidification that ramps up the moment lights turn off, not when humidity reaches a threshold (by then it is already too high). Second, a small reheat coil or supplemental heat that prevents temperature from dropping too fast. Slowing the temperature decline reduces the RH spike. Third, consistent airflow through the canopy during the entire dark period. The target: VPD stays above 0.8 kPa through the full lights-off cycle. Monitor VPD at canopy level, not at your wall sensor, since the canopy microclimate is always more humid than ambient room conditions.
Climate control is the foundation every other input sits on. Genetics, nutrients, and light only express their potential when the environment lets them. For operations serious about consistent yields, tracking environmental data alongside harvest outcomes across every run is the only way to know whether your climate program is working or just working sometimes.
Knowing what your environment costs you starts with knowing your cost per pound. Once you have that number, the question becomes which operational factors are keeping it higher than it should be.
Growgoyle analyzes your environment data alongside yield, quality, and plant health data to identify what actually drove results on each run. It doesn’t track your costs. It helps you lower them through better yields and tighter consistency.