Author: Growgoyle

  • Sensor Dashboard vs. Cultivation Intelligence: What’s the Difference?

    Sensor Dashboard vs. Cultivation Intelligence: What’s the Difference?

    Sensor Dashboard vs. Cultivation Intelligence: What’s the Difference?

    You probably have sensors. You probably have a dashboard. You can check your temp and RH from the couch at 11pm without putting your shoes on. Congratulations. So can every other cannabis grower in your state.

    The question isn’t whether you can see your data. The question is whether your data is actually making your grows better, batch after batch. Are you pulling more pounds per light than you were six months ago? Is your trim ratio tightening? Are your lab results trending the direction you want?

    If the honest answer is “sort of” or “I’m not sure,” you’re probably confusing two things that look similar on the surface but do completely different jobs: a sensor dashboard and cultivation intelligence. Most cannabis growers don’t realize these are two separate categories. They assume more data visibility means better grows. It doesn’t. Not automatically.

    Here’s how to think about the difference, and why it matters more than most facility owners recognize.


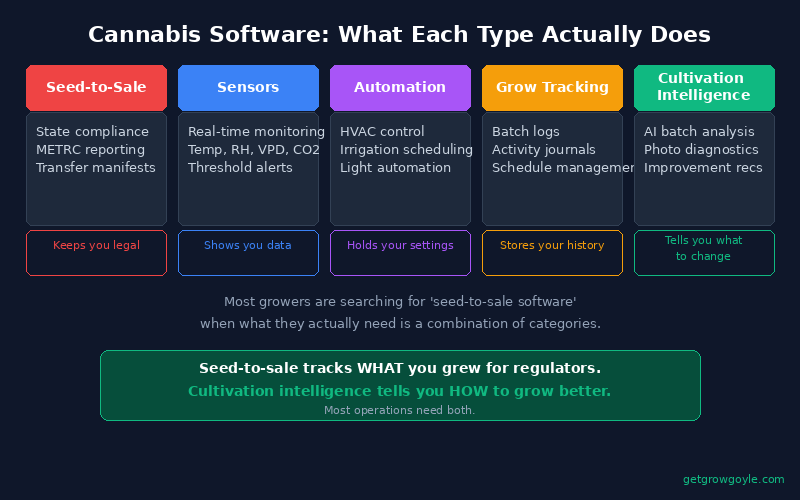
    What a Sensor Dashboard Actually Does

    A sensor dashboard does one thing well: it collects environmental data and displays it. Temperature, relative humidity, CO2 levels, VPD, light intensity, soil moisture. It logs the numbers, draws the charts, and sends you an alert when something crosses a threshold you set.

    That’s genuinely useful. Real-time monitoring catches equipment failures before they kill a room. An HVAC going down at 2am is a disaster you want to know about at 2am, not at 9am when you walk in. If your sensor system has tight alerting on mission-critical equipment, keep it running. That infrastructure matters.

    But here’s the ceiling, and it’s a hard one: a sensor dashboard shows you numbers. The interpretation is 100% on you.

    Your dashboard knows your canopy was at 84F and 62% RH on Day 18 of flower. It does not know whether that caused your yield to drop 0.4 lb/light. It doesn’t know whether your last run of the same strain ran cooler and outperformed. It has no idea what your canopy looked like, what your feed EC was, what your drying curve did afterward, or what your lab came back with. It just logged the 84F and moved on.

    The other thing sensor dashboards don’t do: they only see your environment. That’s one dimension of a cannabis grow. Environment matters a lot. It’s also not the only thing that matters. A sensor dashboard knows nothing about your harvest weight, your lab results, your strain history, your feed recipes, your drying outcomes, your team task completion, or what your canopy looked like on Day 21. It’s not designed to. That’s not a criticism. It’s a scope limitation you need to understand.

    Think of it like a fitness tracker that counts your steps. Useful data. But it doesn’t design your training program, and it doesn’t tell you why you’re not getting faster.


    What Cultivation Intelligence Actually Does

    Cultivation intelligence starts where a sensor dashboard stops. Instead of one data source feeding one display, it ingests data from every part of your operation and synthesizes it into specific, actionable guidance.

    The key distinctions aren’t subtle.

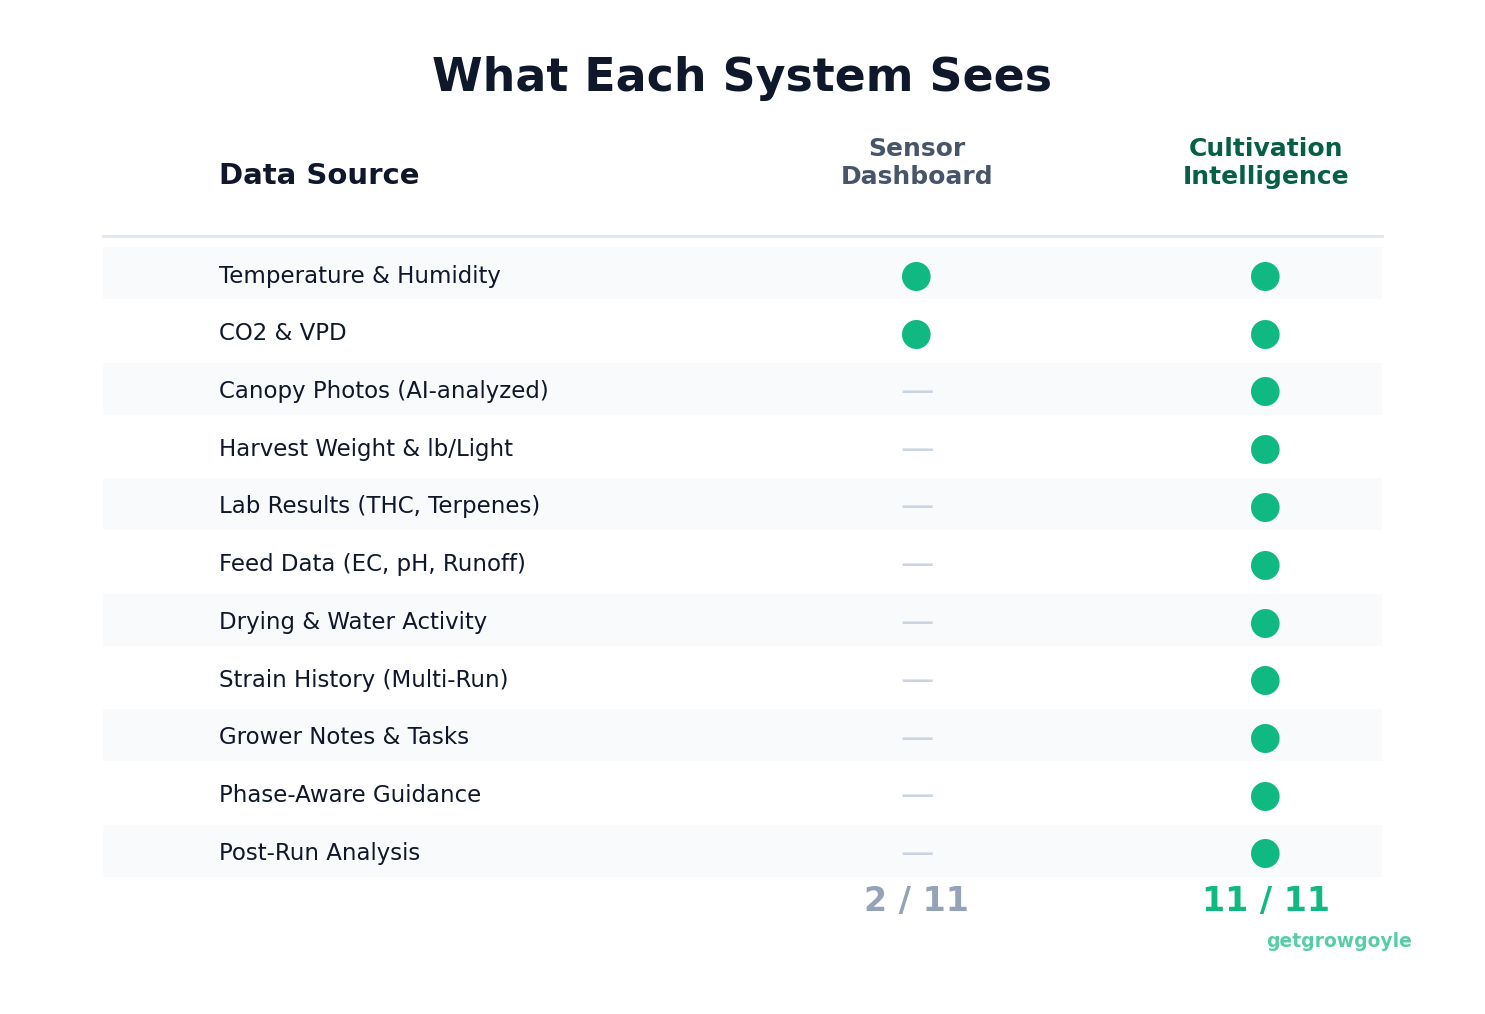
    Breadth of data. Cultivation intelligence doesn’t just look at your environment. It looks at everything that affects your outcome. Canopy photos, harvest weights, trim ratios, water activity readings, THC percentages, drying timelines, feed records, task completion, grower notes, strain history. It sees the full picture because it ingests the full picture. That’s a fundamentally different analytical foundation than a sensor chart.

    Retrospective analysis. After a run finishes, a sensor dashboard has nothing to say. It archives your data and waits for the next run. Cultivation intelligence, by contrast, does its most important work after harvest. It looks at everything that happened across the full batch cycle and tells you what worked, what didn’t, and what specific changes would have added pounds. Not charts. Written analysis with lb/light estimates and priority-ranked improvements. That’s the difference between looking at a graph and getting a diagnosis.

    Memory across batches. This one is underrated. Cultivation intelligence compares this run to your last run of the same strain, and the one before that. It remembers what made your best batch great and tells you when you’re drifting from it. A sensor dashboard has no concept of “your best batch.” It has no memory across runs. Every harvest is just another set of numbers with no context.

    Phase awareness. Week 1 of flower and Week 7 of flower are completely different growing environments with completely different priorities. Cultivation intelligence knows what phase you’re in and adjusts its guidance accordingly. The analysis you need when you’re dialing in stretch is not the same analysis you need when you’re watching trichome development. A sensor dashboard sends you an alert when your CO2 crosses 1600ppm regardless of whether it’s Day 5 or Day 60.

    The doctor analogy is the right one here. A doctor doesn’t just take your temperature. They look at your bloodwork, your history, your symptoms, your medications, and your lifestyle before telling you what to change. A thermometer is useful. It’s not a diagnosis.

    You can read more about what AI batch analysis actually produces after a run completes, and why retrospective analysis is where most of the yield gains live.


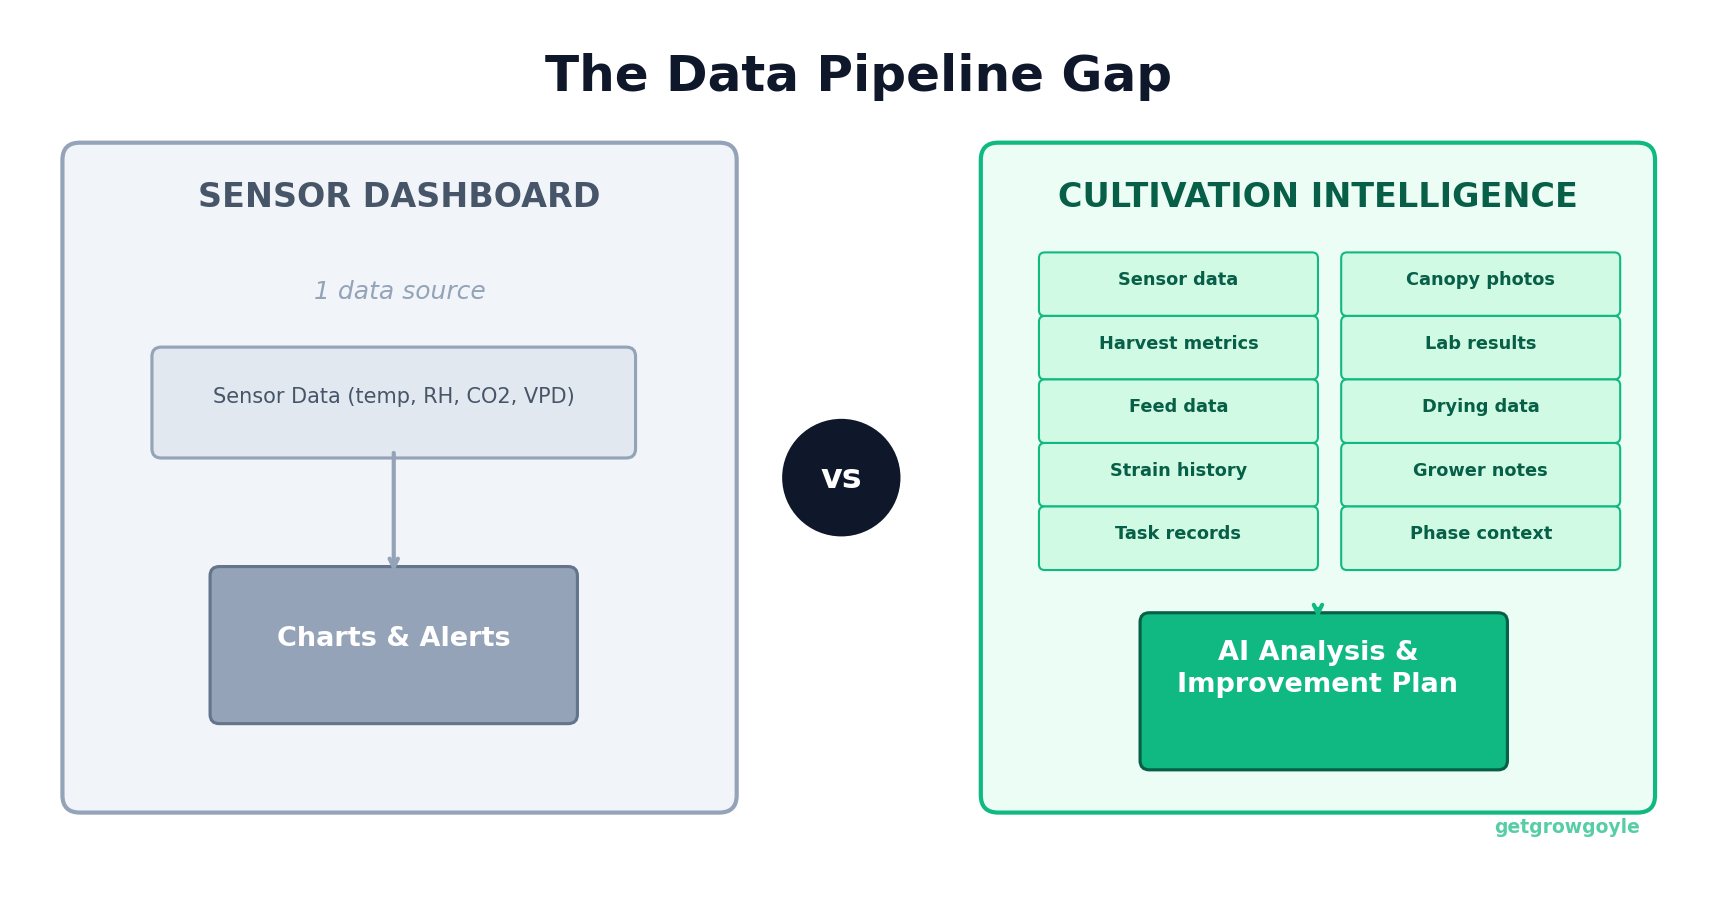
    The Data Pipeline Gap (This Is the Real Divide)

    Here’s the structural difference between these two categories, stated plainly.

    A sensor dashboard has one input: sensor data. One pipeline. Environment in, charts out.

    Cultivation intelligence has 10 or more inputs feeding a single analytical engine:

    1. Environmental sensor data (temp, RH, CO2, VPD, light, soil moisture)
    2. Canopy photos analyzed by AI for health, stress, and deficiency
    3. Harvest metrics (dry weight, wet weight, lb/light, plant count)
    4. Lab results (THC, terpenes, water activity, microbials)
    5. Feed data (nutrients, EC, pH, runoff)
    6. Drying data (duration, weight loss, final moisture content)
    7. Strain history across every prior run of the same genetics
    8. Grower notes and journal entries
    9. Task completion records
    10. Schedule and phase context (what day of flower, what activities are due)

    The synthesis is the product. Any one of these data sources alone is useful. All of them together, analyzed by AI that understands cannabis cultivation, produces insights no human could reasonably assemble manually in the time between runs.

    The structural gap: a sensor dashboard has 1 data source. Cultivation intelligence synthesizes 10+ into specific, action
    The structural gap: a sensor dashboard has 1 data source. Cultivation intelligence synthesizes 10+ into specific, actionable guidance.

    A grower could theoretically do this themselves. Pull the sensor data, look at the canopy photos, compare to last run’s spreadsheet, check lab results, review notes, estimate what the differences cost you in pounds. Some very disciplined growers actually do a version of this. It takes hours. It happens once per run if they’re disciplined. Usually it doesn’t happen at all because harvest week is not when you have time to sit down and do data analysis.

    Cultivation intelligence does it automatically after every batch. Same rigor, zero hours of manual work, consistent memory across every run you’ve ever logged.

    Feature comparison: what a sensor dashboard can see vs. what cultivation intelligence ingests and analyzes.
    Feature comparison: what a sensor dashboard can see vs. what cultivation intelligence ingests and analyzes.

    Understanding how that analysis directly affects your bottom line is worth reading more about: how AI batch analysis lowers cost per pound gets into the specifics of where those gains actually come from.


    Where Sensor Dashboards Still Matter

    To be clear: don’t trash your sensors. Sensors are essential. Environmental data is a critical input to everything cultivation intelligence does. You can’t do retrospective analysis on your VPD curve if you weren’t logging VPD in the first place.

    Think of it this way. Sensors are the ears. Cultivation intelligence is the brain. You need both.

    Where sensors shine is real-time equipment monitoring. If your chiller goes down at 3am, you want a text message, not an insight delivered at the end of your next harvest. Mission-critical alerts belong close to the hardware, on systems designed for that purpose. Cultivation intelligence is not trying to replace your environmental alerting infrastructure.

    Good cannabis grow room environment control starts with knowing what’s happening in real time. Sensor systems do that job well. The question is what you do with that data afterward, and whether it ever connects to the rest of what you know about your facility.

    The point isn’t that sensor dashboards are bad. The point is that they’re incomplete. Watching your environment in real time is step one. Understanding what all your data means across batches, strains, and seasons is step two. Most cannabis growers are stuck on step one and think they’re done because the charts look good.


    The Question to Ask Yourself

    Think about your last harvest. What did you actually do with the data afterward?

    Did you look at the environmental data, the yield numbers, the lab results, the canopy photos, the feed records, and the drying data all together? Did you compare that picture to the previous run of the same strain? Did you identify what changed, quantify the impact, and write down specific things to do differently next cycle?

    If you did: you’re doing cultivation intelligence manually. Software just does it faster, more consistently, and with better memory than a whiteboard or a spreadsheet you’ll lose in six months.

    If you didn’t: you left pounds on the table last cycle. Not because your sensors are bad. Because data without analysis is just noise. Your dashboard logged everything faithfully. Without the retrospective synthesis, none of it made your next run better.

    The growers consistently pulling the best numbers out of the same square footage aren’t doing it because they have fancier sensors than everyone else. They’re doing it because they’re actually learning from every run. That’s the whole game. Batch over batch improvement doesn’t happen by accident.

    For a deeper look at the mechanics of that improvement cycle, the article on what cultivation intelligence actually is covers the category in full, including what makes it different from standard grow management software.


    Putting It Together

    If you’re evaluating tools for your cannabis cultivation operation, here’s a clean way to sort them out.

    Sensor dashboards answer: “What is happening right now?” That’s a monitoring question. The tools designed for it do it well. Real-time visibility, threshold alerts, historical charts.

    Cultivation intelligence answers: “What should I do differently, and what will it cost me if I don’t?” That’s an improvement question. It requires more data sources, AI-driven synthesis, and retrospective analysis across full batch cycles. It’s a different category of tool solving a different problem.

    Most cannabis facilities need both, doing their respective jobs. The mistake is assuming that because you have good sensor coverage, you have cultivation intelligence. You don’t. You have the inputs. The analysis is still missing.

    Your yields aren’t held back by a lack of data. They’re held back by a lack of insight from the data you already have. That’s the gap cultivation intelligence closes.


    Growgoyle doesn’t replace your sensors. It makes sense of everything your sensors, your eyes, your scale, and your lab reports are telling you. Upload a few canopy photos and see what the AI catches in 60 seconds. Try it free on your own plants.

    About the Author

    Eric is a 15-year software engineer who operates a commercial cannabis cultivation facility in Michigan. He built Growgoyle to solve the problems he faces every day: inconsistent yields, forgotten lessons from past runs, and the constant pressure to lower cost per pound. Every feature in Growgoyle comes from real growing experience, not a product roadmap.

  • Why Yield Per Square Foot Is a Vanity Metric (Cost Per Pound Is What Matters)

    Why Yield Per Square Foot Is a Vanity Metric (Cost Per Pound Is What Matters)

    Why Yield Per Square Foot Is a Vanity Metric (Cost Per Pound Is What Matters)

    You’ve seen it happen in every Facebook group, every trade show conversation, every post-harvest text chain. Someone drops their yield number and the room shifts. “We’re pulling 4.8 lb per light.” The implied message: we’ve figured it out. Nobody ever asks the question that actually matters: what did that pound cost you to produce?

    I run a commercial cannabis cultivation facility. I also have 15 years as a software engineer, which means I think about operations the way a business analyst would, not just a grower. I’ve watched facilities flex numbers that would get them laughed out of any serious business conversation. Yield per square foot. Grams per watt. Total harvest weight. These numbers are everywhere, they’re easy to photograph, and in isolation, they mean almost nothing.

    Here’s the uncomfortable truth: you can be pulling 4.5 lb per light and still be losing money. And your competitor running 3.5 lb per light might be three times more profitable than you. The metric that actually determines whether your cannabis facility survives is cost per pound, and most operators aren’t tracking it.

    The Metrics Growers Actually Flex On

    Walk through the metrics growers love to post about:

    • Yield per square foot (grams or pounds)
    • Pounds per light
    • Grams per watt
    • Total harvest weight

    Every single one of these measures output. None of them measure efficiency. And here’s the part that doesn’t get talked about: every one of them can be gamed without actually improving your business.

    Want better grams per watt? Run hotter lights and stress your plants into producing more. You’ll also burn more energy, increase your HVAC load, and potentially sacrifice quality. Want more yield per square foot? Pack more plants in tighter. Your labor goes up, your airflow goes down, your canopy management gets harder. Want to post a big total harvest number? Run a longer flower cycle. Now your room turns over fewer times per year and your annual revenue drops.

    Gaming yield metrics doesn’t lower your cost per pound. It often raises it. The optimization is happening on the wrong variable.

    What Cost Per Pound Actually Tells You

    Cost per pound forces you to be honest. You can’t cherry-pick it. It requires you to account for everything it took to produce that harvest: nutrients, energy, labor, rent or mortgage, equipment depreciation, packaging, testing, waste. All of it, divided by the pounds you actually sold.

    When you calculate cost per pound, the score reflects reality. And reality, right now in Michigan, is a wholesale market estimated around $500 per pound.

    Here’s a hypothetical comparison that illustrates why yield numbers alone don’t tell you enough. These are illustrative figures, not real facilities, but the math is the point:

    Facility A Facility B
    Yield per light 4.5 lb 3.5 lb
    Number of lights 24 24
    Total harvest 108 lb 84 lb
    Monthly overhead $45,000 $28,000
    Cost per pound $417 $333
    Margin at est. ~$500/lb wholesale $83/lb $167/lb
    Total run profit ~$9,000 ~$14,000

    Facility B loses on every yield metric. Lower yield per light. Lower total harvest. Facility A would win every Instagram brag-off. Facility B is more than twice as profitable per run.

    Same lights, same room count. Facility A wins every yield brag. Facility B makes 56% more profit per run.
    Same lights, same room count. Facility A wins every yield brag. Facility B makes 56% more profit per run.

    If you want to go deeper on how to actually define and understand this number, this breakdown of what cost per pound means in cannabis cultivation is worth reading before you set up your own tracking.

    Why the Industry Is Still Obsessed With Yield

    This isn’t a mystery. There are real reasons yield became the de facto scoreboard for cannabis growers, and most of them made sense at one point.

    It’s easy to calculate. Count your pounds, divide by your square footage. Done. No accounting required.

    It’s easy to compare. You can throw yield numbers across facilities, across states, across years. Cost per pound requires knowing someone’s overhead, and nobody shares that.

    It’s visible and photographable. A room full of dense, heavy colas is content. A spreadsheet showing you’ve tightened your cost structure is not.

    It’s a legacy of a different market. When cannabis was trading at $2,500 to $3,000 per pound, efficiency was optional. You could run a sloppy operation with mediocre yields and still make real money. Overhead didn’t matter much when your gross margin was that thick. Growers built their mental models around yield because yield was all that mattered when prices were that high.

    The market changed. The metrics haven’t caught up. That gap is where a lot of facilities are getting quietly destroyed right now.

    How to Actually Think About Yield

    None of this means yield doesn’t matter. It matters a lot. It’s one of the most powerful levers you have for lowering cost per pound. Here’s why: your fixed costs don’t change much from run to run. Rent, staff, equipment payments, those numbers are mostly constant. When you spread those fixed costs across more pounds, your cost per pound drops. That’s real math.

    But that relationship only holds under a few conditions.

    First: the marginal cost of producing those extra pounds can’t exceed what you’re getting for them. If you’re adding labor, nutrients, and energy to chase yield, you need to net out positive after the additional spend.

    Second: you have to hit it consistently. One exceptional run buried in three average runs doesn’t move your annual economics much. Inconsistent yields are one of the most expensive problems in commercial cannabis cultivation, and most operators underestimate how much variance is costing them.

    Third: quality can’t drop. If you’re chasing yield at the expense of trichome density, cure quality, or bag appeal, you might be moving yourself into a lower price tier. More pounds at a lower price per pound is not automatically a win.

    So the hierarchy looks like this:

    1. Cost per pound is the scoreboard. Everything else feeds into this number.
    2. Yield consistency is the multiplier. Reliable results compound over time in a way that one-off runs don’t.
    3. Yield per light is one input. Important, yes. The whole story, no.

    If you want a practical starting point for calculating your own number, here’s how to calculate cannabis cost per pound from your actual operating data.

    The metric hierarchy: cost per pound is the scoreboard, consistency is the multiplier, yield per light is one input.
    The metric hierarchy: cost per pound is the scoreboard, consistency is the multiplier, yield per light is one input.

    The Shift That’s Already Happening

    Michigan wholesale was around $800 per pound in 2024. By 2026 it’s estimated closer to $500. That’s not a blip. That’s a structural compression that reflects what happens when supply outpaces demand and licensing keeps expanding.

    Consider two growers running identical facilities with identical results.

    Grower A tracks yield per square foot. Their numbers are steady. They feel fine. They’re running good rooms.

    Grower B tracks cost per pound. They’re watching their margin shrink from $200 per pound to $75 per pound over 18 months. They know exactly where the pressure is coming from. They’re already running efficiency projects: tightening their trim labor, renegotiating their supply contracts, working on batch-over-batch consistency to get more out of the same infrastructure.

    Same facility. Same results. Completely different level of awareness. Completely different trajectory.

    The facilities that are going to survive consolidation won’t necessarily be the ones pulling the most pounds per light. They’ll be the ones who know what every pound actually costs to produce, and who are systematically working to bring that number down. Batch-over-batch improvement is how that happens at scale. Small, consistent gains compound into a real cost structure advantage.

    Start With Your Actual Numbers

    You don’t need perfect accounting software to start getting honest about cost per pound. Start simple. Add up your five biggest monthly costs (rent or mortgage, labor, energy, nutrients, equipment payments) and divide by the pounds you produced last month. That’s your floor. It’s probably higher than you think. Refine from there as you capture more of your actual spend.

    Once you know that number, yield metrics start to mean something. You can ask: if I improve yield consistency by 10% without adding cost, what does that do to my cost per pound? What if I reduce trim labor by reducing larf through better canopy management? Now you’re doing real analysis, not just comparing output numbers.

    Yield per square foot is a fine data point. It should sit in a dashboard alongside cost of goods, labor per pound, and consistency run-over-run. The moment it becomes your primary metric, you’ve optimized for the wrong thing.

    The cannabis market has no patience left for operations running on vibes and output numbers. The operators who make it through this compression will be the ones who started treating their grow like the business it is.

    Frequently Asked Questions

    Is yield per square foot a useful metric?

    Yes, but only in the context of cost per pound. High yield with high costs can be less profitable than moderate yield with lean operations. Use yield per light as one input, not the final verdict on how your cannabis facility is performing.

    What is a good cost per pound for cannabis?

    It depends on your state, facility type, and current wholesale price. In Michigan’s 2026 wholesale market estimated around $500 per pound, you need to be producing under $400 per pound to survive, and under $350 per pound to start building real margin. Operators above $420 per pound at current prices are in a difficult position regardless of what their yield numbers look like.

    How do I start tracking cost per pound?

    Start with your five biggest fixed costs: rent or mortgage, labor, energy, nutrients, and equipment depreciation. Add them up for the month, then divide by the pounds you produced. That’s your starting number. It won’t be perfect, but it will be more useful than any yield metric you’re currently tracking. Refine it over time as you capture more of your real spend.

    ๐Ÿ“Š Free Tool: Cannabis Cost Per Pound Calculator
    Know your number before you try to lower it. Our free cost per pound calculator has 27 expense categories, tax presets for major states, and what-if yield modeling. No signup required.

    Growgoyle.ai helps you attack cost per pound through better yields, tighter consistency, and a clear picture of what’s working in every run. Upload a few canopy photos and see what the AI catches in 60 seconds. No signup required. Try it on your own plants.

    About the Author

    Eric is a 15-year software engineer who operates a commercial cannabis cultivation facility in Michigan. He built Growgoyle to solve the problems he faces every day: inconsistent yields, forgotten lessons from past runs, and the constant pressure to lower cost per pound. Every feature in Growgoyle comes from real growing experience, not a product roadmap.

  • Yield Is Not the Enemy of Quality in Cannabis

    Yield Is Not the Enemy of Quality in Cannabis

    Yield Is Not the Enemy of Quality in Cannabis (The Science Says So)

    Post a big yield number in any cannabis forum and watch what happens. Someone will call it biomass. Someone will say you sacrificed quality for quantity. Someone will imply that real craft growers don’t chase numbers. It’s one of the most deeply held beliefs in this industry. And it’s wrong.

    Not “wrong in some philosophical sense.” Wrong as in peer-reviewed, replicated research wrong. The idea that cannabis yield and quality exist on a seesaw, that more of one means less of the other, is a myth. And like most persistent myths, it’s built on a kernel of truth that got overgeneralized into a rule nobody bothered to question.

    Let’s pull this apart.

    Where the Myth Came From

    To be fair, the cannabis yield vs quality belief didn’t come from nowhere. There are real scenarios where chasing weight tanked quality, and growers learned from that experience.

    In outdoor and greenhouse production, plant density matters. Push too many plants into suboptimal light and you’re not giving each one enough photons to build dense, resinous flower. More plants, same light, same canopy, something gives. Per-plant yield drops and so does quality because the resources weren’t there to support either.

    Home growers learned this the hard way. Overfed, over-stressed plants pumped to hit weight targets often produced airy, harsh flower. The association between chasing numbers and compromised quality got baked in early.

    Then there’s the large-scale commercial side. Many large cannabis operations, especially the early multi-state operators, genuinely did cut corners. Mediocre genetics, inconsistent environments, rushed dry rooms, thin teams stretched too far. The output was high volume and low quality, and the market noticed. That association between “big” and “bad” stuck.

    Add in craft branding that has spent years equating small batches with quality. Some of that is earned. Some of it is just marketing. But it reinforced the idea that the grower who cares about quality keeps things small and doesn’t worry about yield.

    The problem is, none of that is about yield itself. It’s about bad process. And the science makes that very clear.

    What the Research Actually Shows

    In 2021, Rodriguez-Morrison and colleagues at the University of Guelph published a study on cannabis grown under light intensities ranging from 120 to 1,800 micromoles per square meter per second. That’s a massive range, from dim to extremely bright. The goal was to understand how DLI affects cannabis yield and quality metrics simultaneously.

    What they found should put the tradeoff myth to rest.

    Yield increased 4.5x from the lowest to the highest light intensity. Significant. But cannabinoid potency? No statistically significant change at any light level. Terpene content didn’t drop. Total terpene potency actually showed a modest increase with higher light, driven mainly by myrcene and limonene. Bud density improved. Harvest index improved. More light delivered more yield AND better physical quality metrics, with zero loss in potency. (Rodriguez-Morrison et al., 2021)

    These weren’t backyard experiments. This was peer-reviewed research published in Frontiers in Plant Science.

    A year later, Llewellyn and colleagues from the same lab published a follow-up using a high-THC cultivar called Meridian, a strain testing above 20% THC. They compared 600 versus 1,000 micromoles per square meter per second. Yield came in 1.6x higher at the higher intensity. Cannabinoid concentrations? No significant effect. Terpene concentrations? No significant effect. The plant simply produced more flower at identical quality. (Llewellyn et al., 2022)

    Two separate studies, peer-reviewed, replicated findings: more light drives more yield, and quality doesn’t follow it down. The cannabis potency yield tradeoff, under controlled conditions with good process, doesn’t exist.

    That’s worth sitting with for a minute.

    So Why Does Quality Drop When Growers Push Yield?

    This is the actual question. If the science shows no inherent tradeoff, why do growers experience one?

    Because something else broke. Specifically:

    Environmental control couldn’t keep up. A bigger canopy produces more transpiration. If your HVAC isn’t sized for it, or your airflow isn’t dialed, humidity climbs. VPD goes out of range. You get uneven canopy conditions, hot spots, stagnant air pockets, inconsistent leaf surface temps. That’s not yield causing quality problems. That’s the environment failing to scale with the grow.

    Feed programs weren’t adjusted. Higher light intensity means higher photosynthesis rates, higher metabolic demand, more water and nutrient uptake. If your fertigation schedule is built for lower canopy productivity and you didn’t adjust it, you’re either underfeeding or running drybacks that don’t match what the plant actually needs. That stresses the plant, and stressed plants at the wrong time compromise bud development.

    The dry room became the bottleneck. This is the one nobody talks about enough. More wet weight going into the same dry room means longer dry times, or the temptation to rush it. Rushing dries destroys terpenes. It also creates texture problems, brittle flower that turns to powder in the bag. Terpene loss in drying is one of the most common quality failures in commercial cannabis cultivation, and it has nothing to do with how much the plants yielded. It’s a dry room process failure.

    Team capacity didn’t scale. More canopy with the same crew means less attention per plant. IPM issues get caught later. Irrigation problems go unnoticed. Training and pruning slip. Problems that a well-staffed team would catch early become harvest-time surprises. That’s an operational problem, not a yield problem.

    Every one of these is a process variable. None of them is an inherent consequence of high cannabis yield. The yield didn’t cause the quality drop. The failure to adjust process to support the yield caused it.

    What Actually Drives Quality

    When you strip away the process failures, quality in cannabis comes down to a pretty short list.

    Genetics. The ceiling. You can’t extract what the plant doesn’t have. Strain selection sets your maximum potential potency, terpene profile, and bud structure. Nothing you do in the grow room adds cannabinoids that genetics don’t allow.

    Environmental consistency. The floor. Not just hitting target VPD numbers, but holding them tight across the entire canopy throughout the entire cycle. A room that averages the right temp/RH but swings wildly is worse than a room that runs slightly off but stays steady. Consistency across the canopy is what allows every flower site to develop uniformly.

    Drying and curing. This is where most quality is actually made or lost. Properly dried cannabis (hitting the right moisture content at the right rate, then curing long enough to stabilize) is where the terpene profile gets locked in or destroyed. Most commercial cannabis quality complaints trace back here, not to the grow room.

    Harvest timing. Too early and you leave cannabinoid development on the table. Too late and THC degrades to CBN, terpenes volatilize, and you’re selling a different product than what the plant was capable of producing.

    Notice what’s not on this list: yield targets. None of these quality drivers are in conflict with pulling high numbers from your cannabis grow room. A properly dialed room produces excellent genetics under consistent environmental conditions, harvested at the right time, dried correctly. The output of that room can be high yield AND high quality. Those aren’t competing outcomes.

    The Real Flex: Doing Both, Consistently

    Here’s where craft growers and production growers should actually find common ground, because both sides of this debate often miss the same point.

    One big run proves nothing. One batch with exceptional lab results and strong yield is data, not a system. The growers who are actually dominating, in any segment of this market, aren’t choosing between yield and quality. They’re dialing in their process so both improve together, run after run.

    Consistency is the multiplier. Hitting strong numbers once might be luck, good genetics, or a favorable environment that month. Hitting those same numbers five runs in a row on the same strain? That’s process. That’s a system. That’s what you can build a business on.

    The best commercial cannabis growers I know don’t brag about their biggest run. They brag about their tightest standard deviation.

    Craft growers: small batches with meticulous process produce excellent cannabis. That’s true. But “small” isn’t what’s doing the work. “Meticulous process” is. Scale that same process, maintain that same environmental discipline, and there’s no scientific reason the quality drops. The challenge is operational, not botanical.

    Production growers: yield is a business metric, not a quality substitute. Hitting high numbers in your cannabis cultivation facility means nothing if lab results are inconsistent, moisture content varies batch to batch, or your trim ratio is all over the place. Both metrics matter. Track both.

    High yield high quality cannabis isn’t a contradiction in terms. It’s a process problem that’s been misidentified as a fundamental tradeoff. The research is clear. The mechanism makes sense. What remains is building the operational systems that support both outcomes simultaneously, and being honest with yourself when the data shows you which variable is actually slipping.

    That’s the work. And it’s worth doing.


    Growgoyle.ai tracks both yield AND quality metrics across every run: Goyle Score, lab results, trim ratio, environmental consistency, so you can see exactly where you’re winning and where process is costing you. It doesn’t ask you to choose between yield and quality. It helps you improve both. See what the AI sees in your canopy photos – no signup required.


    Growgoyle.ai helps you close the gap between your best run and your worst. AI-powered batch analysis, run-over-run comparison, and photo diagnostics that keep every cycle on track. Built by a grower who got tired of guessing. See what the AI sees in your canopy photos – no signup required.

    About the Author

    Eric is a 15-year software engineer who operates a commercial cannabis cultivation facility in Michigan. He built Growgoyle to solve the problems he faces every day: inconsistent yields, forgotten lessons from past runs, and the constant pressure to lower cost per pound. Every feature in Growgoyle comes from real growing experience, not a product roadmap.

  • Beyond METRC: Compliance Software Isn’t Grow Management

    Beyond METRC: Compliance Software Isn’t Grow Management

    Beyond METRC: Why Compliance Software Isn’t Cannabis Grow Management

    If someone asked what software you use to manage your cannabis grow and you said “METRC” or “Dutchie”, I get it. I said the same thing for a while. But that’s a little like saying your accounting software is your business strategy. They’re both on your computer. They both involve numbers. They’re not the same thing, and confusing them is quietly costing you yield.

    This isn’t a knock on compliance tools. I want to be clear about that upfront. METRC is legally required in most states, it works, and the teams that built these platforms solved a genuinely hard problem: giving regulators real-time visibility into cannabis inventory across thousands of licenses. That’s not easy. They did it. But what those tools are built to do and what you actually need to run a better cannabis cultivation operation are two different things entirely.

    What Compliance Software Actually Does, and Does Well

    Seed-to-sale compliance platforms like METRC, BioTrack, and the point-of-sale tools built around them (Dutchie, Leaflogix, etc.) are designed to satisfy one core requirement: state reporting. They track plant counts, inventory weights, transfers between licenses, lab test results, package labeling, and manifests. Every tag, every transfer, every destruction event, documented and reported.

    That’s not optional. It’s not something you can DIY with a spreadsheet. These systems exist because regulators need a chain of custody that holds up to an audit, and if you’re operating a licensed cannabis facility, you already know what it costs when your compliance data is off. Fines. License risk. Headaches you don’t need.

    So compliance software does what it’s supposed to do, and it does it well. Use it. Maintain it. Don’t cut corners with it. But understand what it actually is: a reporting layer between your operation and the state. It’s not looking out for you. It’s looking out for regulators.

    What Compliance Software Doesn’t Do

    Here’s where growers get into trouble. Because they have software, real software, software they pay for and log into every day, it creates a false sense that the data problem is solved. “We track everything in METRC.” Sure. But does METRC tell you:

    • Why Room 2 pulled 15% less than Room 1 last cycle with the same strain?
    • Whether your drying process is costing you sellable weight across multiple runs?
    • How this batch compares to your last five runs of the same cultivar?
    • What specifically changed in the runs where your quality dropped?
    • What to do differently on the next run to get closer to your genetic ceiling?

    It doesn’t. And it’s not supposed to. METRC knows you harvested 60 lbs and it tested at 28% THC. It does not know, and has no interest in knowing, whether that yield was limited by your VPD in weeks 4 through 6, or whether you’re consistently losing 12% of your harvest weight to an aggressive dry schedule, or whether the strain you’re running just needs two more weeks of veg to hit its potential in your specific environment.

    That’s not a flaw in compliance software. That’s just not what it does. The flaw is thinking it does.

    The Dangerous Assumption: “We Have Software”

    I’ve talked to plenty of cannabis cultivators who, when asked how they track performance and improve from run to run, say something like, “Oh, we’re all in METRC.” And they mean it sincerely. They’re not being evasive. They genuinely believe that having a compliant, well-maintained compliance system means they have grow management handled.

    That assumption has a real cost. Because compliance data tells you WHAT happened. You harvested X pounds. Your tests came back at Y%. Your transfer went to Z facility. It does not tell you WHY, was it the environment? The feed? The dry? A pathogen that got ahead of you in week 3? And it absolutely does not tell you HOW TO DO BETTER next time.

    In commercial cannabis cultivation, the metric that determines whether you’re viable is cost per pound. Every input (labor, nutrients, electricity, square footage, water) divided by the sellable weight you put out the door. Compliance software does not move that number. It records outcomes. It doesn’t explain them, and it doesn’t help you improve them.

    Running a cannabis facility without actual grow management software isn’t running lean. It’s flying blind with a very organized flight log.

    The Tax Analogy That Finally Made It Click for Me

    The way I eventually got my head around this distinction: think about how you manage your business finances.

    QuickBooks (or whatever accounting software you use) tracks your money. Revenue in, expenses out, payroll, depreciation, all of it. It’s accurate. It’s useful. It’s required for taxes. But QuickBooks does not tell you how to make more money. It does not look at your P&L and say, “Hey, your labor costs in Q3 spiked 18% and that correlates directly to your revenue dip, here’s what changed and here’s what to do about it.” It just shows you the numbers.

    A good financial advisor does that second part. They look at your actual data, find the patterns, and give you specific guidance: cut this, invest more there, restructure that. It’s the difference between a record of what happened and an analysis of what it means.

    METRC is QuickBooks for cannabis. It keeps the books. Cannabis cultivation intelligence is the advisor, the layer that takes your actual grow data and turns it into something actionable.

    You need both. They’re not interchangeable.

    What Actual Cannabis Grow Management Looks Like

    So what should real cannabis grow management software actually do? From where I sit, it comes down to a few things that compliance tools will never do by design.

    Batch-level tracking with context. Not just “you harvested X lbs” but what was the environment during that run? What was your feed program? What was your DLI profile? What did the plants look like at week 5? Outcome data without context data is almost useless when you’re trying to diagnose a drop in performance.

    Pattern recognition across runs. One data point is an anecdote. Ten data points across the same strain start to show you something real. If your yields are consistently lower in Room 2 and you’ve run it 15 times, there’s a pattern there, but you can only see it if you’re capturing and comparing the right data across batches.

    Differential diagnosis. When something goes wrong in your cannabis grow room (tip burn, nutrient lockout, light stress, a pathogen), there are usually multiple possible causes. Good grow management tools should help you think through the actual differential rather than jumping to the first obvious answer. That’s how experienced master growers think, and it’s how good software should work too.

    Actionable recommendations specific to your operation. Not generic “best practices” from a blog post. Actual guidance based on your data, your environment, your history. “Your last three runs of this strain show yield declining in weeks 6-7. Your environment data points to elevated VPD during that window, tighten that up next cycle.”

    Honest scoring against yourself. Not industry benchmarks that may or may not apply to your facility, your market, your genetics. Your Rooms, your Runs, your trends over time. Getting better at your own game is what matters.

    That’s the category of tool that actually helps you lower cost per pound. It’s not competing with METRC. It’s doing something METRC was never designed to do.

    Where This Shows Up in the Real World

    I’ve seen this play out in a few ways at my own facility and in conversations with other cannabis cultivators. The most common one: a grower will have a great run, then a mediocre run of the same strain, and genuinely not know why. They’ll go back through their METRC records. They’ll see the harvest weights. They’ll see the test results. And there’s nothing in there that explains the difference, because METRC never captured the environment data, the feed adjustments, the mid-cycle photo that showed early mag deficiency, or the fact that they changed their dry room setup between those two runs.

    All of that context lives in someone’s head, in a text thread, or nowhere. And the next run starts without any real understanding of what drove the variance.

    That’s a solvable problem. It requires actually tracking runs, not just for compliance, but for cultivation intelligence. It requires capturing the data that explains outcomes, not just the outcomes themselves. And it requires analysis that tells you what to do with that data, not just a spreadsheet that stores it.

    The cannabis cultivators who are going to win in this market long-term are the ones who figure this out. Compliance is table stakes. Cultivation intelligence is the actual competitive edge.

    The Bottom Line

    METRC and seed-to-sale compliance tools are essential. Use them, maintain them, take them seriously. But don’t confuse them with cannabis grow management software. They tell your state what you grew. They don’t tell you how to grow better. Those are completely different tools solving completely different problems, and treating one as a substitute for the other is leaving real money on the table.

    If you can’t answer “why did this run underperform?” from your current data, you don’t have grow management. You have compliance. There’s a difference, and it shows up in your cost per pound.


    Growgoyle.ai is cannabis cultivation intelligence, not a compliance tool, not a sensor dashboard, not a grow diary. It’s AI-powered batch analysis that tells you what drove your results, what to change, and what your next run should look like based on your own data. METRC tells your state what you grew. Growgoyle tells you how to grow better. They’re not the same tool, and you need both. See what the AI sees in your canopy photos – no signup required.


    Growgoyle.ai helps you close the gap between your best run and your worst. AI-powered batch analysis, run-over-run comparison, and photo diagnostics that keep every cycle on track. Built by a grower who got tired of guessing. See what the AI sees in your canopy photos – no signup required.

    About the Author

    Eric is a 15-year software engineer who operates a commercial cannabis cultivation facility in Michigan. He built Growgoyle to solve the problems he faces every day: inconsistent yields, forgotten lessons from past runs, and the constant pressure to lower cost per pound. Every feature in Growgoyle comes from real growing experience, not a product roadmap.

  • Michigan Cannabis Wholesale Price Trends 2026

    Michigan Cannabis Wholesale Price Trends 2026

    Michigan Cannabis Wholesale Price Trends 2026: What the Numbers Actually Look Like

    If you’re growing cannabis in Michigan right now, you don’t need me to tell you the wholesale market is rough. You’re living it. But let’s talk about what the numbers actually look like in 2026, and more importantly, what the operators who are surviving have in common. Because there are growers making it work out here. They’re just not doing it by hoping prices recover.

    How Michigan Cannabis Got Here: The Price Compression Story

    Michigan went from a limited medical market to a wide-open recreational program in a pretty compressed timeframe. In the early rec days, 2020 and into 2021, you could move indoor flower at $3,000 a pound and people were paying it. Licenses were constrained, demand was strong, and operators were printing money. That window lasted maybe 18 months.

    Then the licenses caught up. Then outdoor and greenhouse operations scaled. Then everyone who saw the margins piled in. Classic commodity compression. It’s the same thing that happened in Colorado, Oregon, California. Michigan just happened later.

    What accelerated the floor dropping wasn’t just more indoor coming online. It was cheap biomass flooding in from outdoor and light dep grows. When you’ve got greenhouse operators moving bulk at $150 a pound, it pulls everything below it down. Dispensaries aren’t dumb. They know what the market looks like, and they’ll use it in every negotiation you have.

    The Michigan cannabis market in 2026 is not a bad market. It’s just a real market. The fantasy pricing is gone and it’s not coming back.

    Where Michigan Cannabis Wholesale Prices Actually Sit in 2026

    I’m not going to point you to some report with state averages, because state averages are useless. What matters is what you can actually move product for based on quality and relationship. Here’s what I’m seeing:

    • Premium indoor, top-shelf: $800 to $1,200 per pound. Strain matters. Relationship matters. Consistency matters. If you can reliably deliver the same quality run after run, there are buyers who will pay for that. But $1,200 is the ceiling and most people aren’t hitting it most of the time.
    • Mid-grade indoor: $500 to $800 per pound. This is where the majority of Michigan cannabis growers are getting paid. Decent quality, inconsistent execution, average yields. Not bad work, but thin margins at current price points.
    • Biomass and trim: $100 to $300 per pound. If you’re growing outdoor or selling extraction-grade material, this is your world. Volume game. Brutal.

    If someone is quoting you prices significantly above these ranges, they’re either moving something exceptional, they have a very unusual buyer relationship, or they’re not being straight with you. The days of moving average indoor at $1,500 are done.

    Who’s Getting Squeezed

    The Michigan cannabis operations struggling most right now tend to share a few characteristics.

    The first group is facilities that expanded aggressively during the boom. If you built or leased a big space when the market was hot, took on debt to do it, and based your pro forma on $2,000-per-pound wholesale, your numbers don’t work anymore. Your fixed costs are what they are. The market doesn’t care about your lease.

    The second group is growers who can’t consistently produce top-shelf quality. Premium pricing holds better than mid-grade because there are dispensaries who need reliable premium product and can’t always find it. But you have to actually hit the standard, every run. Not one great run followed by two mediocre ones. Consistent premium is a defensible position. Inconsistent premium isn’t worth much to a buyer.

    The third group is operations with high cost per pound who got comfortable. When margins were fat, sloppy operations still made money. When margins compress to $100 to $200 per pound, every inefficiency shows up. Overdrying losses, low yields, wasted inputs, labor inefficiency. It all hits your cost per pound and there’s less room to absorb it.

    Who’s Actually Surviving

    The Michigan cannabis growers I know who are doing fine in this market share some common traits. None of them have a secret strain. None of them found a magic buyer paying above-market. They’re surviving because of how they operate.

    Low cost per pound is the foundation. These are facilities that run tight, know their numbers, and don’t waste anything they don’t have to. Consistent yields across runs, not chasing one monster batch. Good environmental control that doesn’t cost a fortune to maintain. Low overhead relative to production capacity.

    Consistent quality is the other piece. Buyers have choices right now. The ones paying premium prices are doing it because they need reliable supply they can count on. If you’re delivering inconsistent quality, you’re competing on price with every other inconsistent grower. That’s a race to the bottom.

    Small to mid-size operations with manageable overhead are also faring better than the big builds in a lot of cases. Less debt service, more flexibility, lower break-even. Simpler isn’t always worse in a tight market.

    The Math That Actually Matters for Michigan Cannabis Growers

    Let me show you the math that keeps me up at night, because it should be on your radar too.

    Say your cost per pound all-in is $600. At $800 wholesale, you’re making $200 per pound margin. Not great, but survivable depending on your scale and overhead.

    Now wholesale drops to $700. That happens. It’s been happening. Your margin just went from $200 to $100 per pound. You cut your profitability in half without changing a single thing about how you operate.

    Here’s the other side of that math. If you reduce your cost per pound by $100 through better yields, less waste, tighter operations, that $100 is worth exactly the same as wholesale going UP by $100. It’s the same dollar hitting your bottom line. The difference is that you control your cost per pound. You do not control wholesale.

    The Michigan cannabis market will do what it does. Prices might stabilize. They might drop further. More outdoor supply will come online. More licenses will be issued. Retail consolidation will keep putting pressure on wholesale buyers to drive prices down. None of that is in your hands.

    What is in your hands is your cost per pound. And specifically, the yield and consistency side of that equation. If you’re losing pounds to overdrying, you can fix that. If your yields are swinging 20% run to run, you can tighten that. If the same environmental patterns keep showing up every other cycle, the data can break that loop.

    What Smart Michigan Cannabis Growers Are Doing Right Now

    The operators I respect out here are not waiting for the market to turn. They’re treating every batch as a data point, not a one-off event.

    They’re tracking batch performance seriously. Not just what they yielded, but why. What was VPD doing in weeks 4 and 5? Did the dryback protocol drift? How did this run compare to the last one with the same genetics? If you’re not tracking it, you’re just guessing, and every run is starting from zero.

    They’re focused on consistency, not just chasing the one monster run. A consistent 35 grams per square foot every cycle is worth more than 45 one time and 25 the next. Buyers want to know what they’re going to get. Your cost per pound is a function of your average yield, not your best yield.

    They’re paying attention to drying. This is the easiest pound to recover. Overdrying cannabis is one of the most common and most expensive mistakes in Michigan indoor grows. You grew the weight and then you dried it away. Getting drying dialed in has a direct and immediate impact on what you’re actually selling.

    And they’re comparing runs side by side with intention. Not just “that was a good run” or “that one was rough.” Actually looking at what was different. What changed? What held? Which practices are worth repeating and which ones were flukes?

    The growers who build that feedback loop into their operation are the ones who get better over time instead of just grinding out runs and hoping for the best.

    Where This Market Goes

    Honestly? I don’t think Michigan cannabis wholesale prices recover significantly. There’s too much supply coming and the retail market isn’t expanding fast enough to absorb it. Some consolidation will happen. Some operators will exit. That might create some breathing room at the premium end of the market.

    But the floor is the floor. If you’re running a cannabis cultivation operation in Michigan and your plan is to outlast the bad pricing and wait for $1,500 wholesale again, I think you’re in for a long wait with a lot of pain in between.

    The plan that works is getting your cost per pound down and your quality consistency up. Every batch, better than the last one. Not dramatically better, just measurably better. That’s how you build a sustainable operation in a compressed market.

    The operators who survive this market will be the ones who treated it as a signal to get sharper, not a problem to wait out.


    Growgoyle.ai was built by a Michigan cannabis grower because the market forces you to operate smarter, not just harder. Photo analysis, batch scoring, run-over-run improvement tracking. Every feature is aimed at one thing: getting your cost per pound down by helping you yield more, waste less, and repeat what works. The market isn’t getting easier. The only move is getting better, batch after batch. See what the AI sees in your canopy photos – no signup required.


    Growgoyle.ai helps you close the gap between your best run and your worst. AI-powered batch analysis, run-over-run comparison, and photo diagnostics that keep every cycle on track. Built by a grower who got tired of guessing. See what the AI sees in your canopy photos – no signup required.

    About the Author

    Eric is a 15-year software engineer who operates a commercial cannabis cultivation facility in Michigan. He built Growgoyle to solve the problems he faces every day: inconsistent yields, forgotten lessons from past runs, and the constant pressure to lower cost per pound. Every feature in Growgoyle comes from real growing experience, not a product roadmap.

  • Best Seed-to-Sale & Cultivation Software for Cannabis (2026)

    Best Seed-to-Sale & Cultivation Software for Cannabis (2026)

    Best Cannabis Cultivation Software in 2026 (An Honest Review)

    New to cultivation software? Start with our complete guide to the three categories of cannabis cultivation software to understand what you actually need before comparing products.

    Every few months someone posts in a growers forum asking for the “best cultivation software.” The thread fills up fast, people swearing by their sensor dashboard, compliance guys saying nothing beats their seed-to-sale system, a few folks pushing whatever their sales rep just demoed. Nobody agrees. And the reason nobody agrees is that everyone is solving a different problem.

    There is no best cannabis cultivation software. There are tools that solve different problems. The right stack depends on what you actually need, and those two things are not the same question at the same facility.

    I’m a software engineer who runs a licensed commercial cannabis facility in Michigan. I’ve used a lot of these tools, watched colleagues use others, and sat through more software demos than I care to count. What follows is an honest breakdown of each category: what it actually does, when you need it, and what it doesn’t do. Including where Growgoyle fits, and where it doesn’t.

    The most important thing to understand:

    Seed-to-sale software is compliance software. It tracks where your plants are for the state. It does not help you grow better, improve your yields, or lower your cost per pound. If someone is selling you “seed-to-sale” as a cultivation tool, they are selling you a compliance tool with a grow journal bolted on.

    Cannabis Software Categories at a Glance

    Category What It Does Top Platforms Required?
    Seed-to-Sale Compliance Plant tracking, METRC reporting, manifests, regulatory compliance Canix, Dutchie, BioTrack, Flourish Yes (in most states)
    Sensor Dashboards Real-time temp, RH, VPD, CO2 monitoring and alerts Pulse, Trolmaster, Growlink, SensorPush Strongly recommended
    Equipment Automation HVAC control, irrigation scheduling, lighting automation Trolmaster, Growlink, Argus, IntelliGrow Scale-dependent
    Grow Tracking Batch logging, activity journals, schedule management Trym, GrowFlow Helpful
    Cultivation Intelligence AI batch analysis, photo diagnostics, yield improvement recommendations Growgoyle Highest ROI for yield improvement
    Cannabis software categories comparison: seed-to-sale compliance vs sensor dashboards vs equipment automation vs grow tracking vs cultivation intelligence
    The five categories of cannabis software serve different purposes. Most commercial operations need at least three.

    Category 1: Compliance and Seed-to-Sale Tracking

    What these tools do: Track plant and inventory counts, integrate with METRC, generate regulatory reports, manage manifests and transfers. In most states, this category of software is not optional. It’s the law.

    Names you’ll see: Dutchie (formerly LeafLogix), BioTrack, Flourish, METRC direct entry.

    Honest assessment: You need one of these. Full stop. That’s not really a software evaluation. It’s a license condition. Pick the one your team can actually use without wanting to throw their laptop out the window, because data entry compliance is only as good as the people doing the entry.

    What compliance software does not do: make your grows better. It’s not supposed to. It was designed to satisfy regulators, not optimize your operation. The moment you start expecting Dutchie to tell you why your last batch underperformed, you’re asking the wrong tool the wrong question.

    Seed-to-Sale Platform Comparison (2026)

    Platform METRC Cultivation Features Pricing Best For
    Canix Yes (direct API) Basic batch tracking, harvest records Demo required Mid-size operations wanting clean UI + compliance
    Dutchie Yes (direct API) Minimal (dispensary-first) Demo required Vertically integrated ops (dispensary + grow)
    BioTrack Yes (state-mandated in some markets) Basic inventory tracking Varies by state Operations in BioTrack-mandated states
    Flourish Yes (direct API) Batch tracking, cultivation logs Demo required Multi-license operations needing full compliance
    METRC Direct Entry Native (it IS the state system) None Free (state-provided) Small operations doing manual entry

    Key limitation across all seed-to-sale platforms: These tools track that you harvested a certain weight. They do not analyze why that weight was higher or lower than your last run, or what to change next time.


    Category 2: Sensor Dashboards and Environmental Monitoring

    What these tools do: Display real-time environmental data: temperature, relative humidity, VPD, CO2, light levels. Log historical readings. Send alerts when values cross thresholds you configure.

    Names you’ll see: Pulse, Trolmaster (monitoring side), Growlink (monitoring side), Trym.

    Honest assessment: Useful. Genuinely useful. If you’re still walking rooms with a handheld meter and keeping notes in a notebook, a sensor dashboard is a meaningful upgrade. Real-time VPD visibility alone is worth it for most operations.

    But a dashboard shows you data. It doesn’t analyze it. Knowing your room hit 84ยฐF on day 18 of flower tells you something happened. It doesn’t tell you how much yield that cost you, whether the strain you’re running is more sensitive to heat stress than your previous one, or whether that spike happens to correlate with a HVAC pattern you could actually fix. The data is there. The interpretation is still on you.

    Sensor dashboards give you visibility. Visibility is a prerequisite for improvement, not improvement itself.


    Category 3: Equipment Automation and Control

    What these tools do: Automate and control HVAC systems, irrigation, lighting schedules. Adjust setpoints automatically. Reduce manual intervention. At scale, they’re significant for consistency and labor efficiency.

    Names you’ll see: Trolmaster, Growlink, Argus, IntelliGrow.

    Honest assessment: Solid infrastructure. If your environment is swinging because someone keeps manually adjusting things and your SOPs aren’t sticking, automation helps a lot. Getting your room to hold a VPD target during lights-on transition without a grower babysitting it is real value.

    What automation doesn’t know: whether your setpoints are right for the strain you’re running in week 6 of flower, or whether the environment you’re dialing in is actually producing better cannabis or just more consistent mediocrity. Automation holds your settings. It doesn’t evaluate them.

    This category also requires the most capital investment and integration work. It makes the most sense at larger scale where the labor savings justify the upfront cost. Smaller operations often get better ROI elsewhere first.


    Category 4: Grow Tracking and Journaling

    What these tools do: Log cultivation activities, track batches through phases, record observations and notes. Basically a structured grow diary with some batch management built in.

    Names you’ll see: Trym, GrowFlow, and a long list of apps that are essentially grow diaries with a better UI than a shared Google Sheet.

    Honest assessment: Better than a whiteboard. If your team is currently tracking batches in a spreadsheet or on paper, any of these is an improvement. Structure and searchability matter when you’re trying to remember what happened three runs ago.

    The limitation is that a log stores information. It doesn’t learn from it. Your tracking software can tell you that you harvested 1.8 lbs/light on run 14. It can’t tell you that run 14 was down from run 11 because your drybacks in late flower were too aggressive, and here’s what you should do differently in run 15. That analysis still lives in your head, or nobody’s doing it at all.

    Most commercial cannabis operations have more historical data than they’ve ever actually used to improve their grows. It’s all sitting in logs, sensor exports, and someone’s memory. That’s a real problem, and tracking tools alone don’t solve it.


    Category 5: Cultivation Intelligence

    What this does: Analyzes batch outcomes against historical data and patterns. Produces specific, actionable improvement recommendations. Enables meaningful comparison between runs. Applies AI analysis to photos for real-time plant assessment. Scores batches across multiple dimensions so you can see where you’re losing yield, quality, or efficiency, and by how much.

    Names you’ll see: Growgoyle. Best for commercial growers who want AI-driven batch analysis, photo diagnostics, and specific yield improvement recommendations after every run. Built by a commercial grower who runs a licensed facility in Michigan, not a software company that interviewed some growers.

    Honest assessment: Cultivation intelligence doesn’t replace any of the categories above. You still need compliance software. Sensors are still valuable. Automation is still useful if the scale makes sense. Grow tracking still matters.

    What cultivation intelligence does is sit on top of all of it and make the data from everything else actually useful. Instead of looking at a dashboard full of numbers and trying to figure out what they mean for your next run, you get a structured analysis: here’s what worked in this batch, here’s what didn’t, here’s what it cost you in estimated yield, here’s what to do differently.

    Growgoyle’s AI photo analysis lets you upload a photo from your phone and get a master grower assessment in about 60 seconds. Differential diagnosis, not just “looks like a deficiency.” It considers multiple possible causes, not just the obvious one. The batch scoring gives you a Goyle Score across Yield, Quality, Environment, Drying, and Efficiency. After every completed run, you get a breakdown with specific improvement estimates tied to specific changes.

    Every grower is scored against their own history. Not against some industry benchmark that may or may not reflect your genetics, your facility, your market. The question isn’t “are you above average.” It’s “are you better than your last run, and why.”

    This category exists because the data problem in cannabis cultivation is not a collection problem. Most facilities are already collecting data. The problem is that nobody’s analyzing it in a way that produces better decisions on the next run. That’s what cultivation intelligence fixes.


    The Right Stack: How to Actually Think About This

    Here’s how I think about it after running this facility for years and watching a lot of other operations:

    Compliance software: Required. Non-negotiable. Pick the one your team will actually use accurately. Don’t let it eat more administrative time than it has to.

    Sensor dashboards: High value for most operations. The visibility you get on VPD, humidity trends, and environmental consistency is worth the cost at almost any scale. Don’t expect it to tell you what the data means. That’s not what it’s for.

    Automation: Situational. At larger scale, the labor efficiency and consistency gains are real. At smaller scale, the capital investment may be better deployed elsewhere. This is the most expensive category to implement well.

    Grow tracking: Useful, but increasingly this is functionality that should be built into your intelligence layer rather than a standalone app. If your tracking tool isn’t connecting your historical data to your current decisions, it’s an expensive notebook.

    Cultivation intelligence: This is where I think most commercial cannabis operations are leaving the most money on the table. The data exists. The analysis isn’t happening. Cost per pound is the number that determines survival in this market, and cultivation intelligence is what moves cost per pound down by improving yield consistency and efficiency run over run.

    A reasonable stack for a mid-size commercial cannabis operation in 2026 looks like: one compliance tool (required), one sensor platform for visibility, and one cultivation intelligence tool to make the rest of your data actually produce decisions. Automation on top of that when the scale justifies it.

    What it doesn’t look like is six different apps that each do one thing and don’t talk to each other, leaving your head grower to synthesize everything manually and hope they’re drawing the right conclusions.

    Recommended Software Stack by Operation Size

    Operation Size Compliance Environment Intelligence Automation
    1-4 flower rooms METRC direct or Canix Pulse or SensorPush Growgoyle Core Optional
    5-10 flower rooms Canix or Flourish Pulse + automated ingest Growgoyle Pro Recommended
    10+ rooms / multi-facility Canix, Flourish, or Dutchie Full sensor network Growgoyle Pro (custom) Strongly recommended

    One More Honest Thing

    The reason nobody can agree on the “best cannabis cultivation software” in those forum threads is that people are comparing tools from completely different categories. Pulse and Growgoyle are not competitors, they solve different problems. Dutchie and Trym are not competitors. Argus and a grow diary app are not the same kind of tool.

    When you’re evaluating cannabis grow management software, start by being honest about which problem you’re actually trying to solve. If compliance is a mess, that’s the fix. If you have no visibility into your environment, sensors come first. If you’ve got all the data and still can’t figure out why one run outperforms another, that’s a cultivation intelligence problem.

    Buy for the problem you have, not for the demo you just saw.


    Growgoyle.ai is cultivation intelligence: AI-powered batch analysis, photo diagnostics, and improvement recommendations built specifically for commercial cannabis growers. If you’re evaluating cultivation software and want to see whether the output is actually useful, try it free for 7 days. No credit card required, no sales call, no demo. Just connect a batch and see what it finds.

    Frequently Asked Questions

    What is the best seed-to-sale software for cannabis in 2026?

    It depends on what problem you’re solving. If your primary need is state compliance and METRC integration, platforms like Canix, Dutchie (formerly LeafLogix), and BioTrackTHC handle that well. If you’re focused on improving yields and lowering cost per pound, you need cultivation intelligence software that analyzes your grow data and tells you what to do differently. Most operations need both: a compliance platform for regulators, and a grow management or intelligence tool for the actual cultivation.

    What is the difference between seed-to-sale software and cultivation management software?

    Seed-to-sale software tracks inventory and regulatory compliance: plant tags, transfers, waste, and state reporting through systems like METRC or BioTrack. Cultivation management software tracks what actually happens in the grow: environment data, feeding schedules, yields, and batch performance. They solve different problems. Seed-to-sale keeps you legal. Cultivation management helps you grow better. Some platforms try to do both, but most do one well and the other poorly.

    Do I need METRC-integrated software?

    If you operate in a METRC state (Michigan, California, Colorado, Oklahoma, and others), you need some way to report to METRC. Whether that’s a dedicated seed-to-sale platform or direct METRC portal access depends on your volume. Operations processing more than a few transfers per week generally benefit from integrated software that reduces manual entry errors and saves time.

    What is cultivation intelligence software?

    Cultivation intelligence software analyzes your grow data (environment readings, photos, yields, lab results) and gives you specific recommendations to improve. Instead of just showing you dashboards, it tells you what to change and why. Think of it as the difference between a thermometer and a doctor: one shows you a number, the other tells you what to do about it.

    Can I use multiple types of cannabis software together?

    Yes, and most serious commercial operations do. A typical stack might include a seed-to-sale platform for compliance, a sensor dashboard for real-time environment monitoring, and a cultivation intelligence tool for batch analysis and improvement recommendations. The key is making sure they don’t create duplicate data entry. Look for platforms that can import data from your existing sensors and systems rather than requiring their own hardware.

    How much does seed-to-sale software cost in 2026?

    Seed-to-sale compliance software pricing varies widely and most platforms require a demo for quotes. Canix, Dutchie, and Flourish all require demos before sharing pricing. BioTrack pricing depends on your state contract. METRC direct entry is free but labor-intensive. Budget $200 to $1,000+ per month depending on your license count, state requirements, and whether you need the dispensary POS side. The real cost of seed-to-sale software is often the staff time for data entry, not the subscription itself.

    What is the difference between seed-to-sale software and AI cultivation software?

    Seed-to-sale software tracks plant inventory for state compliance: tag numbers, transfer manifests, waste logs, and METRC reporting. It tells regulators what you grew and where it went. AI cultivation software (also called cultivation intelligence) analyzes your grow data and tells you how to grow better: what caused yield differences between runs, what your canopy photos reveal about plant health, and specific changes to make on your next batch. One keeps you legal. The other lowers your cost per pound. Most serious commercial operations use both.

    What cannabis software actually helps improve yields?

    Seed-to-sale platforms, sensor dashboards, and grow diaries all collect data but none of them analyze it to tell you what to change. Cultivation intelligence software like Growgoyle is designed specifically to improve yields by analyzing every completed batch and producing actionable recommendations: what worked, what cost you yield, and what to do differently next run. The difference is between software that records that you harvested 47 pounds and software that tells you why it was not 52.


    Growgoyle.ai helps you close the gap between your best run and your worst. AI-powered batch analysis, run-over-run comparison, and photo diagnostics that keep every cycle on track. Built by a grower who got tired of guessing. See what the AI sees in your canopy photos – no signup required.

    About the Author

    Eric is a 15-year software engineer who operates a commercial cannabis cultivation facility in Michigan. He built Growgoyle to solve the problems he faces every day: inconsistent yields, forgotten lessons from past runs, and the constant pressure to lower cost per pound. Every feature in Growgoyle comes from real growing experience, not a product roadmap.

  • Why No Cannabis Yield Metric Works for Comparison

    Why No Cannabis Yield Metric Works for Comparison

    Why No Cannabis Yield Metric Works for Comparison (And What to Track Instead)

    Every grower has a yield number they’re proud of. And every grower has compared it to someone else’s and felt either validated or deflated. Here’s why that comparison was meaningless either way, and what you should actually be tracking in your cannabis cultivation operation.

    This isn’t a shot at the forums. The instinct to benchmark yourself against other growers is completely natural. But the metrics we use to describe cannabis yields are so dependent on setup variables that cross-grower comparisons produce noise, not signal. Once you understand why, you can stop playing that game and focus on the only comparison that actually improves your operation.

    Grams Per Square Foot: Easy to Brag About, Hard to Interpret

    Grams per square foot is the most common cannabis yield metric you’ll see thrown around online. It’s simple to calculate and simple to brag about, which is exactly why it’s so misleading.

    The first problem: square footage is already tied to your light footprint anyway. A 4×4 under a 600W fixture and a 4×4 under a 1000W fixture are not the same 16 square feet. Your canopy area is determined by your light spread, not some objective spatial unit that means the same thing across operations.

    The second problem: grams per square foot tells you nothing about how many plants produced that weight. A sea of green setup with 16 plants in that same 4×4, running 5-week veg cycles, is fundamentally a different system than 4 large plants trained over 8 weeks of veg in the same footprint. Both might hit 2.5 g/sqft. They got there through completely different strategies, different resource inputs, and different risk profiles. Comparing the numbers tells you nothing useful about either operation.

    Flowering duration isn’t captured either. A 9-week strain and a 12-week strain can produce the same grams per square foot number while representing radically different annualized outputs. The 9-week strain might run 5 cycles per year in that room. The 12-week strain might run 3.5. The per-cycle number looks identical. The per-year number is not even close.

    Grams per square foot is a fine internal tracking metric if your setup doesn’t change. Between operations, it tells you almost nothing.

    Pounds Per Light: Better, But Still Broken

    Pounds per light cannabis is a step up from grams per square foot. It at least normalizes for fixture count, which eliminates some of the room-size variability. Most serious commercial cannabis growers have migrated toward this metric, and it’s better. It’s still broken for cross-grower comparison.

    Here’s a concrete example. Grower A is running 4 plants under a 630W LED in 14 square feet. Five-week veg, 9-week flower. They pull 4 lb/light. That’s a solid run.

    Grower B has a 1200W high bay covering a 6×6 footprint, running 4 bigger plants with 8 weeks of veg and an 11-week flowering cultivar. They pull 6 lb/light and think they’re crushing Grower A.

    These numbers are not comparable. The fixtures have different output levels, different canopy coverage, different efficiencies. The veg strategies produced fundamentally different plant sizes and structures. The flowering windows mean completely different room turns per year. Grower A might be more profitable on a per-square-foot-per-year basis despite the lower lb/light number. You genuinely cannot tell from these metrics alone.

    Even within cannabis cultivation, the same cultivar can express differently depending on rootzone size, feed strategy, canopy management, and environmental conditions. Pounds per light is a useful internal metric. It’s a terrible basis for comparing your operation to someone else’s.

    Cost Per Pound: The Best Metric, And Still Not for Comparison

    Cost per pound is the number that actually determines whether your cannabis grow operation survives. If you’re not tracking it, start now. It forces you to connect your yield performance to your actual economics, which is where operational decisions have to live.

    But for cross-grower comparison? Still broken.

    Take two commercial cannabis facilities running nearly identical operations: same genetics, same environmental targets, same cultivation practices. One is in Michigan. One is in California. Power costs, rent per square foot, and labor rates are wildly different between those two markets. Their cost per pound will differ significantly even if their yields are identical and their operational efficiency is the same.

    You can have a lower cost per pound than a California operator while running a less efficient operation simply because you pay less for electricity. That metric will mislead you about where you actually stand.

    Cost per pound is essential for tracking your OWN efficiency over time. Are your costs going down as your yields improve? Is a new cultivar actually profitable when you account for its longer flower time? Those are the right questions. Comparing your cost per pound to a stranger’s Reddit post is not.

    Why the Science Backs This Up

    This isn’t just grower intuition. Research from Rodriguez-Morrison et al. (2021) at the University of Guelph demonstrated that cannabis yield responses to environmental conditions are linear but highly variable by cultivar and production system. The study found that absolute yield numbers are essentially meaningless without accounting for the specific genetic and environmental context they were produced in (Rodriguez-Morrison et al., 2021).

    In other words: the same environment can produce very different yields across cultivars, and the same cultivar can yield differently across environments. If the variables are that tightly coupled, how does a yield number from a different grower’s operation in a different state with different genetics tell you anything actionable? It doesn’t.

    The research community studying cannabis cultivation has mostly abandoned cross-facility benchmarking for exactly this reason. Individual operations need to be analyzed against their own history and their own conditions.

    The Only Comparison That Actually Matters: You vs You

    Here’s the question that actually moves your operation forward: did you improve over your last run of the same strain?

    Not “did I beat some theoretical cannabis yield benchmark?” Not “am I above average?” Just: am I better than I was? Are my yields trending up? Is my consistency tightening? Am I identifying and actually fixing the specific things that held back my last run?

    This is the only comparison framework that produces actionable information. When you compare yourself to another grower, you’re comparing two different systems. When you compare your current run to your last run of the same strain, in the same room, with the same setup, you’ve controlled for almost every variable. The delta tells you something real.

    If you pulled 3.8 lb/light last cycle and hit 4.1 this cycle on the same cultivar, something you did worked. If you dropped to 3.4, something went wrong. That’s a signal you can act on. A forum post where someone claims 6 lb/light with no context is not.

    Yield consistency is part of this too. A cannabis cultivation operation that averages 4 lb/light with a 0.2 lb standard deviation is in a better position than one averaging 4.5 lb/light with a 1.1 lb standard deviation. Consistency is what lets you forecast, staff, and plan. Inconsistency is where margin disappears. Chasing peak numbers at the expense of repeatability is a trap, and you won’t see it if you’re only looking at averages.

    What to Actually Track in Your Cannabis Cultivation Operation

    Stop optimizing for metrics that look good in forum posts. Here’s what to track run over run:

    Pounds per light (your primary cannabis yield metric). Track this run over run, strain by strain. Don’t compare it across operations. Use it to see your own trajectory. Is it going up? Staying flat? Dropping? That trend is your signal.

    Trim ratio. This is your efficiency metric. Trim ratio tells you how much sellable flower you’re getting per plant. If your yields stay flat but your trim ratio improves, you’re getting more marketable output from the same inputs. That’s real efficiency gain. If your trim ratio is slipping, something in your environment or canopy management is producing more larf and less top cola, worth diagnosing even if the scale weight looks fine.

    Yield consistency. Track standard deviation across runs of the same strain in the same room. Are you getting repeatable results, or are you swinging 20% between cycles? Tightening consistency is often more valuable than chasing peak yield because it’s what makes your operation predictable. Predictable operations plan better, waste less, and scale cleaner.

    Flowering-time-adjusted throughput. If you’re running multiple cultivars with different flower times, you need to account for room turns per year, not just per-cycle numbers. A strain that yields 10% more per cycle but takes 20% longer to flower might actually be reducing your annual output per room. Run the math on an annualized basis so you’re comparing strains on equal footing.

    None of these metrics need to be compared to any external benchmark. They’re all about your trajectory, your consistency, and your specific operation.

    Stop Letting Reddit Tell You If You’re Good

    The next time you see a post where someone’s claiming 7 lb/light or 3.5 g/sqft, the right response is mild curiosity, not anxiety. You don’t know their light wattage, their canopy area, their veg time, their strain, their flower duration, or whether they’re telling the truth. That number tells you nothing about your operation.

    Your cannabis cultivation operation is its own system. The only meaningful question is whether that system is improving. Are you more consistent than you were 6 months ago? Are your yields trending in the right direction on the strains you run regularly? Are you actually identifying and fixing what went wrong in a bad run, or just moving on and hoping the next one is better?

    That last question is where most operations leak performance. It’s easy to celebrate a good run and forget a bad one. It’s harder to do a real post-run analysis, figure out what drove the variance, and carry that forward as a specific operational change. That process (honest retrospective, specific diagnosis, targeted adjustment) is what compounds into real improvement over time.

    The growers who consistently improve their numbers aren’t the ones comparing themselves to strangers on the internet. They’re the ones who know their own runs cold and treat every cycle as data.


    Growgoyle.ai tracks pounds per light, trim ratio, and yield consistency automatically and scores every cannabis batch against YOUR own history, not industry benchmarks, not Reddit. After every run, you get a full AI-powered breakdown: what worked, what held you back, and specific improvement estimates in pounds. No external comparisons. Just you vs your last run, with a clear picture of exactly how to beat it. See what the AI sees in your canopy photos – no signup required.


    Growgoyle.ai helps you close the gap between your best run and your worst. AI-powered batch analysis, run-over-run comparison, and photo diagnostics that keep every cycle on track. Built by a grower who got tired of guessing. See what the AI sees in your canopy photos – no signup required.

    About the Author

    Eric is a 15-year software engineer who operates a commercial cannabis cultivation facility in Michigan. He built Growgoyle to solve the problems he faces every day: inconsistent yields, forgotten lessons from past runs, and the constant pressure to lower cost per pound. Every feature in Growgoyle comes from real growing experience, not a product roadmap.

  • The 7 Hidden Costs Killing Your Cannabis Cost Per Pound

    The 7 Hidden Costs Killing Your Cannabis Cost Per Pound

    The 7 Hidden Costs Killing Your Cannabis Cost Per Pound

    You’ve got a spreadsheet somewhere with rent, power, and payroll on it. Those aren’t the costs killing you. The numbers that actually determine whether your cannabis cultivation facility survives are buried in places most operators never look: in the drying room, in the variance between runs, in the tribal knowledge that walked out the door when your lead grower left. These are the hidden costs, the ones that don’t show up on a P&L until the margin is already gone.

    From running a commercial facility, I can tell you that cannabis cost per pound is almost never a fixed-cost problem. It’s a yield problem. An efficiency problem. A consistency problem. And the worst part is that most of these costs are completely invisible unless you’re doing serious post-run analysis on every batch.

    One note before we get into the list: if you’re an owner working in the grow, pay yourself a real salary and count it as a cost. A lot of owner-operators skip this and treat “whatever’s left” as their pay. That makes your cost per pound look artificially low and your margins look better than they are. Assign yourself what you’d pay someone to do your job, put it in the labor line, and then see what your real numbers look like. The list below assumes you’ve already done that honestly.

    Here’s where to look.


    Hidden Cost #1: Overdrying Is Destroying Sellable Weight

    This one hurts because the math is brutal and most growers have no idea it’s happening at this scale.

    Going from 0.61 aw to 0.50 aw during drying and cure can cost you 15 to 25% of your dry weight. On an 80-pound batch, that’s 12 to 20 pounds that essentially evaporates. At $800 per pound wholesale, you’re looking at $9,600 to $16,000 per batch thrown away as water vapor. Not a typo.

    It compounds in three ways. First, the obvious moisture loss. Second, overdried flower shatters during processing, you lose material to trim waste and dust that would have been sellable product. Third, trichome degradation accelerates at low water activity. The terps and cannabinoids you spent the entire run building are degrading in the drying room.

    One commercial facility I’m aware of recovered 18 pounds per batch simply by correcting their drying protocol, pulling product at 0.61 aw instead of letting it drift to 0.50. Same genetics, same grow environment, same labor. Eighteen pounds. That’s not a cultivation improvement. That’s a process correction, and it was invisible until someone looked at the data.

    Water activity management isn’t complicated, but it requires consistent monitoring and a clear target. The research is there: optimal range for cannabis storage is 0.55 to 0.65 aw (Cannabis Science and Technology). Most facilities aren’t hitting it consistently.


    Hidden Cost #2: Yield Inconsistency Makes Everything Else Worse

    Your fixed costs don’t care what you harvest. Rent, insurance, equipment depreciation, those numbers are the same whether you pull 70 pounds or 55 pounds from a room.

    Here’s the math most growers haven’t done: a 10% drop in yield increases your cost per pound by more than 10%. Because the denominator shrinks but the numerator doesn’t. If your fixed cost allocation per room per run is $40,000, your cost per pound on a 70-pound run is $571. On a 55-pound run, it’s $727. That’s a $156-per-pound swing from yield variance alone, before you count any variable cost changes.

    Most cannabis operations are running 3 to 5 rooms with 8 to 12 runs per room per year. If you have even one room swinging 15 pounds between good runs and bad runs, which is common, you’re absorbing that cost variance across dozens of batches annually. It adds up to tens of thousands of dollars in preventable cost.

    The only way to attack yield inconsistency is to understand what’s driving it. That means comparing runs with enough detail to actually see the differences, not just “this one was better,” but specifically what environmental conditions, training decisions, or feeding protocols produced the variance.


    Hidden Cost #3: Repeating the Same Mistakes

    Every run you do without a structured post-mortem is a missed opportunity to build institutional knowledge. But it’s worse than that. Without documented batch analysis, you’re almost certainly repeating mistakes you’ve already solved.

    You had a great run six months ago. Run 17. The yields were up, the quality was tight, the trim ratio was excellent. Do you know exactly why? Can you tell me the specific environmental conditions, the training protocol, the feeding adjustments that made it work? Or does that knowledge live in your head, or worse, in the head of someone who no longer works for you?

    Every repeated mistake in cannabis cultivation is a hidden cost. You already paid the tuition. You already solved this problem. You just forgot the answer, or it was never written down in a way you could actually use.

    Most commercial cannabis facilities run 25 to 40 batches per year. Over three years, that’s 75 to 120 data points. The operation that’s actually learning from each one is compounding improvements. The operation that’s diagnosing each run from scratch is just paying for the same education over and over.


    Hidden Cost #4: Environmental Recovery Energy

    Tight environmental control actually costs less than loose control. This one surprises people.

    When your cannabis grow room temp or RH swings wide (10+ degree temp swings, RH riding 20 points up and down) your HVAC is constantly running at capacity to chase setpoints. The equipment is doing recovery work instead of maintenance work. Recovery cycles draw more power and create more mechanical wear. You’re not just wasting electricity on the correction cycles themselves, you’re also wearing out equipment faster.

    A room running at consistent VPD targets with small, managed deviations will run cheaper in energy than a room with sloppy environmental swings, even if the sloppy room has the same average conditions over time. Averages lie. The peaks and valleys are where the cost lives.

    This is also a yield quality issue. Plants respond to the swings, not the averages. Consistent VPD produces consistent transpiration, which produces consistent uptake, which produces consistent growth. The environmental inconsistency you’re paying for in energy is also the inconsistency you’re paying for in yield variance.


    Hidden Cost #5: Trim Labor on Bad Canopies

    Trim ratio is one of the most undertracked efficiency metrics in cannabis cultivation. Most operations know their rough trim labor cost per pound, but they don’t connect it back to canopy management decisions made six weeks earlier.

    An uneven canopy (popcorn at the bottom, inconsistent bud sites, poor light penetration) means more hand-trimming time per pound of sellable product. The rough trim to finished product ratio goes up. Processing time per pound increases. For operations doing any volume, trim labor is a real number, and it swings meaningfully based on canopy quality.

    A consistent, well-developed canopy with good light penetration reduces trim labor per pound. It’s not a small effect. Commercial operations that tighten their canopy management often see 10 to 20% reductions in trim processing time. On a 100-pound run with $8-per-pound trim labor, that’s $80 to $160 per run, and it compounds across every batch in the year.

    Most growers aren’t tracking this because trim ratio data lives in the processing department and canopy data lives in the cultivation department. Nobody’s connecting them until you’re doing batch-level analysis that actually spans the whole run from veg to processing.


    Hidden Cost #6: Testing Failures

    A failed test is the most expensive outcome in cannabis cultivation. You ate every cost (labor, inputs, power, rent allocation) and you get zero revenue. The math is catastrophic.

    Microbial failures. Pesticide carryover from previous grows or shared equipment. Potency below contract minimums on a strain that tested fine last cycle. These aren’t just quality problems, they’re financial disasters. And the frustrating part is that most testing failures are preventable with better process control.

    Water activity matters here again. Keeping cured flower in the 0.55 to 0.65 aw range doesn’t just preserve weight, it inhibits microbial growth. Letting flower dry below 0.55 doesn’t kill pathogens, and letting it rehydrate above 0.65 creates conditions for mold and bacteria to proliferate. Tight water activity management is simultaneously a yield protection strategy and a testing failure prevention strategy.

    Prevention is infinitely cheaper than remediation. You can’t remediate a failed potency test. You can only prevent the next one by understanding what went wrong in this cycle, which requires actually documenting and analyzing what happened.


    Hidden Cost #7: The Opportunity Cost of Not Learning

    Every batch is a data point. If you’re not analyzing it, you’re throwing away information you already paid to generate.

    Think about what you spend to run a batch. Clones, nutrients, labor, power, HVAC wear, the grower’s time. Every dollar of that cost also bought you information about what works and what doesn’t for your specific genetics, in your specific environment, with your specific team. That information has value, but only if you capture and use it.

    The facility running 30 batches per year that does rigorous post-run analysis on each one will, over three years, have dramatically lower cost per pound than the facility running the same number of batches with no structured learning process. The compounding effect of small improvements (half a pound per run here, tighter trim ratio there, one less environmental swing per week) adds up to real money over time.

    Your competitors are either doing this or they’re not. The ones doing it are getting better every cycle. The ones who aren’t are hoping their fixed costs don’t catch up with them before the market does.


    What to Do About It

    None of these hidden costs require expensive equipment upgrades. They require better information and a structured process for using it.

    Start with drying. Get a calibrated water activity meter and set a target range. Track aw at multiple points during dry and cure, not just at the end. The 18-pound recovery I mentioned earlier cost nothing to implement, it just required measuring what was already happening.

    Build a batch comparison process. After every run, document the key variables, environmental averages, yield by room and strain, trim ratio, water activity at cure, test results. Even a simple spreadsheet is better than nothing. The goal is to be able to look at two runs side by side and actually see what was different.

    Connect your departments. The information about trim ratio only helps if it gets back to the person making canopy management decisions. A lot of hidden cost in cannabis cultivation is a communication problem dressed up as an operations problem.

    And if you want AI-powered analysis doing the heavy lifting, comparing runs, identifying patterns, flagging what to fix and what to protect, that’s exactly what Growgoyle was built for.

    ๐Ÿ“Š Free Tool: Cannabis Cost Per Pound Calculator
    Know your number before you try to lower it. Our free cost per pound calculator has 27 expense categories, tax presets for major states, and what-if yield modeling. No signup required.

    Growgoyle.ai doesn’t track your expenses. That’s what accountants are for. But most of these hidden costs are yield problems in disguise. Overdrying, inconsistent runs, repeated mistakes, bad trim ratios, those are pounds you’re leaving on the table every cycle. Growgoyle’s AI batch analysis shows you exactly which pounds, what’s causing the loss, and what to fix next run. Built by a grower, for growers. See what the AI sees in your canopy photos – no signup required.


    Growgoyle.ai helps you close the gap between your best run and your worst. AI-powered batch analysis, run-over-run comparison, and photo diagnostics that keep every cycle on track. Built by a grower who got tired of guessing. See what the AI sees in your canopy photos – no signup required.

    About the Author

    Eric is a 15-year software engineer who operates a commercial cannabis cultivation facility in Michigan. He built Growgoyle to solve the problems he faces every day: inconsistent yields, forgotten lessons from past runs, and the constant pressure to lower cost per pound. Every feature in Growgoyle comes from real growing experience, not a product roadmap.

  • Cannabis Cost Per Pound Calculator (Free) โ€” Know Your Real Number

    Cannabis Cost Per Pound Calculator (Free) โ€” Know Your Real Number

    How to Calculate Cannabis Cost Per Pound (And Why Most Growers Don’t Know Their Number)

    You know what you pulled last run. Do you know what it cost you to pull it? Most commercial cannabis growers can tell you their lb/light without hesitating. Ask them their cost per pound and you get a shrug, a rough guess, or a number that’s missing half the actual expenses. That’s like knowing your revenue but not your profit. You’re flying blind on the number that determines whether your facility survives.

    This isn’t a lecture about accounting. It’s a practical walkthrough of how to calculate cannabis cost per pound, what goes into it, and why the math should change how you think about every decision you make on the floor.

    The Formula Is Simple. The Hard Part Is Knowing Your True Costs.

    Here it is:

    Total Monthly Operating Costs รท Total Dry Pounds Harvested = Cost Per Pound

    That’s it. Two numbers. But “total monthly operating costs” is where most cannabis cultivation operations fall apart. Growers tend to count the costs they think about every day (nutrients, electricity, labor) and forget about the ones that hit quarterly, annually, or just feel like “overhead.”

    If you’re not counting everything, your cost per pound is a lie. A flattering lie.

    What Actually Goes Into Total Cannabis Cultivation Costs

    Build this list for your facility. Every line matters:

    Facility costs: Rent or mortgage on the building. If you own, use an imputed cost, what could you lease that space for? Don’t let ownership fool you into thinking space is free.

    Electricity: This is typically your biggest variable cost in indoor cannabis cultivation. You’re paying for lighting, HVAC, dehumidification, CO2 enrichment, irrigation pumps, and everything else running 24/7. Pull your last three utility bills and average them. Most facilities I’ve talked to underestimate this by 15-20% because they forget about office space, hallways, and equipment rooms on the same meter.

    Labor: Cultivation staff, trim crew, management time, HR burden (taxes, benefits, workers’ comp). And here’s the one almost every owner-operator gets wrong: pay yourself a real salary and put it in this number. If you’re working 60 hours a week on the floor, assign yourself what you’d pay someone else to do that job. $80K, $100K, whatever the market rate is. Put it in the cost column. If you skip this and just take “whatever’s left” as your pay, you’re hiding labor cost inside your profit number. Your cost per pound looks lower than it actually is, your margins look healthier than they are, and you’re making business decisions based on a fantasy. The profit on top of your salary is your real margin. Everything else is you working for free and calling it a business.

    Nutrients and growing media: All inputs, veg nutrients, bloom nutrients, additives, pH adjusters, growing media or coco, fertigation filters. This adds up faster than people think, especially on high-frequency fertigation schedules.

    CO2: Cylinders or bulk tank fills. Easy to forget because it’s a separate invoice from a separate vendor.

    Water and waste: Water costs are usually low, but waste disposal (runoff, plant waste) can be significant depending on your state’s requirements.

    Compliance and licensing: Annual license fees, state fees, municipal fees, third-party audits, security system monitoring. Divide annual fees by 12 and put them in your monthly number.

    Mandatory testing: Every state requires it. R&D testing, certificate of analysis per batch, failed batch retests. In Michigan we’re testing every batch and it adds up fast if you run multiple rooms.

    Packaging and processing supplies: Bags, containers, labels, heat sealers, gloves, trim equipment supplies, jar supplies if you’re selling bulk flower.

    Equipment maintenance and repairs: HVAC service contracts, sensor calibration, lighting replacements, irrigation system maintenance. Budget a percentage of equipment replacement value per year if you don’t have actuals.

    Insurance: Commercial property, general liability, crop insurance if you carry it. Monthly premium divided out.

    Allocated overhead: Accounting, legal, software subscriptions, internet, phone, any shared services across the business. Some of this looks small line by line. Together it’s not.

    Example: What the Math Actually Looks Like

    Let’s use a real scenario. A two-room indoor cannabis facility running $45,000 per month all-in, that includes everything above, accounted for honestly. They’re pulling 80 pounds per month across both rooms.

    $45,000 รท 80 lb = $562/lb cost

    If wholesale flower is moving at $800/lb, that’s $238/lb margin. On 80 pounds, that’s about $19,000/month before debt service. Workable.

    Now same facility has a rough month. Environmental issue mid-flower, yields take a hit. They pull 65 pounds instead of 80.

    $45,000 รท 65 lb = $692/lb cost

    Margin drops to $108/lb. Total margin: $7,000. That 15-pound shortfall just cost you $12,000 in margin. The costs didn’t change. The denominator did.

    This is why a single bad batch can wreck a quarterly P&L. It’s not just the revenue you lost on those pounds. It’s that the same fixed cost base is now spread across fewer sellable units.

    The Gotchas Nobody Accounts For

    A few things that make cost per pound worse than your spreadsheet shows:

    Trim labor is fixed per run, not per pound. Your trim crew is there whether you pull 50 or 70 pounds from a room. Same hours, same cost. On a low-yield run, the cost per trimmed pound spikes. Track trim cost per pound separately and you’ll start to see how much bad batches hurt.

    Electricity doesn’t scale with yield. You’re running the same HVAC, the same lights, the same dehumidification load regardless of what the plants decide to do. A 70-lb pull and a 50-lb pull cost almost the same to produce. The difference goes straight to margin.

    Failed runs aren’t zero revenue. They’re negative revenue. A batch that fails testing, comes in with mold, or gets condemned isn’t a “zero.” It’s a full cycle of costs with no recovery. One failed run in a two-room facility running four runs a year can eliminate a quarter of your annual margin.

    Inconsistency compounds. It’s not just that bad runs hurt. It’s that your average cost per pound is pulled up by the bad runs more than it’s pulled down by the great ones. If five runs average $600/lb but one run comes in at $900/lb, your true average is worse than your best runs suggest.

    The Two Levers, and Why One of Them Is Mostly Stuck

    To lower cost per pound, you have two options:

    1. Cut costs. Good luck. Rent doesn’t go down. Electricity rates don’t go down. Labor in a licensed cannabis cultivation operation is non-negotiable. Testing is mandatory. Compliance fees are set by the state. You can optimize nutrients and trim some fat, but the reality is that 70-80% of your cost structure is fixed or semi-fixed. There’s a floor, and most established operations are close to it.

    2. Increase the denominator: more dry pounds, more consistently. This is where the upside lives. The same $45,000/month cost base that produces $562/lb at 80 lb produces $500/lb at 90 lb and $450/lb at 100 lb. Every pound you add to a run drops your cost per pound across the entire facility.

    This is why yield consistency matters more than any single great run. A great run tells you what’s possible. Consistent runs at that level actually change your economics. One 90-lb run surrounded by 65-lb runs doesn’t fix anything. It just makes you feel better for a few weeks.

    You Can’t Cut Your Way to Profitability in Cannabis Cultivation

    I’ve seen operators try. They squeeze nutrients, defer maintenance, cut trim labor. The first two decisions usually cost more than they save. Deferred maintenance turns into emergency repairs, and thin nutrients show up in yield. Cutting trim labor means slower processing, which means delayed revenue and sometimes quality hits on flower that sits too long.

    The growers I’ve seen actually move their cost per pound sustainably are the ones who get more consistent on yield. They figure out why their best rooms outperform their worst rooms. They stop repeating the same mid-cycle mistakes. They diagnose issues earlier so they don’t compound into lost pounds at harvest.

    The economic structure of indoor cannabis cultivation rewards consistency more than any other single factor. Fixed costs are fixed. The denominator is what you control.

    ๐Ÿ“ Free Tool: Grow Efficiency Scorecard
    How does your facility actually stack up? Our free efficiency scorecard benchmarks your g/sqft, lb/light, g/watt, and turns/year against published research data. Every benchmark backed by cited studies. No signup required.

    Run the Numbers on Your Own Facility

    If you haven’t done this calculation recently, or ever, do it this week. Pull three months of costs, average your monthly pounds across that same window, and divide. Then break it down by room if you’re running multiple. I’d bet at least one of your rooms has a cost per pound that would surprise you.

    Once you know your number, you know what it costs you to have a bad run. That tends to change how seriously you take things like early deficiency diagnosis, consistent VPD management, and dialing in your dryback. Not because you’re a better grower, but because you can see in dollars what a 10-pound variance costs you every month.

    Know your number. Then attack it through the denominator.

    ๐Ÿ“Š Free Tool: Cannabis Cost Per Pound Calculator
    Know your number before you try to lower it. Our free cost per pound calculator has 27 expense categories, tax presets for major states, and what-if yield modeling. No signup required.

    Growgoyle.ai doesn’t track your costs. That’s your accountant’s job. What it does is attack the yield side of the equation. AI batch analysis shows you what made your best runs your best runs, where the pounds are hiding, and what specifically to change next run to get them back. Photo analysis catches issues early, before they become harvest-day surprises. If you’re serious about lowering your cost per pound, start with the denominator. See what the AI sees in your canopy photos – no signup required.


    Growgoyle.ai helps you close the gap between your best run and your worst. AI-powered batch analysis, run-over-run comparison, and photo diagnostics that keep every cycle on track. Built by a grower who got tired of guessing. See what the AI sees in your canopy photos – no signup required.

    About the Author

    Eric is a 15-year software engineer who operates a commercial cannabis cultivation facility in Michigan. He built Growgoyle to solve the problems he faces every day: inconsistent yields, forgotten lessons from past runs, and the constant pressure to lower cost per pound. Every feature in Growgoyle comes from real growing experience, not a product roadmap.

  • Cannabis Trim Ratio: The Efficiency Metric Nobody Talks About

    Cannabis Trim Ratio: The Efficiency Metric Nobody Talks About

    Cannabis Trim Ratio: The Efficiency Metric Nobody Talks About

    Ask any commercial cannabis grower what they pulled on their last run and you’ll get a dry weight number. Maybe a grams-per-light figure if they’re feeling precise. But ask them what their trim ratio was and you’ll usually get a blank stare. Or a shrug. That’s a problem, because trim ratio is one of the most telling efficiency metrics in cannabis cultivation, and almost nobody is tracking it consistently.

    I’ve been growing commercially for years, and I’ll admit it took me longer than it should have to start paying attention to this number. I was so focused on dry flower weight that I treated everything coming off the bucking line as one big pile of “harvest.” But once I started weighing trim separately and doing the math, I realized how much information I’d been throwing away. Sometimes literally.

    What Cannabis Trim Ratio Actually Is

    Trim ratio is simple. It’s the weight of your trim divided by your total harvest weight (flower plus trim plus larf, if you separate it). Some growers calculate it as trim-to-flower, which is a slightly different number but tells a similar story. Either way, you’re measuring how much of what you grew ended up as sellable flower versus waste material.

    A lower trim ratio means more of your plant biomass is flower. A higher ratio means you grew a lot of leaf. And leaf, unless you’re processing it for extraction at a fraction of flower price, is basically overhead you paid to produce but can’t sell at full value.

    Think about it this way. If you harvested 100 pounds total and your trim ratio is 12%, you’ve got 88 pounds of flower. If that ratio creeps to 20%? You’re down to 80 pounds. Same plants, same room, same labor. Eight fewer pounds of sellable product. At even modest wholesale prices, that’s thousands of dollars gone.

    What’s a Normal Cannabis Trim Ratio?

    This varies more than people think. Strain genetics play a huge role. Some cultivars are naturally leafy. Some produce tight, dense colas with minimal leaf coverage. Growing style matters too. Sea of green will produce different ratios than a heavy trellis SCROG setup.

    That said, here are rough ranges for cannabis processing efficiency:

    • 10-13%: Excellent. Tight flower structure, good light penetration, well-suited genetics. You’re running a clean operation.
    • 13-16%: Solid and normal for most commercial cannabis facilities running a variety of strains. Nothing to panic about, but worth tracking run over run.
    • 16-18%: Getting high. Could be strain-dependent, could be a signal worth investigating.
    • 18%+: Something is likely off. Environmental stress, light issues, or genetics that need to be reconsidered for commercial viability.

    The absolute number matters less than your trend. A strain that consistently runs at 15% is fine. That same strain jumping from 15% to 19% over three runs? That’s a red flag you need to pay attention to.

    Why Creeping Cannabis Trim Ratio Is a Red Flag

    Here’s where it gets interesting. Trim ratio doesn’t just measure how leafy your plants are. It’s a downstream indicator of a bunch of upstream problems. When your trim ratio starts climbing across consecutive runs, something changed. The plant is telling you something. You just have to know how to listen.

    Environmental Stress

    Plants under stress produce more leaf material as a defense mechanism. High humidity swings, temperature spikes during flower, poor VPD management. All of these can push plants to throw more leaf. You might not see it as dramatically as a full-blown deficiency, but the trim bin doesn’t lie. If your cannabis grow room environment is inconsistent, it will show up in the trim ratio before it shows up in your yield numbers.

    Light Penetration Issues

    This is a big one. Poor canopy management, insufficient defoliation, or light fixtures losing output over time can all reduce light penetration to lower bud sites. Those lower sites still develop, but they produce airy, leafy flower that ends up as trim. You grew the weight, but you can’t sell it as tops. Your total harvest number might look fine while your trim ratio quietly climbs.

    Genetics Degrading

    If you’re running cuts from the same mother for a long time, genetic drift is real. It’s slow and subtle, which makes it dangerous. A mother plant that’s been producing clones for 18 months might still look fine, but the resulting flower structure can shift. More leaf coverage, less dense buds, slightly different morphology. The trim ratio picks this up before your eyes do.

    Bucking and Processing Inconsistency

    Sometimes it’s not the plant at all. If your cannabis bucking efficiency changes because you swapped trim crews, changed equipment, or just got sloppy with QC on the processing line, your trim ratio will move. This is actually useful information too, because it means you can separate grow-side problems from processing-side problems if you’re tracking the data.

    How Trim Ratio Affects Your Real Cost Per Pound

    Most growers calculate cost per pound using their total operating costs divided by pounds of sellable flower. Simple enough. But they don’t always connect the dots between cannabis trim waste and that final number.

    Let’s walk through a quick example. Say your facility costs $50,000 per month to operate (labor, power, nutrients, rent, everything). You run a 10-week flower cycle and harvest 200 pounds total. At a 12% trim ratio, you’ve got 176 pounds of flower. Your cost per pound is about $284.

    Now run that same scenario at an 18% trim ratio. You’ve got 164 pounds of flower. Same costs. Cost per pound jumps to $305. That’s a $21 increase per pound, and you didn’t change a single input. You just grew more leaf.

    Scale that across a full year of runs and you’re looking at tens of thousands of dollars in margin erosion. All from a metric most cannabis growers aren’t even tracking.

    The Hidden Cost: Processing Labor Scales with Trim Volume

    Here’s the part that really stings. Your trim ratio doesn’t just reduce sellable flower. It actively increases your processing costs. More trim means more time on the bucking line. More machine trimmer passes. More hand trim labor if you’re doing any kind of quality hand finish. More waste disposal.

    Cannabis processing efficiency isn’t just about speed. It’s about how much material your team has to handle per pound of finished product. A facility running at 12% trim ratio processes significantly less material per pound of flower than one running at 20%. That labor difference is real and it compounds every single harvest.

    I’ve seen operations where processing labor was their second-highest cost center, and they’d never once asked whether they could reduce it by growing less leaf in the first place. They kept hiring more trimmers instead of asking why they needed so many.

    Tracking Cannabis Trim Ratio Run Over Run

    The challenge with trim ratio is that a single data point doesn’t tell you much. You need the trend. Is it stable? Rising? Did it spike on one run and come back down? Context matters, and that means you need to track it consistently across every batch.

    This is one of the things I built into Growgoyle’s Efficiency dimension. Every batch gets scored, and trim ratio is part of that scoring. Not as an isolated number, but in context with your other efficiency metrics. The Goyle Score breaks down across Yield, Quality, Environment, Drying, and Efficiency, so you can see exactly where your operation is tight and where it’s slipping.

    More importantly, Growgoyle tracks these numbers run over run and compares them against your own historical performance. You’re scored against yourself, not some arbitrary industry benchmark that doesn’t account for your facility, your genetics, or your market. If your trim ratio is climbing relative to YOUR baseline, that’s what matters.

    Catching the Trend Before It Eats Your Margins

    The real danger with creeping trim ratios is how gradual they are. A 1% increase per run doesn’t feel like anything. You might not even notice it over two or three harvests. But over four or five runs, you’ve gone from 13% to 17% or 18%, and now you’re leaving serious money on the table.

    This is exactly the kind of pattern that Growgoyle’s batch analysis is designed to catch. When you complete a run and log your harvest data, the AI doesn’t just score that individual batch. It looks at the trajectory. If your trim ratio has been rising across consecutive batches, it flags it. Not as a generic “hey, trim is up” alert, but with specific investigation into why.

    Was your environment less stable this run? Did light intensity change? Are you running older genetics? The batch comparison feature lets you pull up any two runs side by side and see exactly what was different. Maybe Run 47 had great trim numbers and Run 51 didn’t. What changed between those two? That’s the question that matters, and it’s the question most growers don’t have the data infrastructure to answer easily.

    Investigating the Why, Not Just the What

    Knowing your trim ratio is high is step one. Knowing why it’s high is where you actually fix things. This is the difference between a spreadsheet and real batch intelligence.

    Growgoyle’s AI batch analysis doesn’t just say “your trim ratio increased 3% from last run.” It considers multiple possible causes. Was there an environmental event during weeks 4-6 of flower that could have triggered excess leaf growth? Did your DLI drop during a critical development period? Are the batches with higher trim ratios all from the same genetic line?

    That kind of differential diagnosis is what separates useful data from noise. Because if your trim ratio spiked due to a temporary HVAC issue, the fix is different than if it’s climbing because your mother plants are tired. And if it’s a processing line issue rather than a grow issue, you need to know that too before you start changing things in the room that don’t need changing.

    Start Weighing Your Trim

    If you take one thing away from this, let it be this: weigh your trim separately. Every harvest. Write it down. Calculate the ratio. Do it for three runs and you’ll have a baseline. Do it for six runs and you’ll start seeing patterns. It’s the simplest, cheapest data collection you can add to your cannabis harvest process, and it pays for itself the moment it catches a problem you would have missed.

    Your dry flower weight tells you what you got. Your trim ratio tells you how efficiently you got it. In a market where margins keep tightening, that efficiency is the difference between staying profitable and slowly bleeding out without understanding why.


    Growgoyle.ai tracks your trim ratio and dozens of other efficiency metrics across every batch, then uses AI to flag trends and investigate root causes. Batch scoring, run-over-run comparison, and actionable recommendations built for commercial cannabis growers. See what the AI sees in your canopy photos – no signup required.

    About the Author

    Eric is a 15-year software engineer who operates a commercial cannabis cultivation facility in Michigan. He built Growgoyle to solve the problems he faces every day: inconsistent yields, forgotten lessons from past runs, and the constant pressure to lower cost per pound. Every feature in Growgoyle comes from real growing experience, not a product roadmap.