Most commercial cannabis growers have never calculated their actual cost per pound. Not a rough estimate for an investor meeting. Not a number they backed into from a tax return. Their real number, with every expense accounted for, divided by every sellable pound they actually produced.
The ones who do the math for the first time usually don’t like what it says.
In a market where wholesale has compressed to an estimated $500-600 per pound and keeps trending lower, your cost per pound is the distance between surviving and closing. Not revenue. Not THC percentages. Not how many lights you run. How much it costs you to produce one finished, sellable pound.
That’s the number. And most operators don’t know theirs.
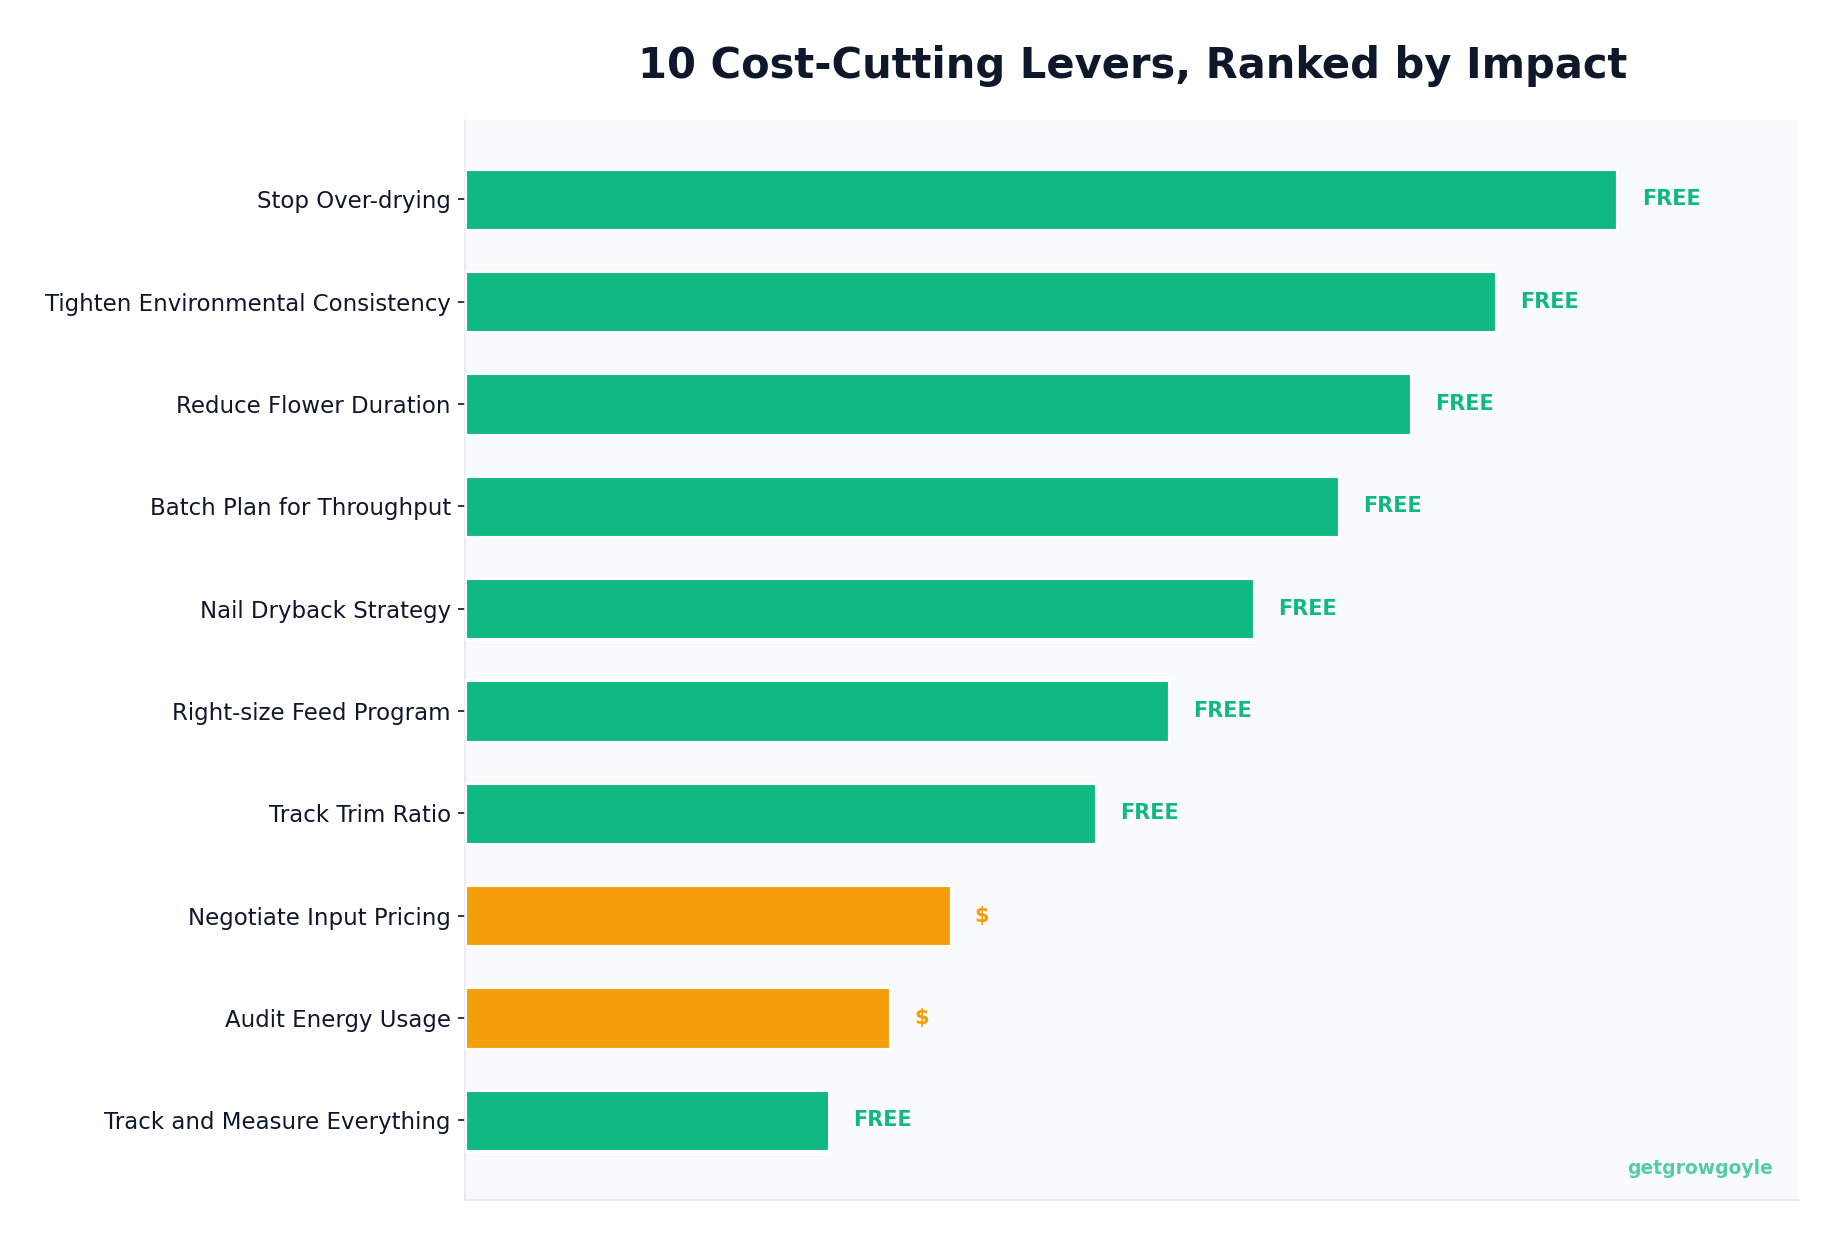
This is not a list of cost-cutting tips. It’s the framework: what actually drives your cost per pound, which variables have the most impact, and how to build a system that improves the number run over run instead of hoping this cycle goes better than the last one.
What Actually Makes Up Your Cannabis Cost Per Pound
The formula is simple: total expenses divided by total pounds of sellable flower. Everything your facility spends in a given period, divided by everything that comes out the other end and passes QC.
The math is easy. Getting the inputs right is where most operators fall short. There are three buckets of costs to account for:
Fixed Costs
These run whether you’re harvesting or not: rent or mortgage, debt service, insurance, licenses, base compensation for core staff. Fixed costs are the floor your production has to clear before you make a single dollar. When wholesale sits at $500-600 and keeps compressing, a high fixed cost base is a structural problem that no amount of operational efficiency can fully fix.
Variable Costs
These scale with production: nutrients, media, packaging, harvest labor spikes, energy, water, consumables. Variable costs are where most operators try to find savings first, usually by squeezing nutrient spend or reducing inputs. Sometimes that works. More often, it trades short-term cost reduction for yield reduction that makes the number worse.
Invisible Costs
This is the bucket most cost analyses miss completely. Downtime between runs. Rejected product that took full resources to produce but can’t sell at full price. Rework on poorly dried or poorly trimmed batches. Labor spent fixing problems that could have been caught earlier. A two-week delay in a flip because the room wasn’t ready.
These costs are real. They show up in your P&L as general inefficiency, not as a line item. That makes them easy to ignore and hard to address without detailed run-by-run data.
If you haven’t built this number for your operation yet, that’s the first thing to fix. Use the free cost-per-pound calculator and start with what you know. Even a rough estimate is more useful than operating blind. Once you have the number, you’ll probably want to know where the biggest gaps are. The efficiency scorecard benchmarks your operation against published research thresholds and tells you exactly which metric to attack first.
Once you have the number, the question becomes: which side of the equation do you attack first?
The Two Levers That Actually Drive It
Every cost reduction in cannabis cultivation comes down to one of two things: increasing your denominator (more pounds from the same infrastructure) or decreasing your numerator (spending less per cycle). Most operators focus on the second one first. That’s backwards.
Lever 1: Increase the Denominator
More pounds from the same fixed cost base is the single highest-impact thing you can do. Your rent is the same whether you pull 1.8 lb/light or 2.4 lb/light. Your insurance is the same. Your core team is the same. Every additional pound produced from existing infrastructure comes at near-zero fixed cost, which drives your cost per pound down fast.
The metric that matters here depends on your operation’s constraint. For most indoor growers with purpose-built rooms, yield per light is the diagnostic metric. It isolates your production system’s performance from your facility’s footprint. But for operations running large buildings with significant open floor space, grams per square foot or cost per square foot might be the number that exposes the real gap, because a facility pulling 6 lb/light across 36 square feet per light might look incredible on one metric while running terrible economics on the other. The right metric is the one that connects to your constraint. The wrong one is whichever one makes you feel good while hiding the problem.
What’s universal: track it consistently, run over run, and compare against yourself. The absolute number matters less than the trend. Are you improving? Are you consistent? Are you closing the gap between your best run and your worst one?
Yield per light has two components: what you pull per harvest and how many times per year you harvest. Turns per year is underrated. Two extra days between every flip across 23 annual harvests costs you an entire harvest cycle. If that cycle would have been 90 lbs at $500, that’s $45,000 lost to slow turnarounds. A tighter schedule, faster room flips, and shorter veg phases all compound directly into cost-per-pound improvement without touching a single input cost.
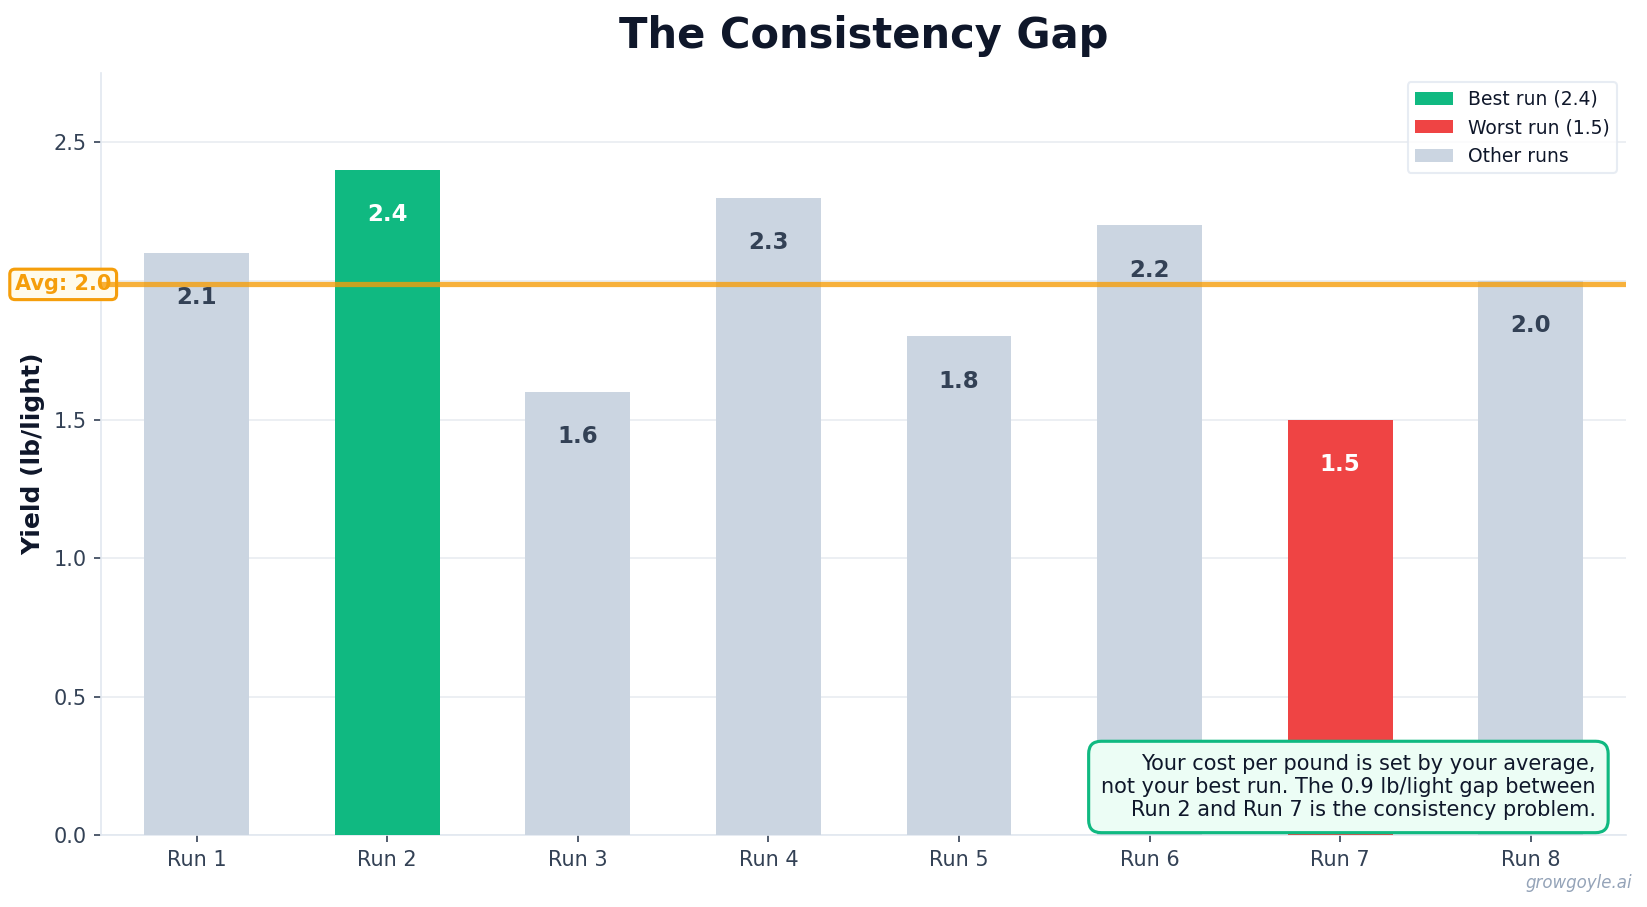
The other component is consistency. One great run at 2.4 lb/light doesn’t lower your annual cost per pound. Twelve consistent runs at 2.2 lb/light does. Consistency is the multiplier that converts single-run performance into actual business economics. For a deeper look at why yield consistency matters more than peak yield, that breakdown covers the math. You can also benchmark your own consistency with the free yield consistency check.
Lever 2: Decrease the Numerator
Spending less per cycle matters. But it has a ceiling that yield improvement doesn’t have, and it carries more risk because cutting the wrong inputs cuts yield along with it.
The metrics to watch on this side:
- Grams per watt (g/W): Your energy efficiency diagnostic. Useful in high-energy-cost markets where power is a meaningful chunk of variable cost. A room running 0.6 g/W has a different problem than a room running 1.1 g/W, and the fix is different in each case. But g/W alone doesn’t tell you whether your operation is profitable. You can run excellent grams per watt and still be underwater if your fixed costs are too high relative to total output.
- Trim ratio: The percentage of wet weight that becomes sellable trimmed flower. An uneven canopy (popcorn, larf, poor light penetration) means more trim labor per pound and a worse ratio. This shows up as both a yield problem and a labor cost problem simultaneously.
- Labor hours per pound: Total labor divided by total sellable output. The number most facilities have never actually calculated.
SOPs that reduce rework, energy efficiency upgrades, better scheduling that reduces idle labor time: these are real cost levers. But in most operations, improving yield by 20% saves nearly 3x more per pound than cutting variable costs by 20%. The math below shows why.
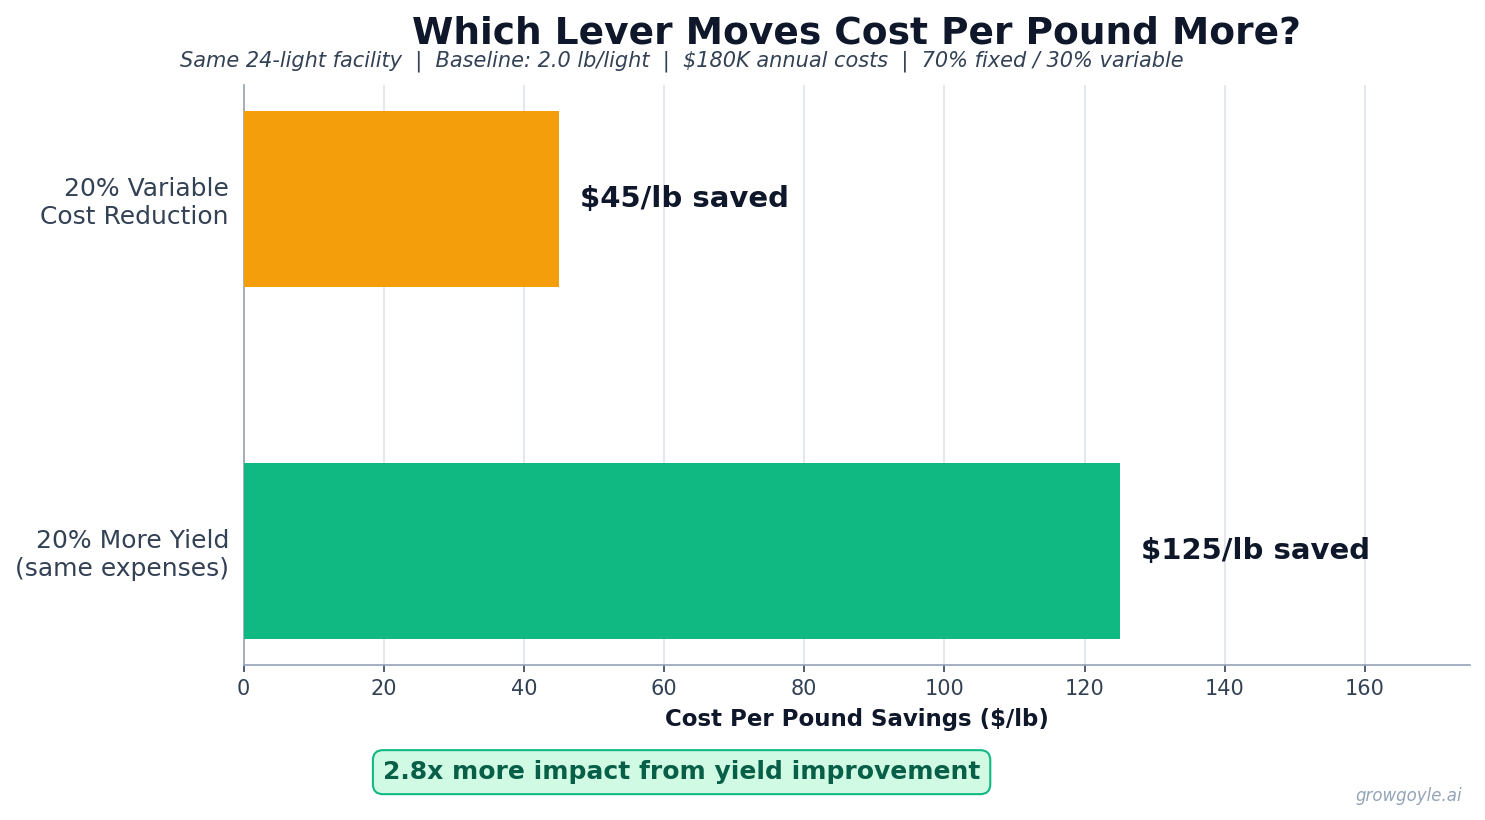
Same 24-light facility running 2.0 lb/light at $180K annual expenses (70% fixed, 30% variable). A 20% yield increase drops cost per pound by $125/lb. A 20% cut to variable costs drops it by $45/lb. Do both, but attack them in the right order. If you’re not sure which metric is your weakest, the efficiency scorecard will show you, with published research citations for every threshold.
The Yield Problem Nobody Talks About
Most cannabis growers know their best run. They know the cycle where everything clicked, the strain cooperated, the environment was dialed, and the harvest number was something they’ve quoted in every conversation since.
Far fewer know their average. And almost nobody has systematically analyzed the gap between their best run and their worst one.
That gap is the cost-per-pound problem.
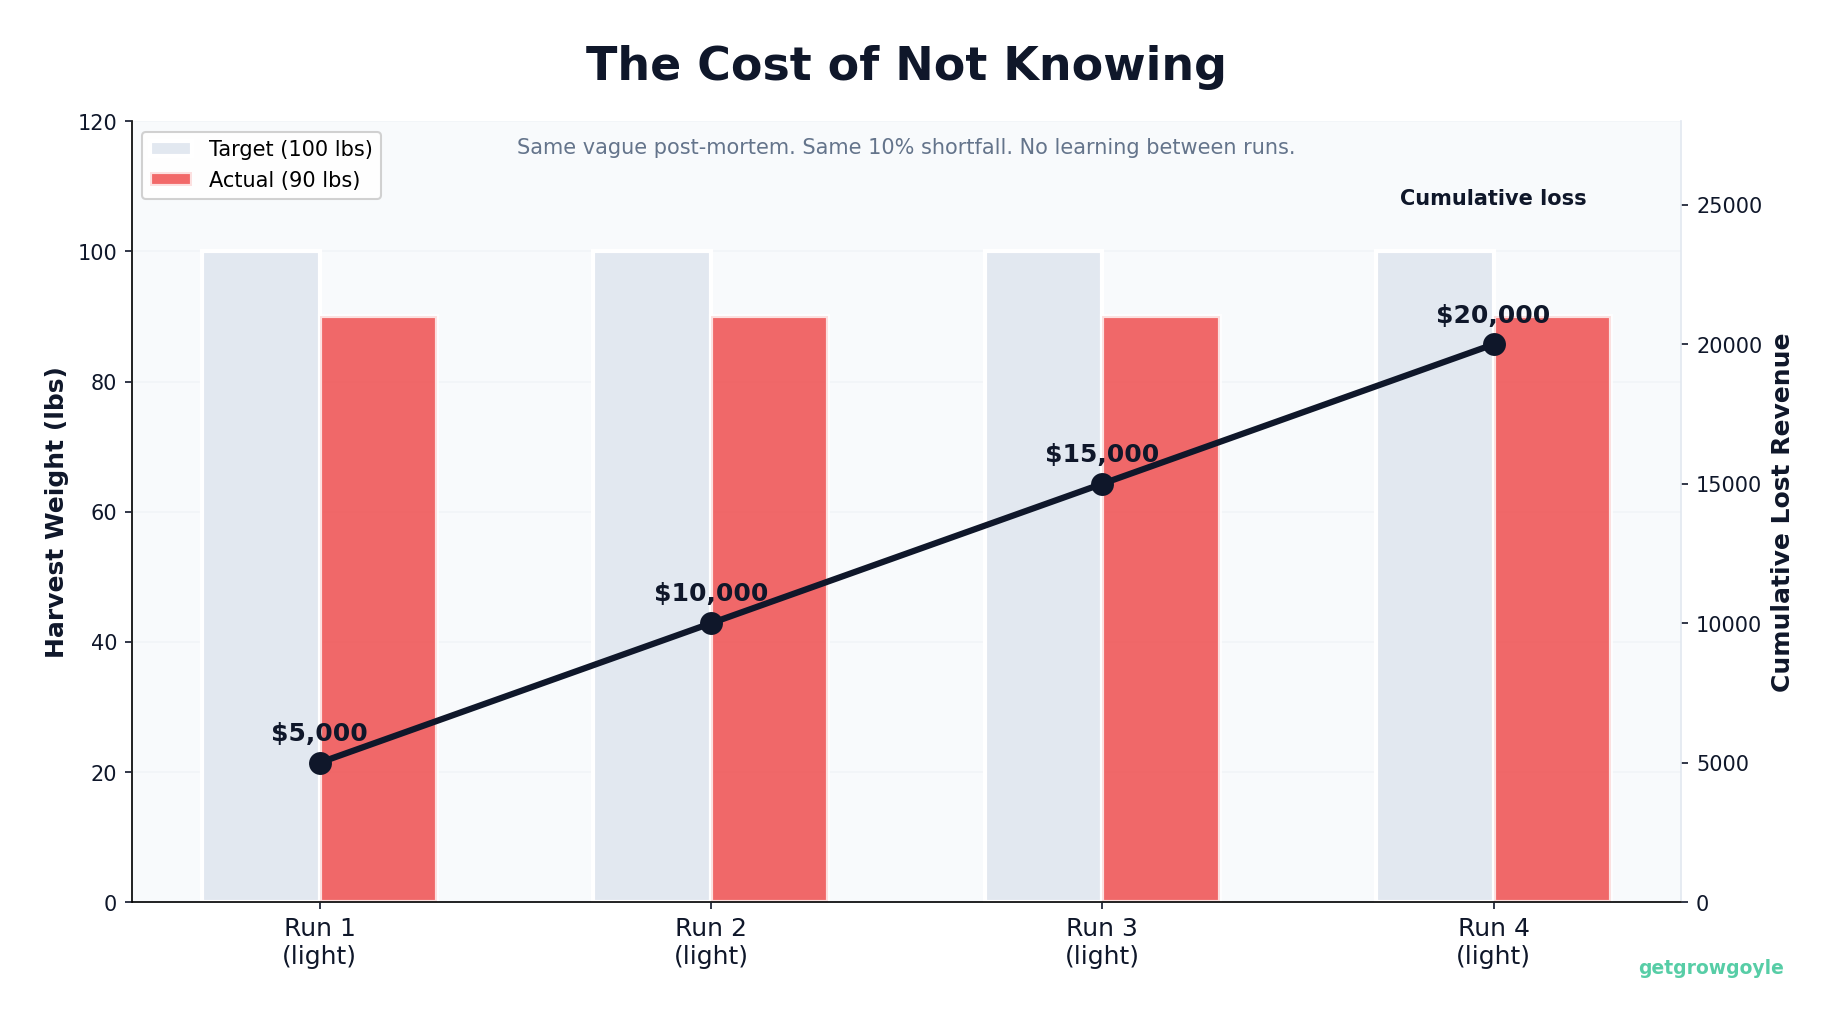
Your cost per pound isn’t set by your best run. It’s set by your worst one, averaged across the year. A facility that pulls 2.4 lb/light in one cycle and 1.5 lb/light in the next hasn’t “had a bad run.” It has a consistency problem, and that problem is showing up as a cost problem whether it’s been labeled that way or not.
This isn’t intuition. Rodriguez-Morrison et al. (2021) found significant correlations between DLI/PPFD delivery and yield outcomes across cannabis cultivation environments (PMC8144505). The implication goes beyond “higher light levels produce more yield.” Inconsistent light delivery, whether from positioning, fixture degradation, or canopy variation run to run, produces inconsistent yield outcomes. The variable isn’t just the bulb. It’s every decision that affects how that light actually reaches the canopy.
What drives run-to-run inconsistency in commercial cannabis operations:
- Environmental drift: VPD, temperature, and CO2 that varies week to week within the same cycle, or differs between cycles because of seasonal HVAC pressure
- Genetics variability: Phenotypic variation within a cut that wasn’t caught in selection, or mother stock that drifted between runs
- Undocumented process changes: Someone adjusts the feed schedule, changes irrigation timing, or modifies the training method without logging it. The next run is different and nobody knows why.
- Staff variation: Different people making judgment calls differently, especially in operations without tight SOPs
- Pest and disease events: Even mild, resolved events take a toll on final yield that rarely gets attributed correctly in post-harvest review
The reason most facilities never close this gap is simple: the data to understand it doesn’t exist in any usable form. Your compliance system tracks that you harvested. It doesn’t track why one run outperformed another. The cultivation data, the stuff that actually explains yield variation, lives scattered across a whiteboard, a notes app, a text thread, and someone’s memory. For more on this gap between what compliance tracks versus what you need to improve, the data split is more extreme than most operators realize.
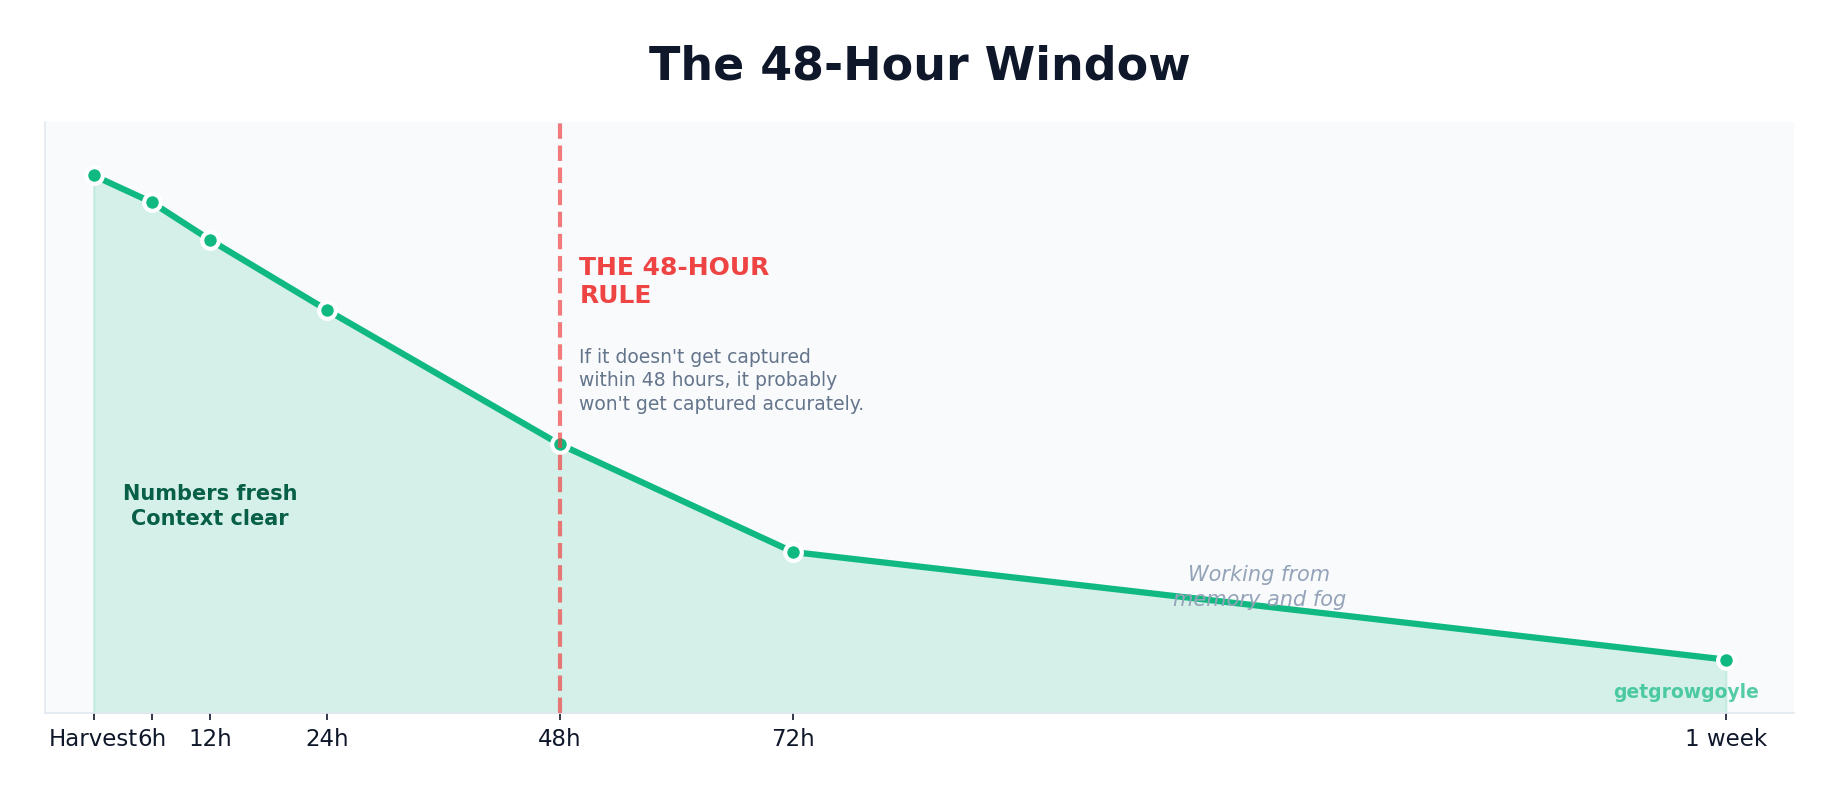
If your grow data lives on a whiteboard or in your head, every harvest that passes without logging it is gone. You can’t go back and figure out what happened in week 5 of a run that finished two months ago. The data either gets captured while it’s happening or it doesn’t exist.
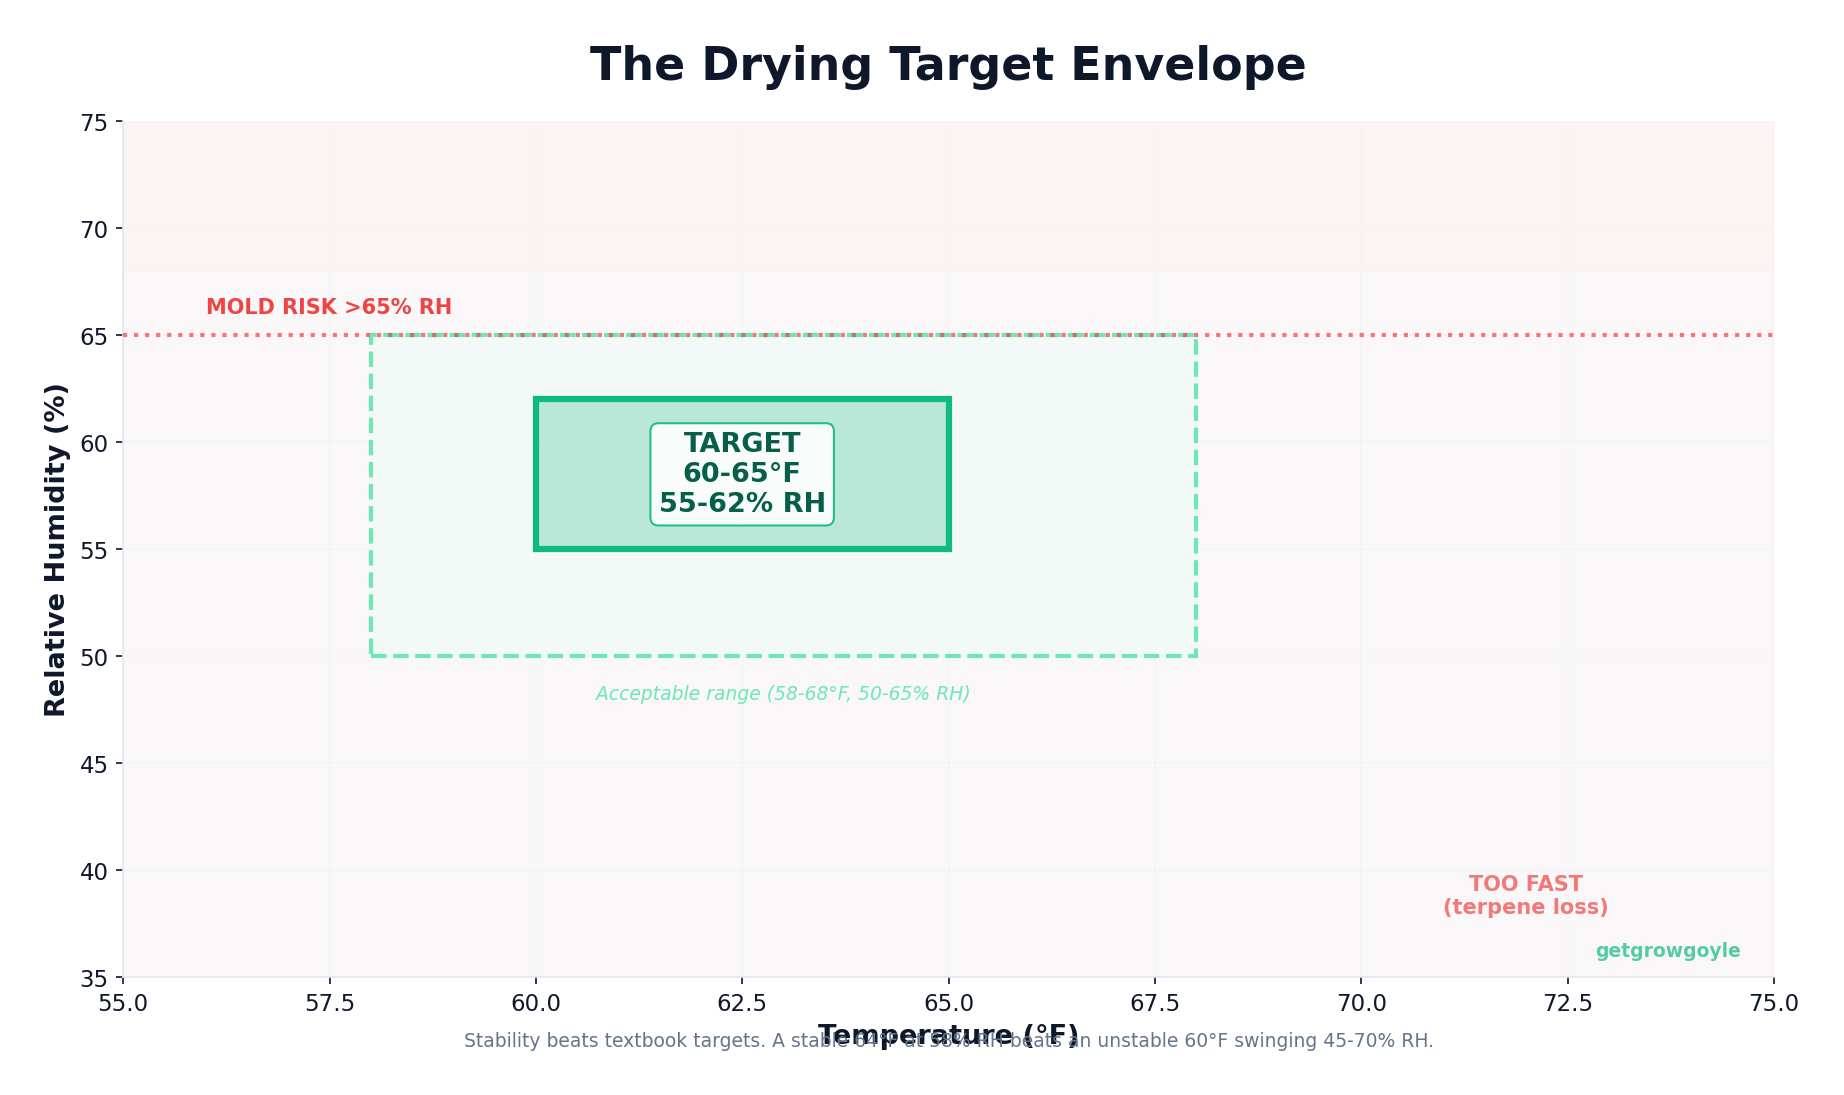
Environment Is the Foundation, Not the Answer
If you’ve been in cannabis cultivation for more than a few years, you know the pitch: dial in your VPD, get your DLI right, control your temps and RH, and yields will follow.
There’s truth in it. Environment is foundational. A room with chronically wrong VPD or extreme temperature swings is fighting itself. Llewellyn et al. (2022) documented the degree to which environmental factors influence not just yield but cannabinoid and terpene profiles in controlled cannabis production (Frontiers in Plant Science). The science is clear.
But “environment is everything” leads a lot of operators into what you might call the sensor dashboard trap: a room full of monitoring equipment, beautiful VPD charts, and still pulling 2.0 lb/light because the genetics or nutrition are telling a different story. Perfect environmental data doesn’t mean a perfect grow. It means you have good data on one piece of the system.
The correct role of environmental monitoring in a cost-per-pound framework:
- Detect drift early. An alert when CO2 drops or RH spikes in week 5 of flower prevents yield loss from an unaddressed problem. The alert is valuable because it prevents the loss, not because it produces yield on its own.
- Maintain cycle-to-cycle consistency. The same environment profile run to run reduces one source of yield variance, which compounds over time.
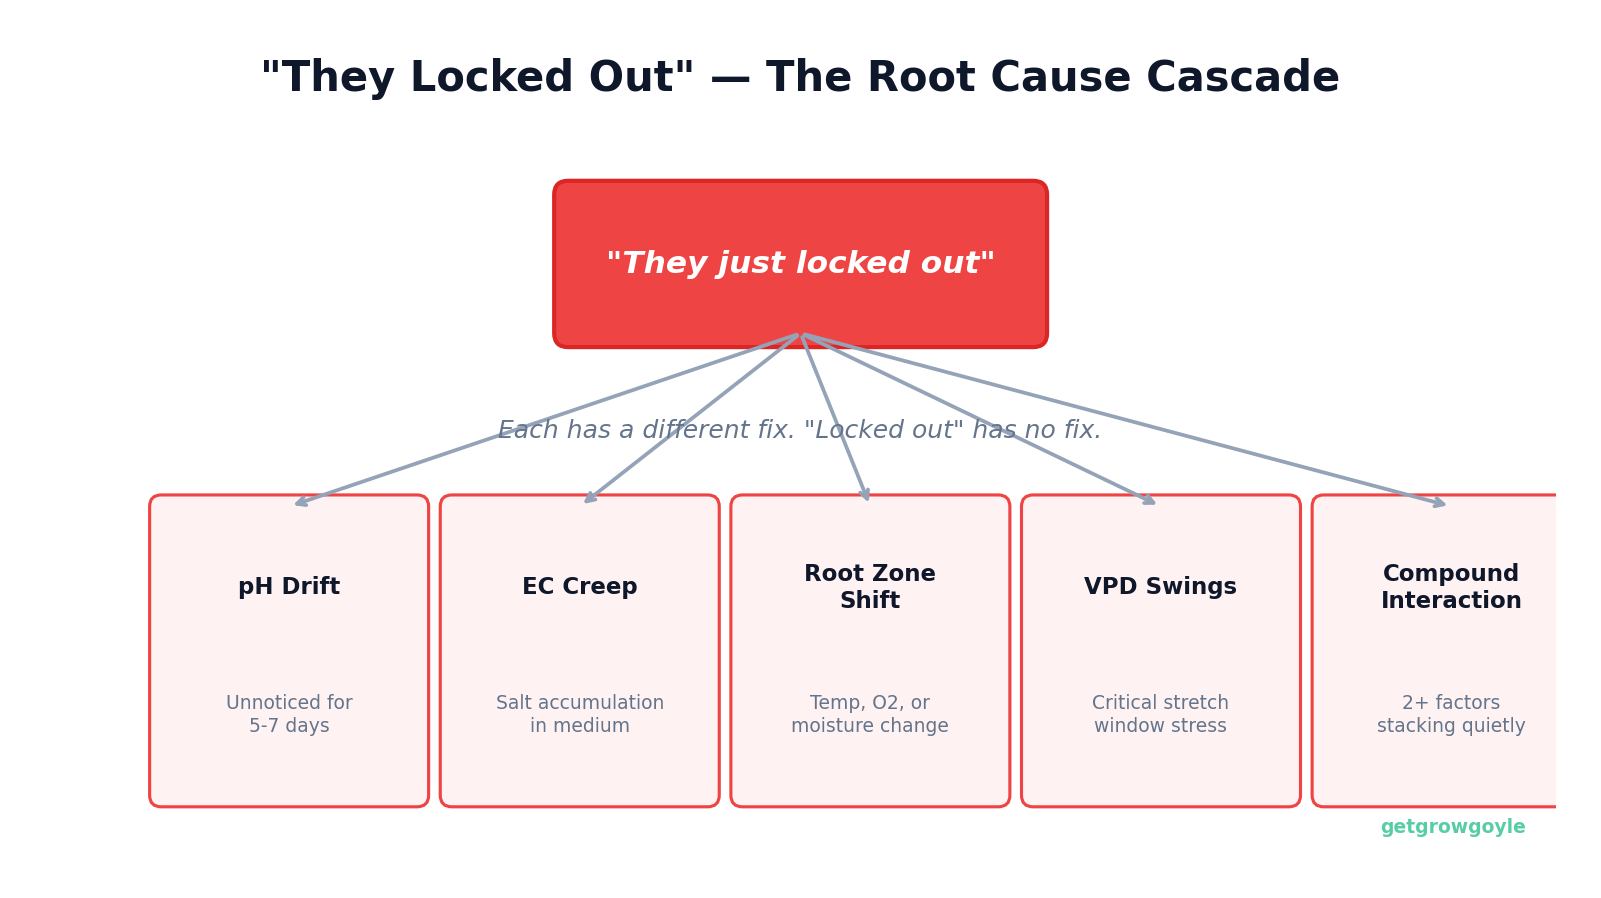
- Provide context for post-run analysis. A harvest that underperforms is more interpretable when you have environmental data for the whole cycle alongside it. Did VPD run high during the stretch? Did pH drift in week 4? That context makes the post-mortem useful instead of speculative.
What sensors can’t do: replace agronomic judgment, fix a genetics problem, or tell you whether the low yield came from the environment, the feed, the canopy management, or the harvest timing. The difference between a sensor dashboard and a cultivation intelligence system comes down to the difference between data collection and data interpretation.
Post-Run Analysis: The Compounding Habit
Every run is an experiment. The genetics, the environment, the feed, the training decisions, the drying conditions: these are the variables. Yield and quality at harvest are the results. Most facilities run experiment after experiment without ever formally reading the results.
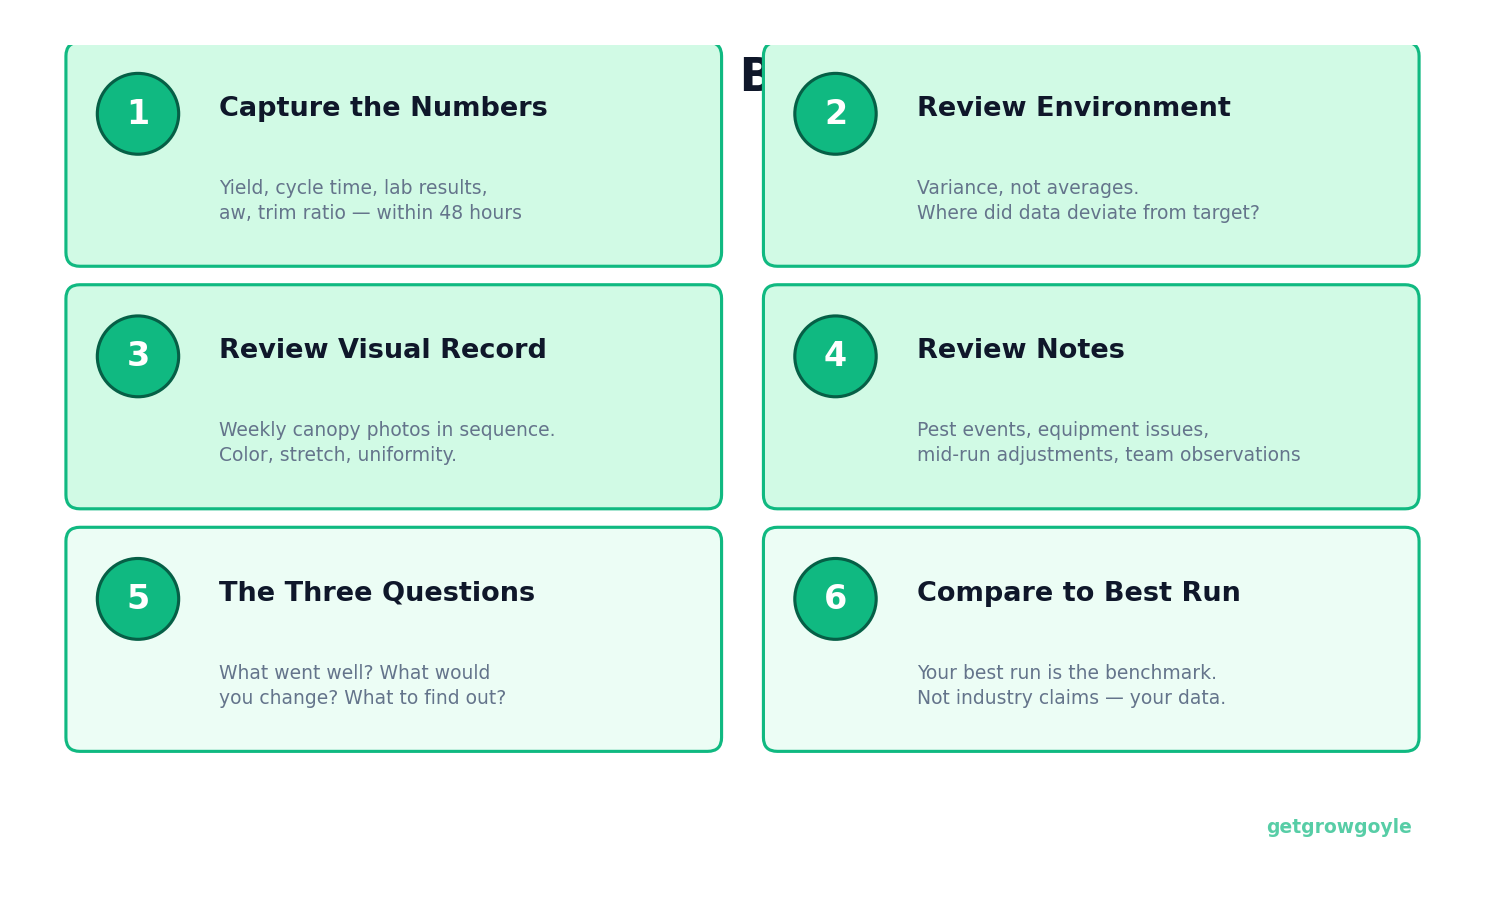
Post-run analysis isn’t complicated. It requires that the data exists and is accessible. Here’s what a useful review covers:
Yield Performance
Yield per light, total sellable pounds, trim ratio. How does this cycle compare to the last one? How does it compare to your best cycle in the last 12 months? The gap between this run and your best run is the starting point for every improvement conversation. For a deeper look at what your harvest data is actually telling you, this breakdown of cannabis batch analysis covers the five dimensions that matter most.
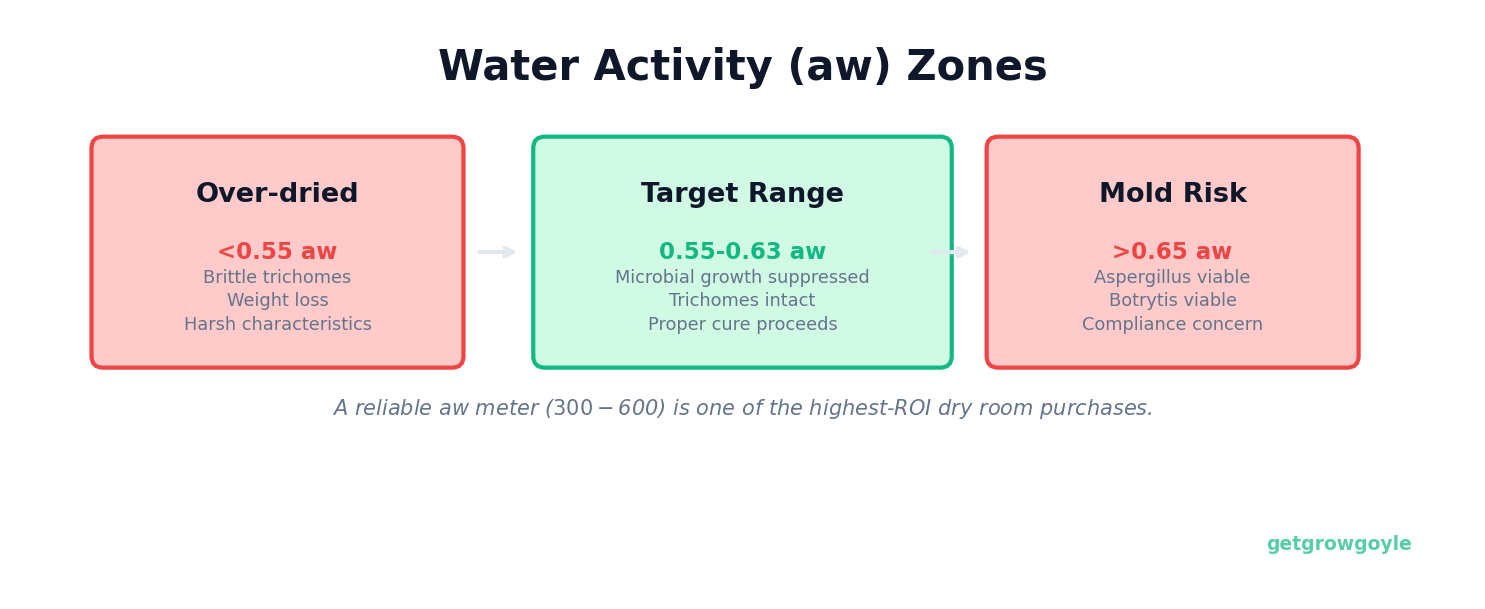
Quality Metrics
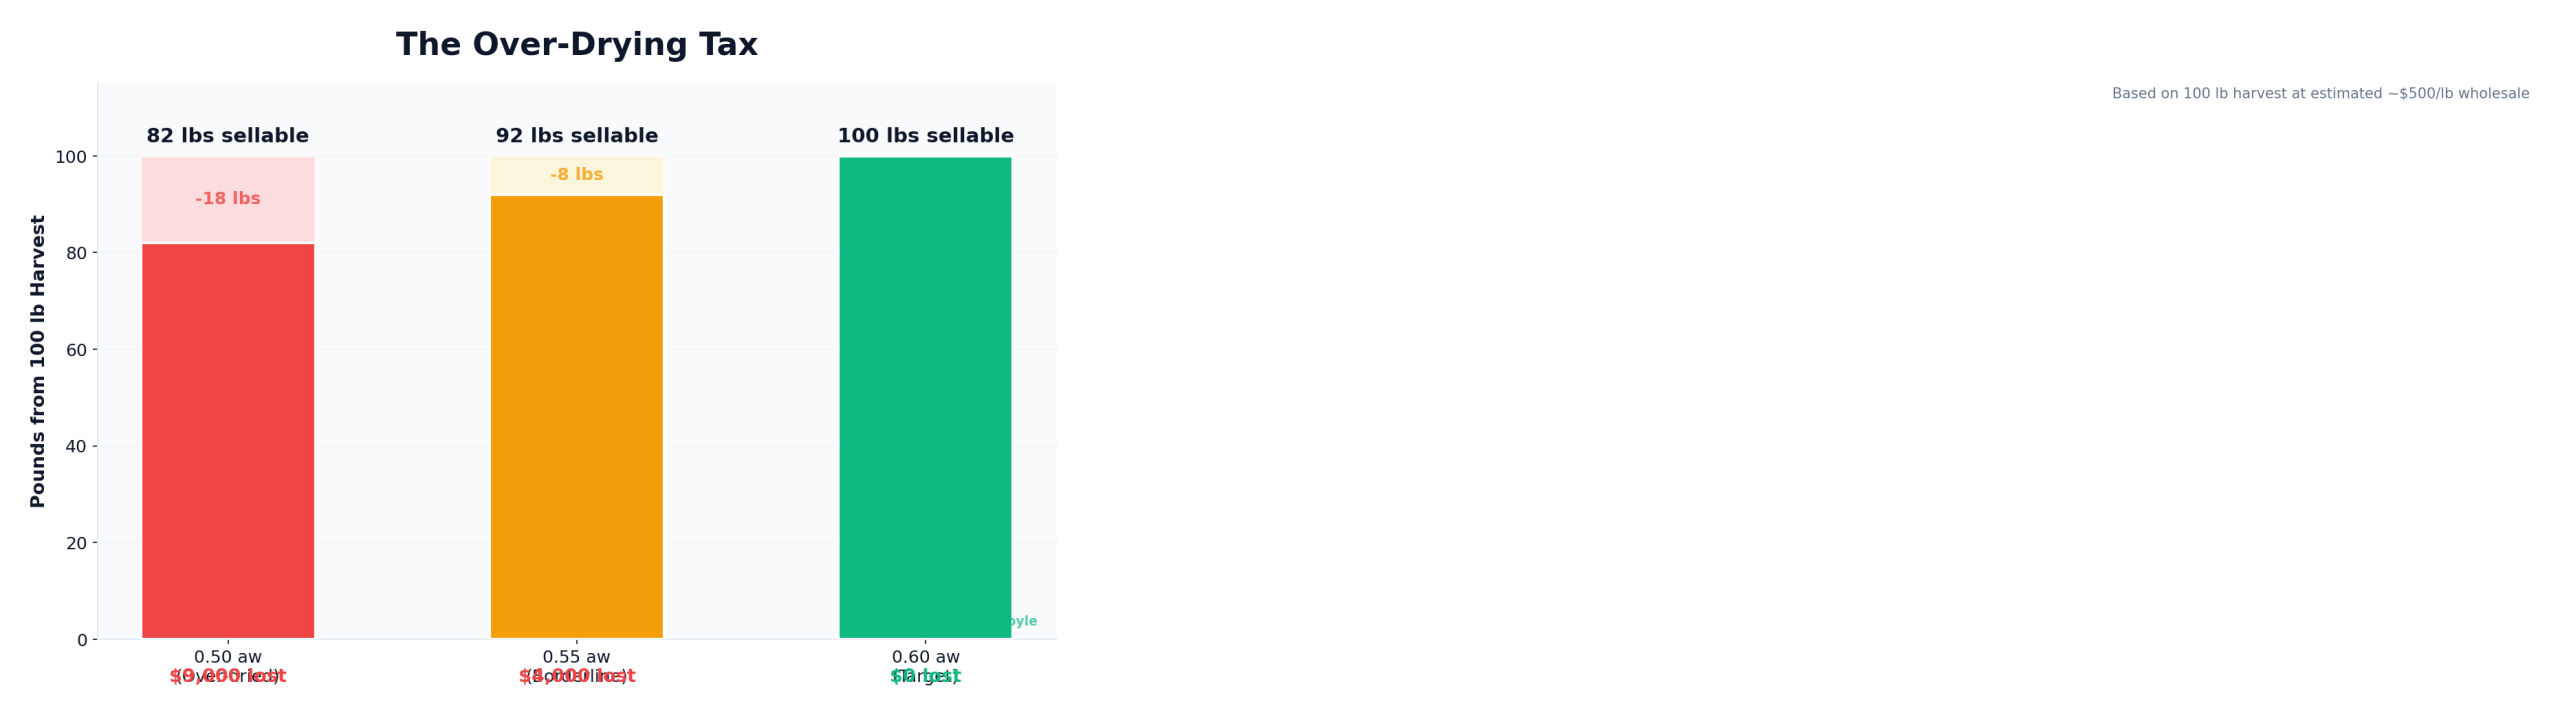
Water activity at cure completion, visual consistency, testing results if available. A run that yields well but finishes with inconsistent water activity has a different problem than one that yields well and cures clean. If water activity monitoring isn’t part of your post-harvest process yet, this guide to water activity explains why it should be.
Environmental Deviations
What weeks saw meaningful drift from targets? Were there periods where VPD, CO2, temperature, or irrigation was outside the intended range? How long, and at what growth stage?
Timeline Adherence
Did the cycle run on schedule? If not, where did it slip? A room that’s dark for an extra week between cycles is a direct cost-per-pound hit that rarely gets attributed correctly.
The Comparison Question
This is where the real insight lives: what was actually different about your best run versus the one that underperformed? Not what you think was different. What does the data show?
Most operations can’t answer this because the data from their best run lives in a different format, a different location, or only in someone’s memory. The comparison never happens because the infrastructure for comparison doesn’t exist.
Batch comparison is how the best facilities answer this question systematically. When two runs are side by side with all the data in the same place, “I think it was the feed program” becomes “VPD ran 0.4 kPa higher in weeks 5 and 6, and EC was 15% lower during the same window.” That kind of specific insight changes what you do next cycle. Speculation doesn’t.
The compounding happens when this review becomes a habit. Not once. Every run. Each cycle builds a knowledge base of what your facility responds to, what early warning signs look like before a yield miss, and what your best runs have in common. That knowledge base is the competitive advantage that accumulates over time and is nearly impossible to replicate quickly. For more on how this compounding plays out across different operation types, this breakdown of how top facilities cut cannabis cultivation costs lays out the pattern.
Building the System
The framework is a progression. Not a one-time project. A system that runs every cycle.
Step 1: Know Your Number
Calculate your actual cost per pound with real numbers: all expenses, all sellable pounds, the full cycle. If you don’t have it yet, start with the free calculator. A rough number is better than no number. But be honest with yourself about the inputs. Halving your expenses to get a friendlier result doesn’t change what it actually costs you to grow a pound.
Step 2: Find Your Weakest Metric
Is the problem yield per light? Consistency? Trim ratio? Turns per year? Energy cost relative to output? Each has a different root cause and a different fix. Trying to improve everything at once is how facilities make lots of changes and see no improvement, because nothing was targeted with enough precision to matter.
If you’re not sure where your biggest gap is, run your numbers through the efficiency scorecard. It benchmarks yield, energy efficiency, canopy utilization, and harvest frequency against published research thresholds and tells you exactly which metric to focus on first.
Step 3: Build the Post-Run Review Habit
After every harvest: yield, quality, environment, timeline. Compare to the previous run and to your best run. Document what changed, what held, and what the data suggests for next cycle. It doesn’t have to be elaborate. It has to be consistent.
The hard part isn’t the analysis. It’s having the data to analyze. If your cultivation records live in METRC and your head, the review will always be speculative. If the data is captured alongside your compliance data but separate from it, the review becomes specific and actionable.
Step 4: Make Changes Based on Data
The most common failure mode in cannabis cultivation improvement is the gut-feel change. Something felt off, so you adjusted the feed. The canopy looked different, so you changed the training. These adjustments may be right. But without a systematic before-and-after comparison, there’s no way to know whether they helped, hurt, or had no effect.
When the post-run analysis shows that EC dropped below target during weeks 4 and 5 in both of your last two underperforming runs, the feed adjustment you make next cycle has a specific hypothesis behind it. You’ll know whether it worked.
Step 5: Repeat
A facility that runs this loop every cycle for two years looks dramatically different on cost per pound than one that runs on instinct. Not because any single change was revolutionary, but because the rate of improvement is consistently positive. In a market that keeps compressing wholesale prices, the operators whose cost per pound declines faster than the market declines are the ones still standing when the shakeout ends.
Where Growgoyle Fits
Growgoyle doesn’t track your costs. It helps you lower them.
The AI batch analysis runs after every completed harvest: full breakdown of what worked, what the data shows, and specific improvement opportunities with estimated pound impact. The Goyle Score gives you a single number across five dimensions (yield, quality, environment, drying, efficiency) so you can track progress over time without manually assembling all the metrics. Batch comparison answers “what was different about that run?” without requiring you to dig through spreadsheets from six months ago.
Daily and weekly AI guidance keeps you current on what needs attention during the cycle, before it becomes a post-harvest conversation. Environmental data feeds the analysis automatically at the Pro tier, so the post-run review has full context.
The software you already have tracks compliance. It doesn’t tell you why your best strain stopped performing. That’s the gap Growgoyle fills.
Know your number. Find your weakest metric. Build the review habit. Upload a few canopy photos, complete a batch, and see what the AI surfaces. Try it free on your own plants.
About the Author
Eric is a 15-year software engineer who operates a commercial cannabis cultivation facility in Michigan. He built Growgoyle to solve the problems he faces every day: inconsistent yields, forgotten lessons from past runs, and the constant pressure to lower cost per pound in a compressing market. Every feature in Growgoyle comes from real growing experience, not a product roadmap.