Category: AI Cultivation

  • When Every Run Feels Like Survival Mode

    When Every Run Feels Like Survival Mode

    When Every Run Feels Like Survival Mode

    You finish a run. The numbers come back fine. And somehow it still doesn’t feel like enough.

    Not because anything failed. Because the distance between “fine” and “not viable” has been shrinking without announcement. A cannabis cultivation run that would have been perfectly acceptable two years ago barely covers costs today. The grow didn’t change. The market did.

    I talk to cannabis operators across multiple states. The thing I hear most often isn’t “my plants are struggling.” It’s “the math is struggling.” Experienced growers. Solid teams. Facilities that run well by any reasonable measure. And a persistent, low-grade pressure that reshapes how every decision gets made.

    This is for that operator. The one who’s putting in the work and still feeling like the ground keeps shifting underneath them.


    The Cannabis Cultivation Math Changed and Nobody Sent a Memo

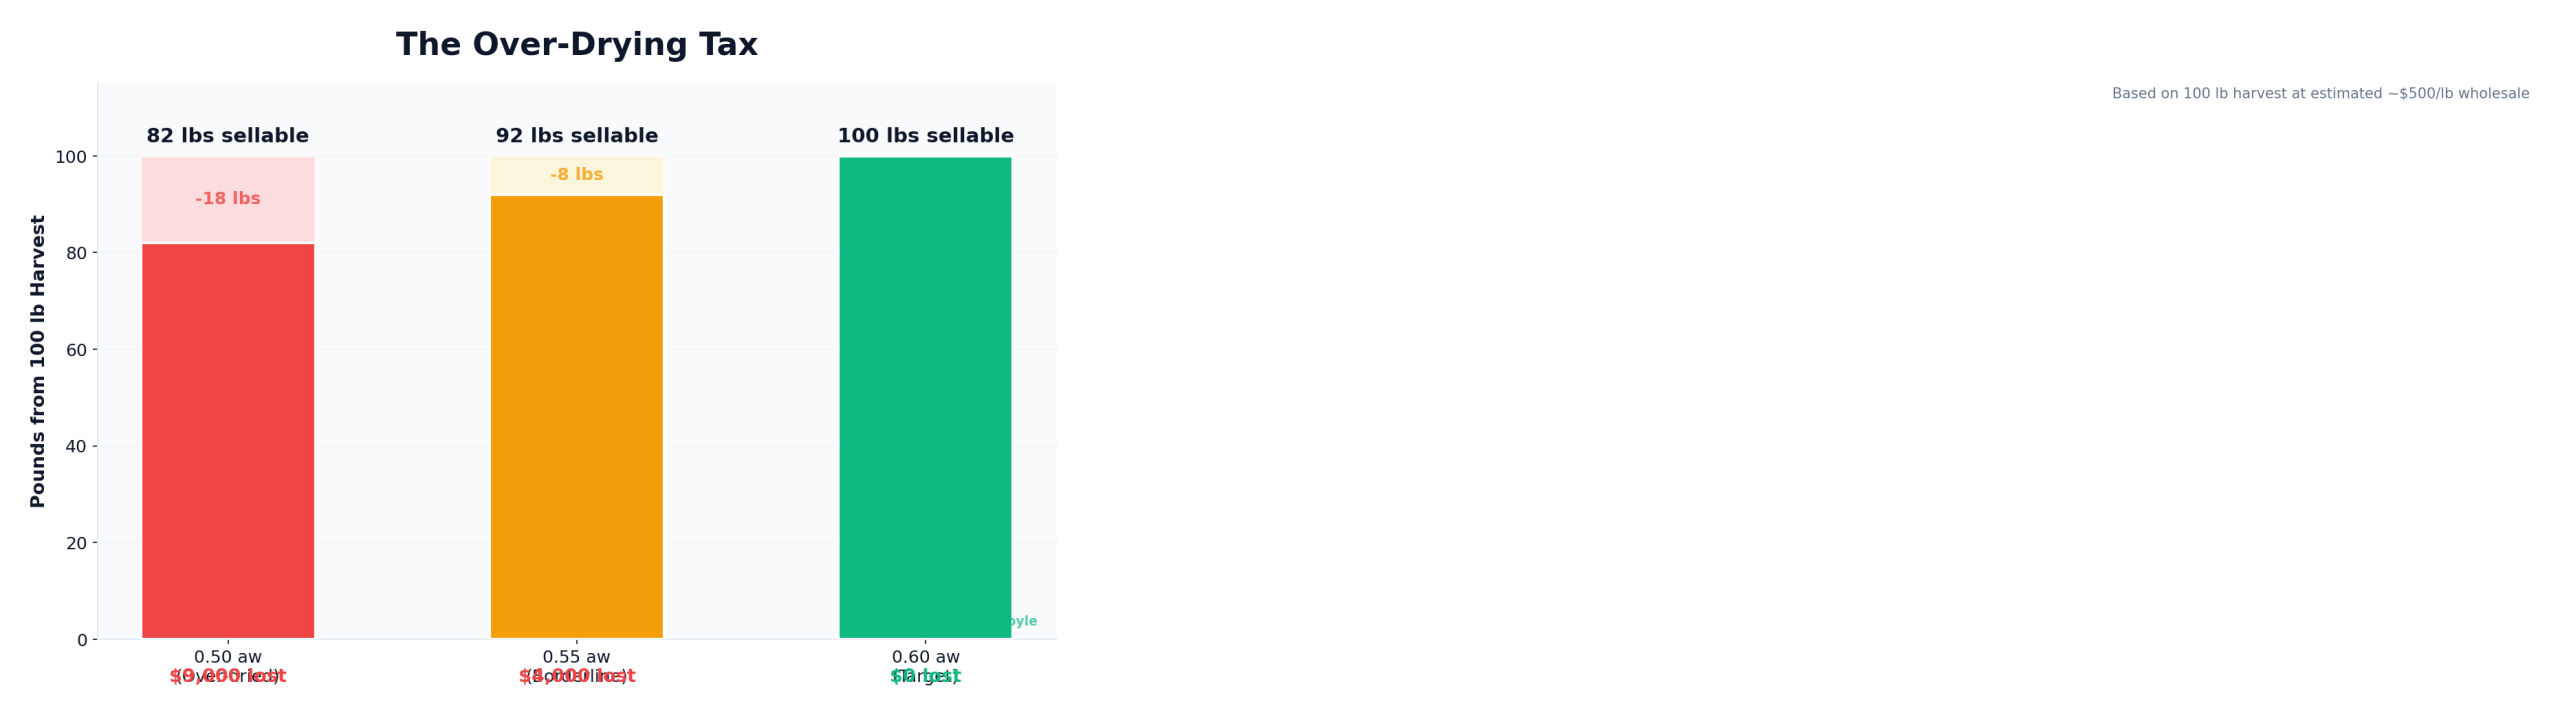
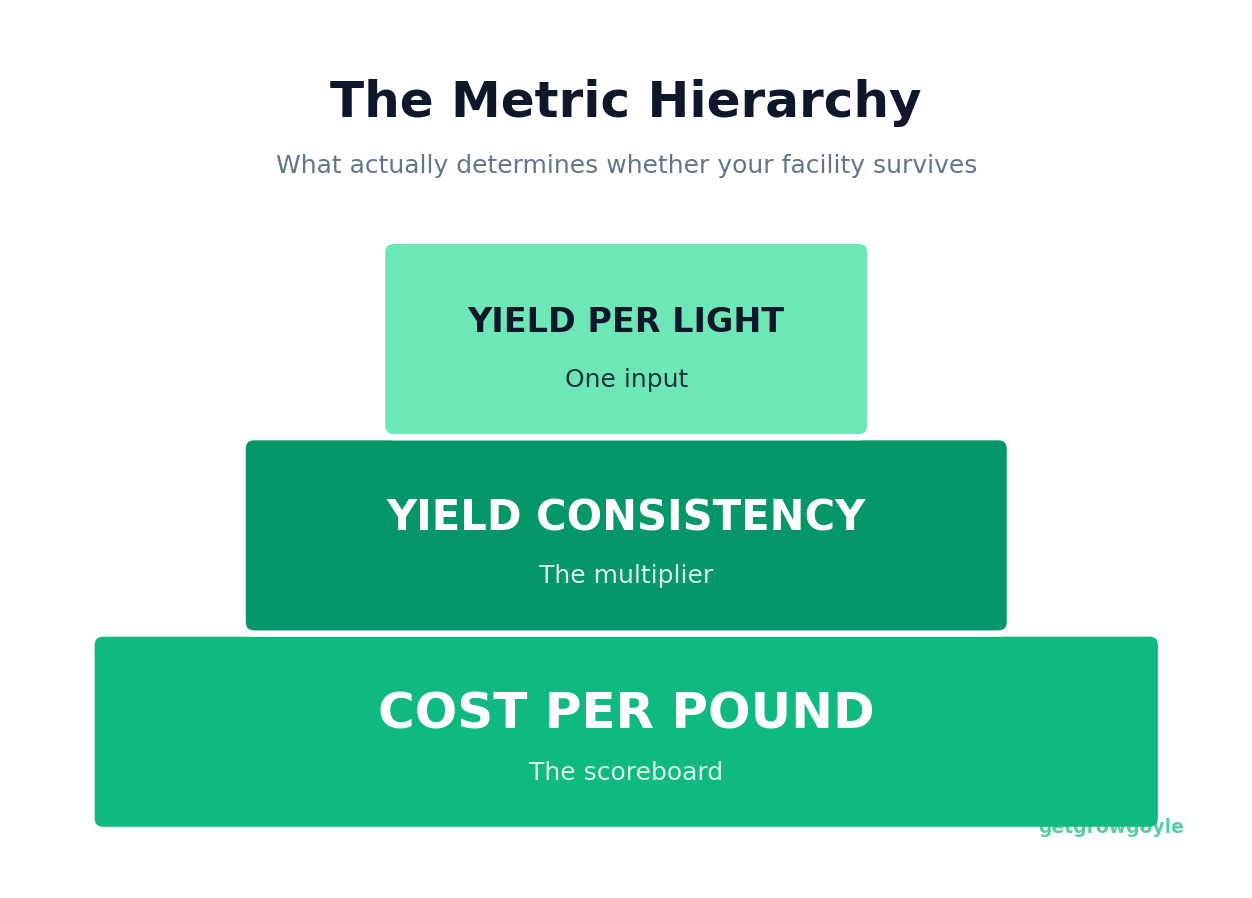
    Wholesale pricing for cannabis has been compressing for years, and the compression isn’t slowing down. The $600-plus per pound that felt like a baseline five years ago is now a ceiling in many markets, with averages sitting in the $500-600 range and continuing to drop in mature states. Understanding what your cost per pound actually is has become the starting point for every conversation about whether an operation survives.

    Michigan is a useful case study. In 2025, 85 licenses were surrendered. The state recorded its first year-over-year decline in active growers. Nationally, roughly 13% of all cannabis licenses disappeared inside a two-year window. Those aren’t bad operators getting weeded out by natural selection. Some of them are competent growers who couldn’t get their cost per pound below what the market was willing to pay. The grow was fine. The math wasn’t.

    That’s what survival mode actually is. Not a crisis. Not a failure state. It’s the condition where margins are thin enough that a single below-average run threatens your quarter. And once you’re there, something shifts. The focus narrows to “don’t lose this run,” and the longer arc of getting better gets quietly deprioritized.

    That’s the trap. Not the margins themselves. The decision pattern the margins create.

    When every run carries survival-level weight, you stop experimenting. Every adjustment feels risky. Every new system feels like overhead. The operation gets conservative at exactly the moment it needs to get smarter. And each quarter in that mode is a quarter where the competition’s improvement rate is outpacing yours.


    You Can’t Outwork a Structural Problem

    The natural response to margin pressure is effort. More hours. Leaner staffing. Cut everything that isn’t essential. I’ve watched operators run this playbook and I understand the instinct. Effort is the one variable you actually control.

    But it has a floor.

    There’s a ceiling on how many hours you can personally run. There’s a limit to how lean staffing can get before quality degrades. There’s a point where the easy costs are already cut and what remains is structural. Working harder doesn’t move those constraints.

    The cannabis operations I’ve seen break out of survival mode didn’t do it by running harder. They did it by learning faster. Specifically, they got systematic about turning each run’s data into a higher baseline for the next one.

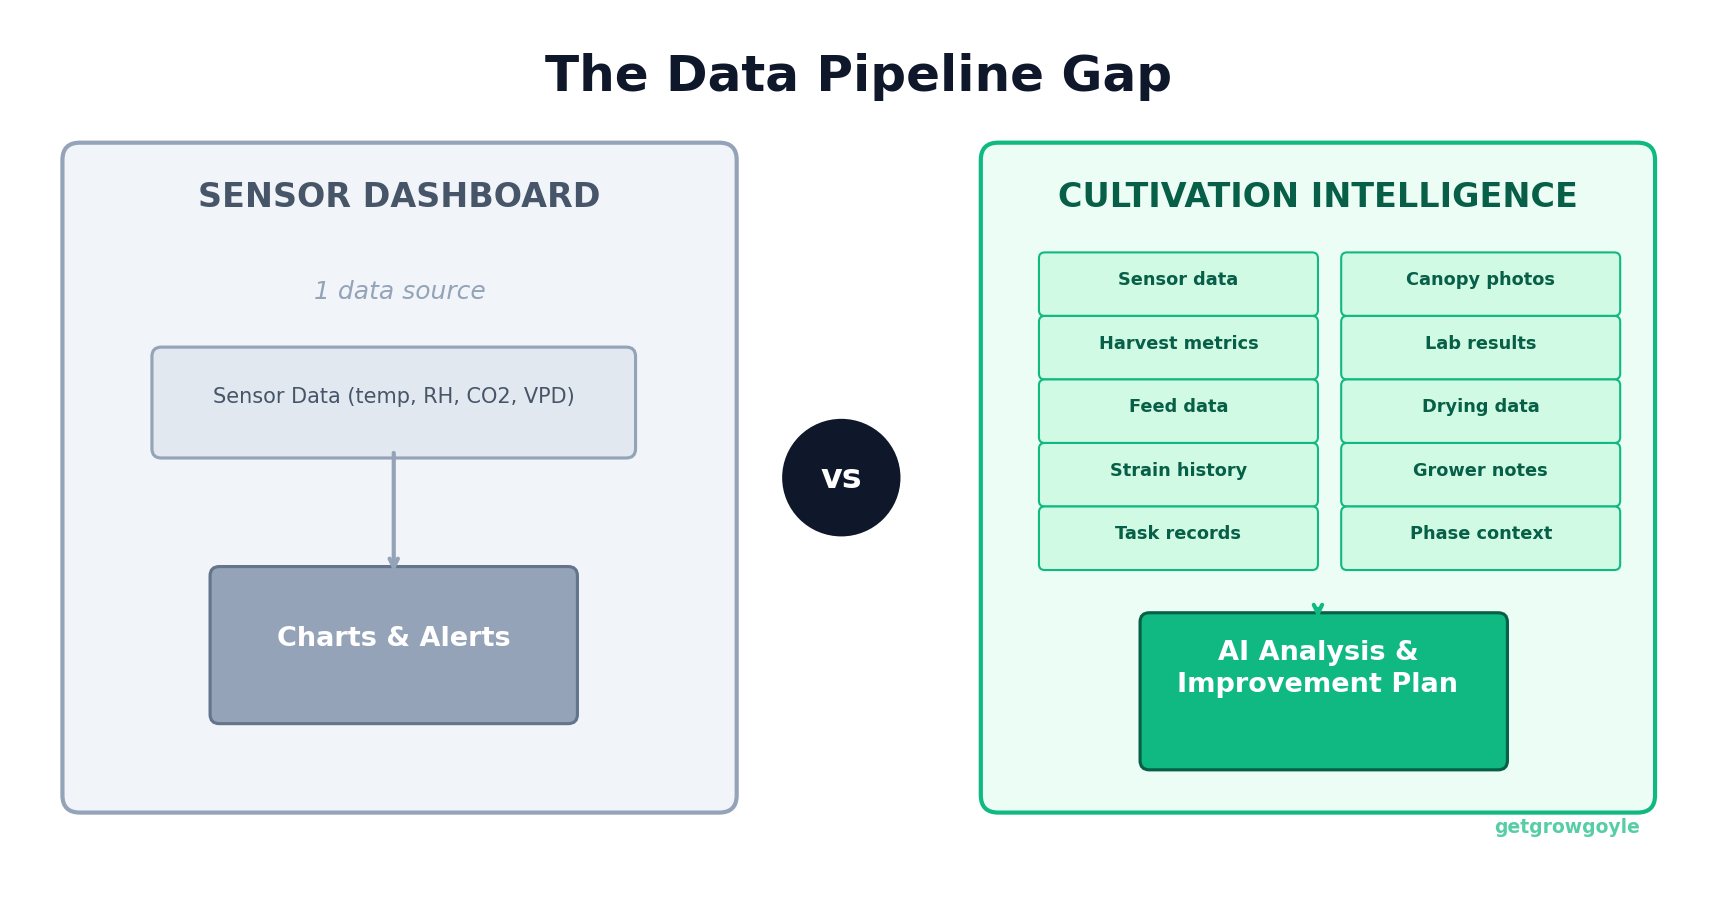
    Here’s what that looks like in practice. After a run, most operations do some version of a debrief. Something was off in week 3. Drybacks were inconsistent. The canopy was uneven. Notes go somewhere (maybe), and then the next run starts fresh. The knowledge from that run doesn’t accumulate. It either lives in someone’s head or gets partially captured and partially forgotten.

    Now compare that to an operation where every run produces a structured breakdown: what the data showed worked, what would have added yield with specific estimates, what changed from the last run. The next run doesn’t start at zero. It starts at a higher baseline.

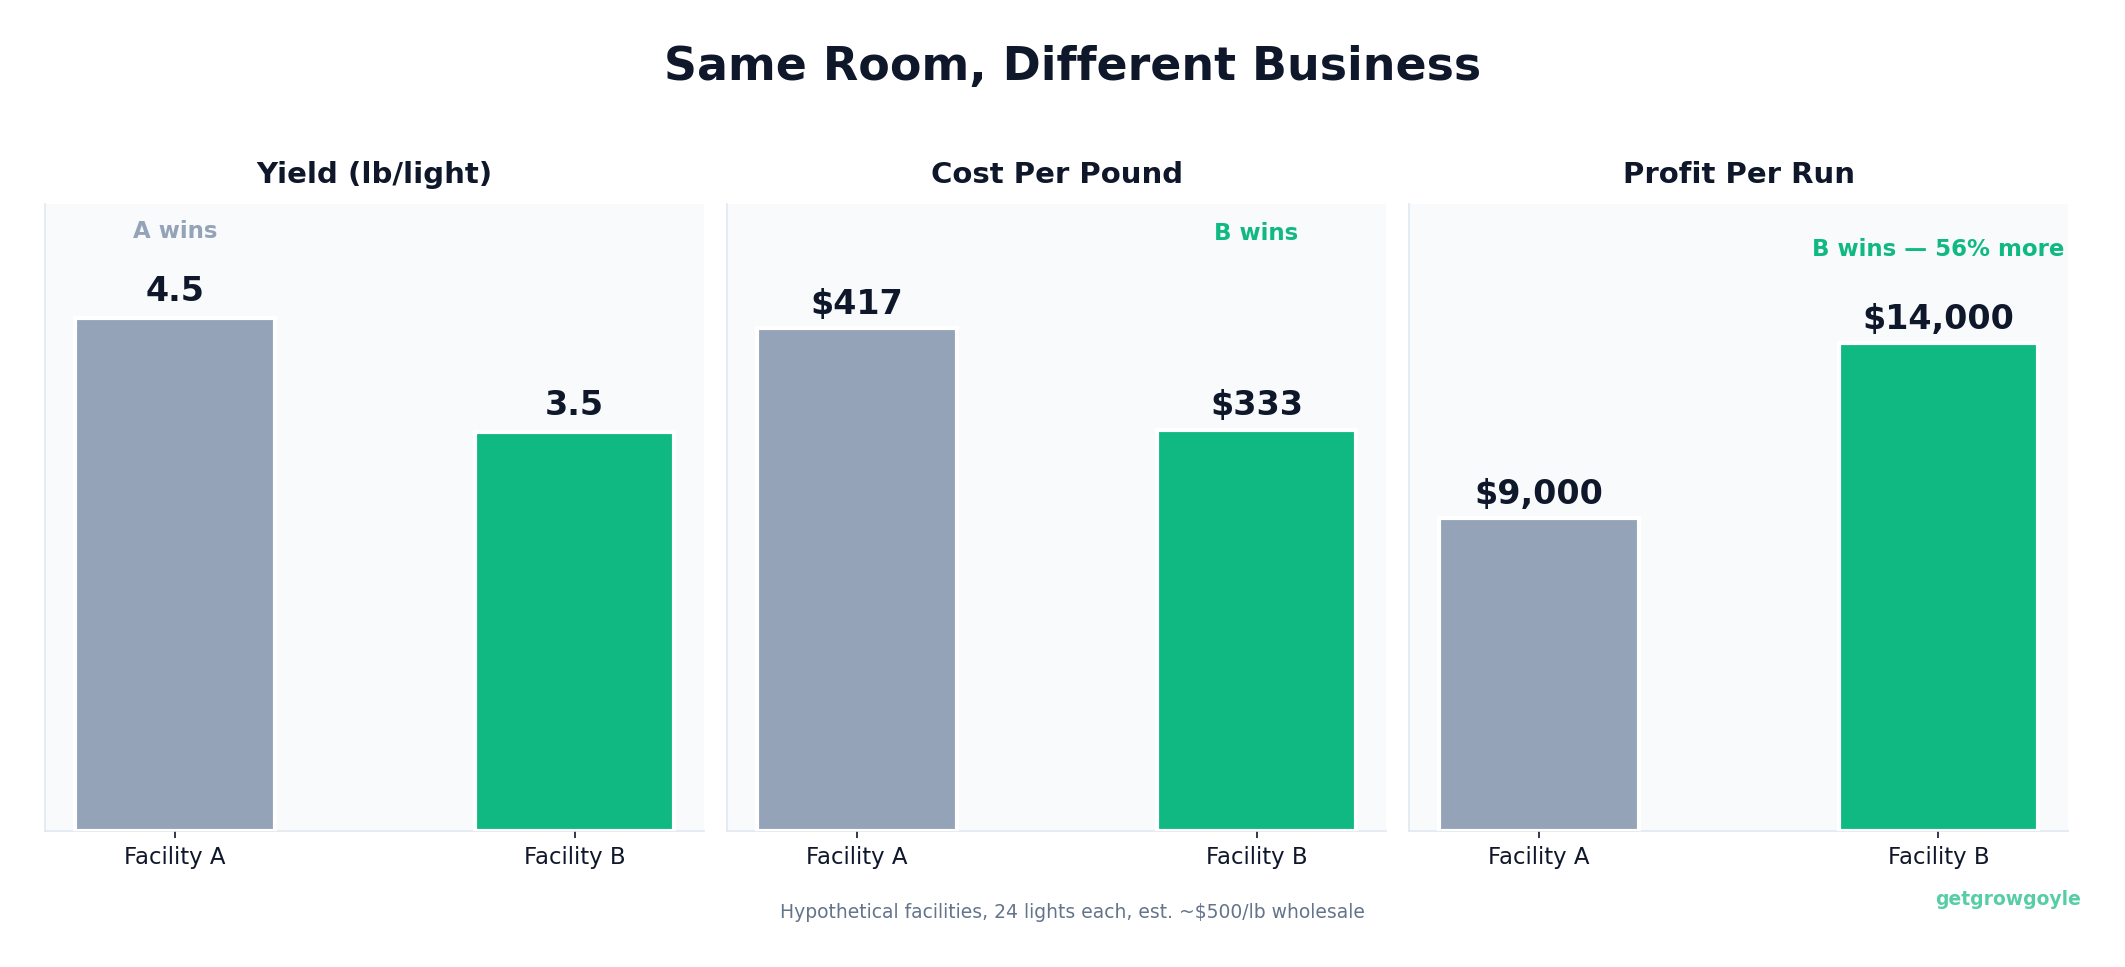
    That’s the gap. Not skill. Not genetics. Not equipment. The gap between survival mode and sustainable improvement is almost always a consistency problem, not a yield problem. The best run was great. The average run is what actually pays the bills. And if the best run can’t teach the average run anything, those two numbers stay far apart.


    Can You Improve Faster Than the Market Compresses?

    Here’s the actual survival equation: it’s not whether you’re profitable today. It’s whether your improvement rate is steeper than the market’s compression rate.

    If wholesale drops 8-10% per year and your operation improves 2% per year, the math eventually catches up regardless of how well you grow. If your operation improves 12% per year, the trajectory starts working in your direction. The question isn’t “can I make it through this run.” It’s “is what I’m building getting better faster than the market is moving against me.”

    The operations that improve fastest share one pattern. They treat every batch as a data point, not just a harvest. What worked in this run. What changed from the last one. What their best run looked like, and how this one compared. That analysis lives in a system, not just in someone’s memory.

    When improvement analysis lives only in your head, the improvement rate is limited by how fast you can personally process and retain. When it lives in a system that compares runs, surfaces patterns, and identifies specific opportunities after every harvest, the rate compounds. Each run adds to a knowledge base. The knowledge base makes the next run better. That cycle is what separates operations that are building something from ones that are just getting through it.

    Yield consistency is the underlying driver, and it gets underestimated. Hitting a strong number once isn’t a business. Hitting a reliable number run after run, with a clear system for improving that number incrementally, is how cost per pound comes down over time. Batch-over-batch improvement is compounding in the most direct sense: each run adds to the baseline the next one starts from.

    The operators who are gaining ground in compressed markets aren’t doing it because they had some breakthrough strain or installed better equipment. They’re doing it because their system for learning from every run is faster and more specific than everyone else’s. That’s a replicable advantage. It doesn’t require genetics luck or a capital infusion.


    The Shift: From Reacting to Compounding

    Survival mode is reactive by definition. Something happens in a run, you respond. Next run, something different happens, you respond again. Each run feels like starting over because there’s no system carrying the lessons forward. The knowledge doesn’t stack.

    The shift out of survival mode isn’t a single change. It’s a posture shift: from treating each run in isolation to building a system where every run feeds the next one.

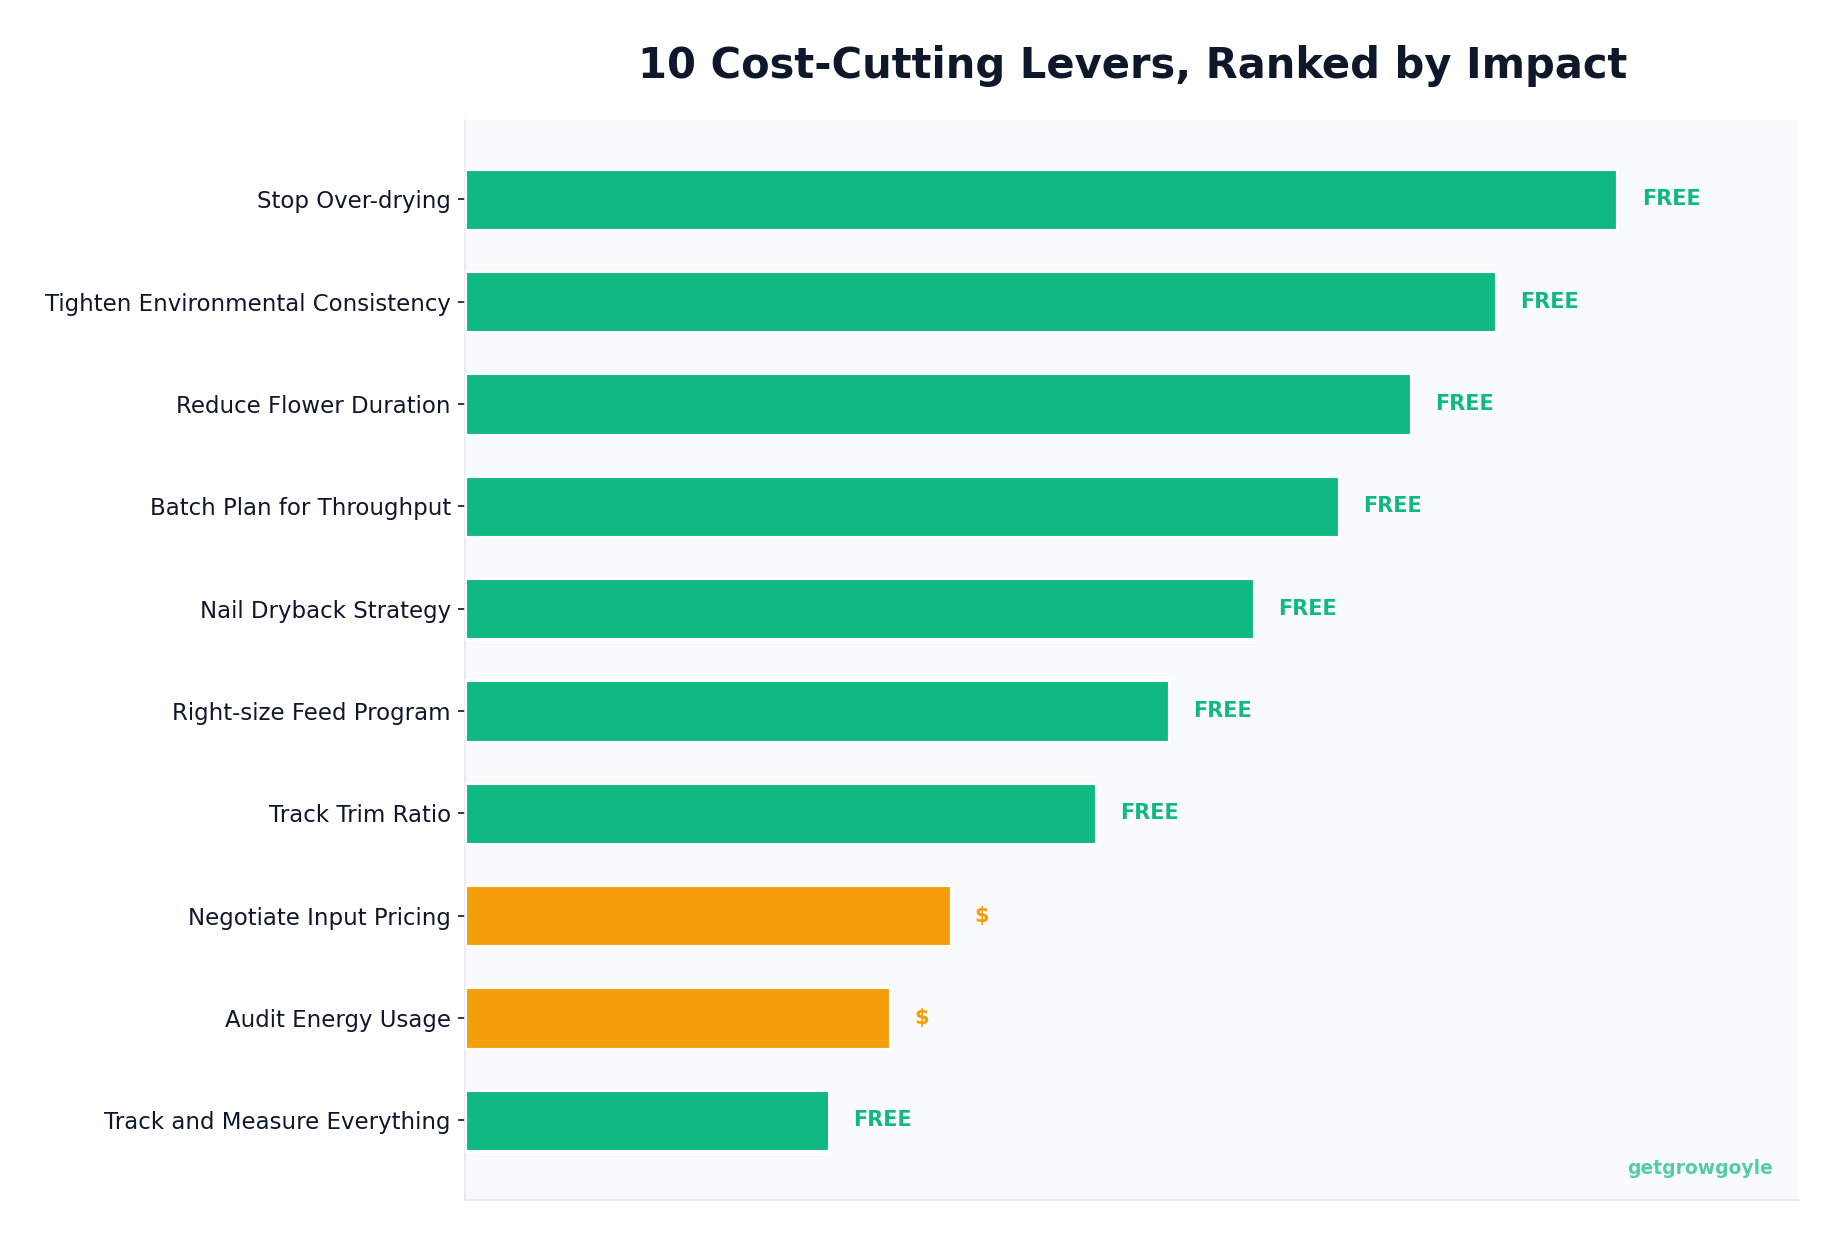
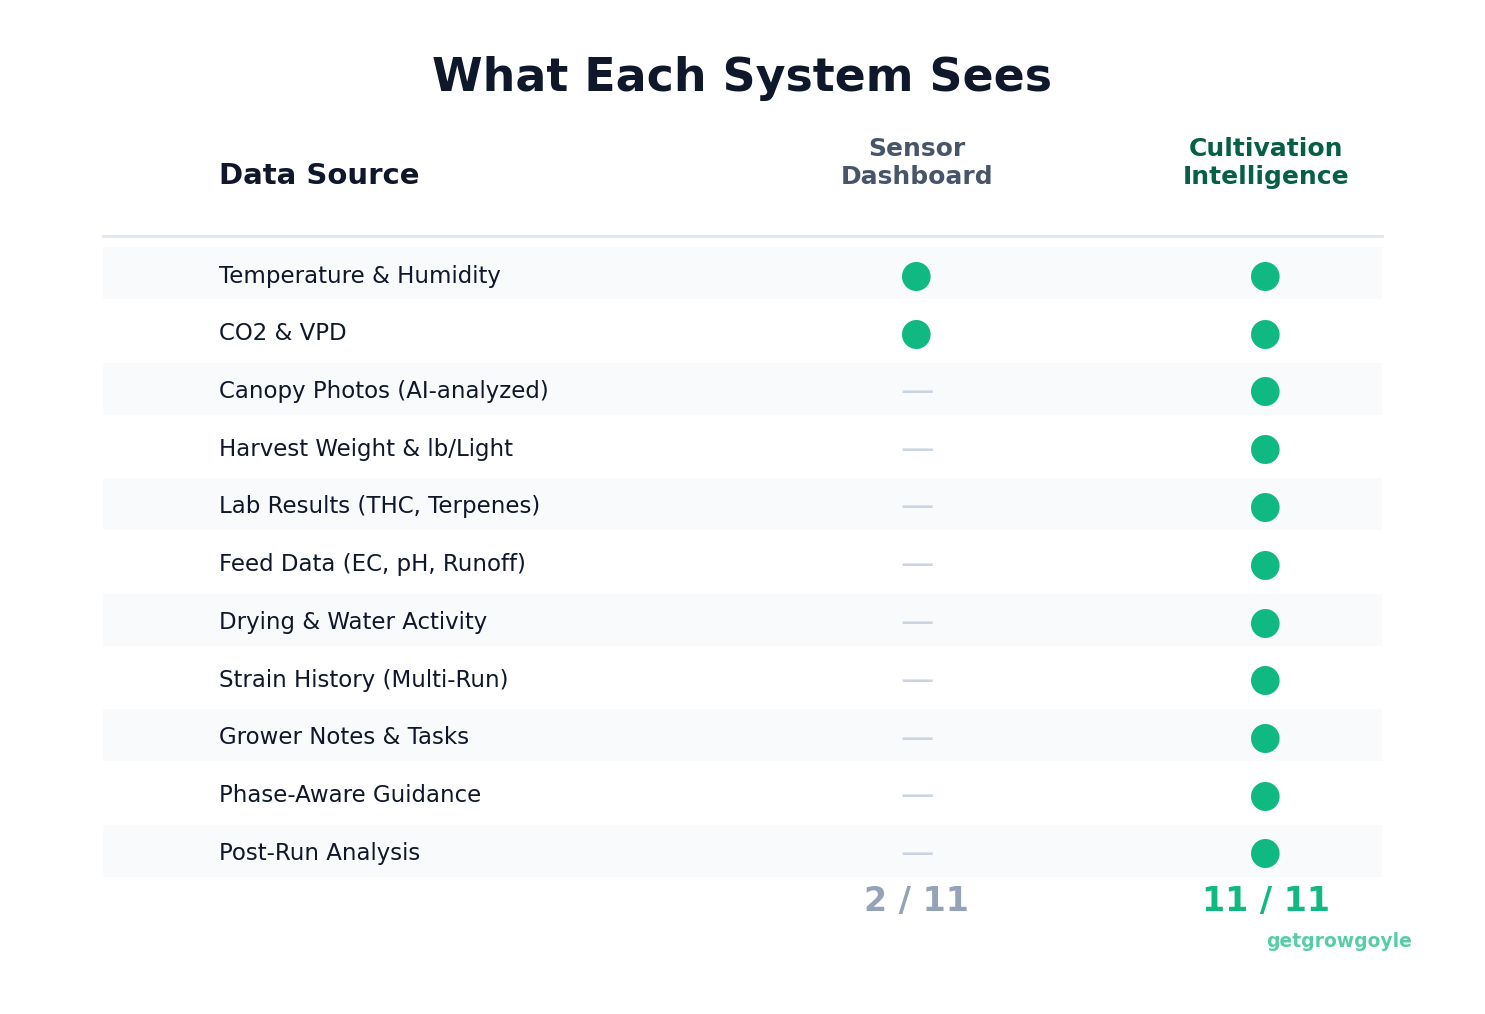
    What that looks like in practice is post-run AI batch analysis that identifies the 3 specific things that would have added yield, with enough detail to act on. It’s run comparison that shows exactly what changed between a strong harvest and a mediocre one, so the pattern is visible instead of vague. It’s scheduling that accounts for where you are in the growth cycle rather than a static task list. And it’s enough operational visibility that one person isn’t the only one carrying the full picture in their head.

    I built Growgoyle because I watched good operations stay stuck. Not from lack of skill or work ethic. But because the knowledge from each run wasn’t accumulating in a way that made the next one better. The experience was there. The system for turning that experience into compounding improvement wasn’t.

    The Goyle Score gives every run a 0-100 score across five dimensions: yield, quality, environment, drying, and efficiency. Each run is scored against your own history, not some industry benchmark that doesn’t apply to your setup, your genetics, or your zone configuration. The point isn’t to judge the run. It’s to give the post-run analysis something concrete to work with so the next run starts from a defined baseline rather than a feeling.

    Batch comparison takes it a step further. “Here’s what made that great run great.” The AI pulls the data from your best run and compares it directly to a recent one, surfacing exactly what changed. No guessing. No retrofitting a narrative onto the data. The pattern either shows up in the numbers or it doesn’t.

    The growers who are building durable cannabis operations in this market aren’t the ones who’ve avoided problems. Every operation has problems. The ones building something sustainable are the ones whose rate of improvement outpaces the rate the market is compressing. That comes from systematizing what you already know, run after run, so none of it gets lost between harvests.

    You don’t need another system that adds to your workload. The operators I talk to are already carrying more than enough. What changes the trajectory is a system that compounds what you already know. Every run adds to it. Every analysis makes the next one more specific. Every comparison shows something that was invisible when the data was scattered across notes, memory, and a whiteboard that gets erased.

    The question isn’t whether cannabis cultivation is still viable for mid-size operators. Operators are building real businesses in compressed markets right now. The ones doing it have stopped trying to outwork the compression. They’ve built systems that learn faster than the market can squeeze.


    Growgoyle doesn’t track your costs. It helps you lower them. See the full system built by a grower who got tired of carrying it all in his head. See how it works.

    About the Author

    Eric is a 15-year software engineer who operates a commercial cannabis cultivation facility in Michigan. He built Growgoyle to solve the problems he faces every day: inconsistent yields, forgotten lessons from past runs, and the constant pressure to lower cost per pound. Every feature in Growgoyle comes from real growing experience, not a product roadmap.

  • 10 Ways to Cut Cannabis Cultivation Costs Without Cutting Corners

    10 Ways to Cut Cannabis Cultivation Costs Without Cutting Corners

    10 Ways to Cut Cannabis Cultivation Costs Without Cutting Corners

    Everyone in cannabis talks about yield. Fewer people talk about what it costs to produce that yield. You can pull 4 lb/light and still lose money if your cost per pound sits above wholesale price. Yield without cost discipline is a treadmill. You’re moving fast and going nowhere.

    These 10 changes actually lower your cost per pound. None of them involve buying cheaper nutrients or skipping a defoliation. These are operational changes, not quality sacrifices. Some cost nothing. A few require a modest tool purchase. None require a capital equipment overhaul.

    If you want to understand what cost per pound actually means for your cannabis operation and why it’s the metric that determines survival, start there. If you already know the number and want to move it, keep reading.


    1. Tighten Your Environmental Consistency

    Every degree of temperature swing costs you. Wide swings stress plants, reduce metabolic efficiency, and suppress yields in ways that are easy to miss because they don’t show up as dramatic deficiencies. They show up as a run that was “fine” instead of great.

    The difference between a cannabis grow room that holds 78-80°F and one that swings 74-84°F can be 10-15% yield on the same genetics with the same feed program. You’re already paying for the HVAC. The cost of tighter control is attention and tuning, not new equipment.

    VPD consistency matters just as much. Plants in a room that holds 1.2-1.4 kPa VPD throughout canopy hours transpire steadily and uptake nutrients efficiently. Plants in a room that swings from 0.8 to 1.8 are constantly adjusting stomatal aperture. That metabolic overhead comes out of yield.

    Check your overnight temps, your lights-off period, your transition ramps. Fix those before buying anything new.


    2. Stop Over-drying (This Is Free Money)

    If I had to pick one single change that recovers the most money for the most cannabis facilities, it’s this one. Over-drying destroys weight you already grew, already paid to grow, and already harvested. It costs you nothing to fix except attention.

    If your water activity is sitting below 0.55 aw, you’re literally evaporating product. Target 0.55-0.63 aw for compliant, stable flower that doesn’t lose a pound it didn’t have to lose. The difference between 0.50 aw and 0.60 aw on a 100 lb harvest can be 15-20 lbs of dry weight. At estimated ~$500/lb wholesale, that’s $7,500 to $10,000 you dried into thin air. Per harvest.

    A $200 water activity meter pays for itself on the first harvest. If you don’t have one, get one this week. Check it on every batch. Log the number.

    For a full breakdown of targets, technique, and common mistakes, the cannabis water activity guide covers it in detail. This one change, consistently applied, is the fastest route to recovering margin without touching anything else in your operation.

    The Over-Drying Tax - weight loss at different water activity levels
    The Over-Drying Tax: weight lost at different water activity levels on a 100 lb harvest at estimated ~$500/lb wholesale.

    3. Track Your Trim Ratio

    If you’re trimming 20% or more of your gross weight, you have a canopy management problem, a genetics problem, or a light penetration problem. Probably a combination.

    Trim labor is expensive. Trim product (if you can move it at all) sells for a fraction of flower. An uneven canopy (popcorn, larf, poor light penetration) means more trim labor and less sellable product per hour worked. Your trim ratio tells you immediately how bad the problem is.

    Goal: get trim ratio under 15%. Better canopy uniformity, better light distribution, and strategic defoliation all move this number. None of them cost money. They cost discipline and time in the grow room.

    More importantly, track it batch over batch. A trim ratio that climbs from 14% to 18% to 22% across three or four runs isn’t random variation. Something changed. Could be a new phenotype expression, a defoliation timing shift, or light degradation you haven’t caught yet. The trend is the signal.

    For deeper detail on what drives trim ratio and how to bring it down, cannabis trim ratio optimization is worth the read.


    4. Right-size Your Feed Program

    Overfeeding doesn’t produce bigger cannabis plants. Past a certain point, it produces salt stress, nutrient lockout, and waste. You’re spending money on inputs the plant can’t use and then spending more on flush cycles to clear the buildup.

    Run runoff EC tests consistently. If your runoff EC is sitting 30% or more above your input EC, you’re pushing more nutrients than the root zone can process. That’s money going down the drain. Literally.

    The fix isn’t cheaper nutrients. It’s dialing in your feed rate so you’re not wasting what you already bought. Pull back on the input EC, watch your runoff, and find the equilibrium. Most growers find they can reduce nutrient costs 10-20% without any change in plant performance once they start measuring instead of guessing.

    Document your input EC, runoff EC, and pH for every irrigation event across a full run. The pattern will tell you exactly where to make adjustments.


    5. Nail Your Dryback Strategy

    Consistent, aggressive drybacks (25-35%+ VWC reduction between irrigations) steer cannabis plants toward generative growth. More flower, less vegetative bulk, better structure. Inconsistent drybacks create unpredictable root zone stress. Some days 15%, some days 40%, no clear rhythm. Plants respond to that chaos by prioritizing survival over reproduction.

    This costs nothing to implement. You’re irrigating either way. Dryback precision is about timing and measurement, not additional inputs. Better drybacks produce better yields from the same plants under the same lights with the same nutrients. That’s cost per pound improvement with zero additional spend.

    Track your substrate moisture sensors batch over batch. If your drybacks are inconsistent across a run, figure out why. Was it timing? Irrigation system response time? Room humidity affecting transpiration rates? The answer is in the data. If you want the full picture of how dryback fits into a broader crop steering strategy for commercial cannabis, that’s worth understanding before you start adjusting irrigation schedules.


    6. Reduce Your Flower Duration (If the Strain Allows)

    Every extra day in flower costs electricity, labor, nutrients, and facility time. Some strains finish in 56 days. Some growers run them 70 “just to be safe.” That’s two extra weeks of operating cost per batch for no additional product.

    Know your strain’s actual finish window. Track trichome maturity consistently across runs. Harvest on time, not on instinct.

    Here’s the math: if you can shave 10 days off a 70-day flower cycle reliably, you add nearly one full extra harvest per year in that room. Fixed costs (rent, depreciation, insurance) don’t change. You’re getting more product from the same facility cost base. Cost per pound drops without touching a single input.

    This only works if you have the strain data to support it. Don’t rush a run that needs more time. But don’t drag out a run that’s ready because you’re not sure. Know the difference.


    7. Batch Plan for Throughput

    Dead room days are pure cost. A room sitting empty between flips is still running electricity, still accruing rent, still depreciating your equipment. It’s producing nothing.

    Plan your batch pipeline so rooms flip within 2-3 days. Stagger your batches so harvest prep and transplant activities overlap cleanly. This isn’t complicated scheduling, but it takes intentional planning. Most facilities that struggle with room downtime don’t have a workflow problem. They have a visibility problem. Nobody has a clear view of when each room is finishing, what’s queued, and where the bottleneck is.

    At 23 harvests per year versus 20, you’re pulling 15% more product from the same facility. Fixed costs don’t change. Revenue goes up. Cost per pound drops. The only investment is better planning.


    8. Fix Your Lighting Uniformity

    Even with quality fixtures, the question is: are they positioned right? Running the right intensity for the phase? Producing uniform light distribution across the canopy?

    A $30 PAR meter and 20 minutes of measurement can reveal that your “1000 PPFD” canopy actually ranges from 650 to 1200 PPFD across the footprint. The low spots are producing popcorn and larf. You’re paying for light you’re not converting into sellable flower.

    Uniform light produces a uniform canopy. A uniform canopy means less trim labor, better yield distribution, and more consistent results batch over batch. Map your PPFD at canopy height before each run. Adjust fixture height and positioning until you’re within 15-20% variance across the footprint. Do it once per strain per room and document the result.

    If you’re still on HPS, the economics of LED conversion work in most scenarios within 12-18 months on electricity savings alone, with yield improvements on top. Run the numbers for your facility specifically before committing, but don’t skip the analysis because you assume it won’t pencil.


    9. Audit Your Labor Hours

    Most cannabis facilities don’t actually know what it costs in labor to produce a pound. They know their total payroll. They know headcount. They don’t know hours per task, hours per batch, or hours per pound produced.

    Start tracking it. Log hours by task type: daily plant maintenance, irrigation, training, defoliation, harvest, trim, cleaning. Then attribute those to batches. At the end of each run, you’ll have a labor cost per batch. Divide by dry weight and you have labor cost per pound.

    The biggest labor costs in most facilities are trim, harvest, and daily maintenance. Anything that reduces trim weight (better canopy management), speeds harvest prep (better batch planning), or streamlines daily tasks directly reduces labor cost per pound. You don’t need to push your team harder. You need to direct them toward the tasks with the highest return.

    Phase-aware scheduling helps here. The tasks that matter in week 2 of flower are different from week 6. Having a clear schedule that reflects what phase each room is in means less time figuring out what to do and more time doing the things that matter.


    10. Measure Everything, Then Compare

    You can’t cut costs you can’t see. And you can’t improve what you don’t compare.

    Track your cost per pound per batch. Compare the last run to the one before it. Compare the same strain across different seasons. Look for the outliers, both the great runs and the disappointing ones, and figure out what was different. Was it environment? Feed timing? A team change? A genetics lot? Something always explains the variance. Find it.

    This is where batch-over-batch comparison becomes more valuable than any single metric. One great run is luck. A pattern of great runs is a process. The comparison work is what turns luck into process.

    Most growers track yield because it’s the obvious number. Better growers track cost per pound because it’s the number that determines whether the business survives. Great growers compare both across every run and can tell you exactly what made their best batch great and exactly what went sideways on their worst one.

    That level of operational knowledge compounds. Every batch you measure and compare gets a little better. After four or five cycles of serious batch-over-batch review, the cumulative improvement is significant. It doesn’t happen from a single good run. It happens from consistent measurement and honest comparison.

    10 Cannabis Cost-Cutting Levers Ranked by Impact
    10 cost-cutting levers ranked by relative impact on cost per pound. Most of them cost nothing to implement.

    Understanding how batch-over-batch improvement actually works in commercial cannabis is worth spending some time on if you’re not already doing it systematically.

    📊 Free Tool: Cannabis Cost Per Pound Calculator
    Know your number before you try to lower it. Our free cost per pound calculator has 27 expense categories, tax presets for major states, and what-if yield modeling. No signup required.

    The Compounding Effect

    None of these tips is a silver bullet. Tightening your VPD consistency is worth something. Fixing your dryback strategy is worth something. Reducing flower duration by 10 days is worth something. But doing all ten of these, consistently, across every batch? That’s where cost per pound actually moves in a meaningful way.

    The cannabis operations pulling the best margins aren’t doing one magic thing. They’re doing a dozen ordinary things with discipline and consistency. They measure. They compare. They adjust. They don’t forget what they learned last cycle.

    Tracking all of this by hand is possible for one room, one strain, one grower. Doing it consistently, batch after batch, across multiple rooms and strains and team members? That’s where most facilities fall off. Not because they don’t care. Because there’s no system holding it together.


    Growgoyle doesn’t track your costs. It helps you lower them. After each run, you get a full AI breakdown of what worked, what to improve, and where your yield, quality, and efficiency gaps are hiding. Upload a few canopy photos mid-run and see what the AI catches in 60 seconds. Try it free on your own plants.

    About the Author

    Eric is a 15-year software engineer who operates a commercial cannabis cultivation facility in Michigan. He built Growgoyle to solve the problems he faces every day: inconsistent yields, forgotten lessons from past runs, and the constant pressure to lower cost per pound. Every feature in Growgoyle comes from real growing experience, not a product roadmap.

  • Sensor Dashboard vs. Cultivation Intelligence: What’s the Difference?

    Sensor Dashboard vs. Cultivation Intelligence: What’s the Difference?

    Sensor Dashboard vs. Cultivation Intelligence: What’s the Difference?

    You probably have sensors. You probably have a dashboard. You can check your temp and RH from the couch at 11pm without putting your shoes on. Congratulations. So can every other cannabis grower in your state.

    The question isn’t whether you can see your data. The question is whether your data is actually making your grows better, batch after batch. Are you pulling more pounds per light than you were six months ago? Is your trim ratio tightening? Are your lab results trending the direction you want?

    If the honest answer is “sort of” or “I’m not sure,” you’re probably confusing two things that look similar on the surface but do completely different jobs: a sensor dashboard and cultivation intelligence. Most cannabis growers don’t realize these are two separate categories. They assume more data visibility means better grows. It doesn’t. Not automatically.

    Here’s how to think about the difference, and why it matters more than most facility owners recognize.


    What a Sensor Dashboard Actually Does

    A sensor dashboard does one thing well: it collects environmental data and displays it. Temperature, relative humidity, CO2 levels, VPD, light intensity, soil moisture. It logs the numbers, draws the charts, and sends you an alert when something crosses a threshold you set.

    That’s genuinely useful. Real-time monitoring catches equipment failures before they kill a room. An HVAC going down at 2am is a disaster you want to know about at 2am, not at 9am when you walk in. If your sensor system has tight alerting on mission-critical equipment, keep it running. That infrastructure matters.

    But here’s the ceiling, and it’s a hard one: a sensor dashboard shows you numbers. The interpretation is 100% on you.

    Your dashboard knows your canopy was at 84F and 62% RH on Day 18 of flower. It does not know whether that caused your yield to drop 0.4 lb/light. It doesn’t know whether your last run of the same strain ran cooler and outperformed. It has no idea what your canopy looked like, what your feed EC was, what your drying curve did afterward, or what your lab came back with. It just logged the 84F and moved on.

    The other thing sensor dashboards don’t do: they only see your environment. That’s one dimension of a cannabis grow. Environment matters a lot. It’s also not the only thing that matters. A sensor dashboard knows nothing about your harvest weight, your lab results, your strain history, your feed recipes, your drying outcomes, your team task completion, or what your canopy looked like on Day 21. It’s not designed to. That’s not a criticism. It’s a scope limitation you need to understand.

    Think of it like a fitness tracker that counts your steps. Useful data. But it doesn’t design your training program, and it doesn’t tell you why you’re not getting faster.


    What Cultivation Intelligence Actually Does

    Cultivation intelligence starts where a sensor dashboard stops. Instead of one data source feeding one display, it ingests data from every part of your operation and synthesizes it into specific, actionable guidance.

    The key distinctions aren’t subtle.

    Breadth of data. Cultivation intelligence doesn’t just look at your environment. It looks at everything that affects your outcome. Canopy photos, harvest weights, trim ratios, water activity readings, THC percentages, drying timelines, feed records, task completion, grower notes, strain history. It sees the full picture because it ingests the full picture. That’s a fundamentally different analytical foundation than a sensor chart.

    Retrospective analysis. After a run finishes, a sensor dashboard has nothing to say. It archives your data and waits for the next run. Cultivation intelligence, by contrast, does its most important work after harvest. It looks at everything that happened across the full batch cycle and tells you what worked, what didn’t, and what specific changes would have added pounds. Not charts. Written analysis with lb/light estimates and priority-ranked improvements. That’s the difference between looking at a graph and getting a diagnosis.

    Memory across batches. This one is underrated. Cultivation intelligence compares this run to your last run of the same strain, and the one before that. It remembers what made your best batch great and tells you when you’re drifting from it. A sensor dashboard has no concept of “your best batch.” It has no memory across runs. Every harvest is just another set of numbers with no context.

    Phase awareness. Week 1 of flower and Week 7 of flower are completely different growing environments with completely different priorities. Cultivation intelligence knows what phase you’re in and adjusts its guidance accordingly. The analysis you need when you’re dialing in stretch is not the same analysis you need when you’re watching trichome development. A sensor dashboard sends you an alert when your CO2 crosses 1600ppm regardless of whether it’s Day 5 or Day 60.

    The doctor analogy is the right one here. A doctor doesn’t just take your temperature. They look at your bloodwork, your history, your symptoms, your medications, and your lifestyle before telling you what to change. A thermometer is useful. It’s not a diagnosis.

    You can read more about what AI batch analysis actually produces after a run completes, and why retrospective analysis is where most of the yield gains live.


    The Data Pipeline Gap (This Is the Real Divide)

    Here’s the structural difference between these two categories, stated plainly.

    A sensor dashboard has one input: sensor data. One pipeline. Environment in, charts out.

    Cultivation intelligence has 10 or more inputs feeding a single analytical engine:

    1. Environmental sensor data (temp, RH, CO2, VPD, light, soil moisture)
    2. Canopy photos analyzed by AI for health, stress, and deficiency
    3. Harvest metrics (dry weight, wet weight, lb/light, plant count)
    4. Lab results (THC, terpenes, water activity, microbials)
    5. Feed data (nutrients, EC, pH, runoff)
    6. Drying data (duration, weight loss, final moisture content)
    7. Strain history across every prior run of the same genetics
    8. Grower notes and journal entries
    9. Task completion records
    10. Schedule and phase context (what day of flower, what activities are due)

    The synthesis is the product. Any one of these data sources alone is useful. All of them together, analyzed by AI that understands cannabis cultivation, produces insights no human could reasonably assemble manually in the time between runs.

    The structural gap: a sensor dashboard has 1 data source. Cultivation intelligence synthesizes 10+ into specific, action
    The structural gap: a sensor dashboard has 1 data source. Cultivation intelligence synthesizes 10+ into specific, actionable guidance.

    A grower could theoretically do this themselves. Pull the sensor data, look at the canopy photos, compare to last run’s spreadsheet, check lab results, review notes, estimate what the differences cost you in pounds. Some very disciplined growers actually do a version of this. It takes hours. It happens once per run if they’re disciplined. Usually it doesn’t happen at all because harvest week is not when you have time to sit down and do data analysis.

    Cultivation intelligence does it automatically after every batch. Same rigor, zero hours of manual work, consistent memory across every run you’ve ever logged.

    Feature comparison: what a sensor dashboard can see vs. what cultivation intelligence ingests and analyzes.
    Feature comparison: what a sensor dashboard can see vs. what cultivation intelligence ingests and analyzes.

    Understanding how that analysis directly affects your bottom line is worth reading more about: how AI batch analysis lowers cost per pound gets into the specifics of where those gains actually come from.


    Where Sensor Dashboards Still Matter

    To be clear: don’t trash your sensors. Sensors are essential. Environmental data is a critical input to everything cultivation intelligence does. You can’t do retrospective analysis on your VPD curve if you weren’t logging VPD in the first place.

    Think of it this way. Sensors are the ears. Cultivation intelligence is the brain. You need both.

    Where sensors shine is real-time equipment monitoring. If your chiller goes down at 3am, you want a text message, not an insight delivered at the end of your next harvest. Mission-critical alerts belong close to the hardware, on systems designed for that purpose. Cultivation intelligence is not trying to replace your environmental alerting infrastructure.

    Good cannabis grow room environment control starts with knowing what’s happening in real time. Sensor systems do that job well. The question is what you do with that data afterward, and whether it ever connects to the rest of what you know about your facility.

    The point isn’t that sensor dashboards are bad. The point is that they’re incomplete. Watching your environment in real time is step one. Understanding what all your data means across batches, strains, and seasons is step two. Most cannabis growers are stuck on step one and think they’re done because the charts look good.


    The Question to Ask Yourself

    Think about your last harvest. What did you actually do with the data afterward?

    Did you look at the environmental data, the yield numbers, the lab results, the canopy photos, the feed records, and the drying data all together? Did you compare that picture to the previous run of the same strain? Did you identify what changed, quantify the impact, and write down specific things to do differently next cycle?

    If you did: you’re doing cultivation intelligence manually. Software just does it faster, more consistently, and with better memory than a whiteboard or a spreadsheet you’ll lose in six months.

    If you didn’t: you left pounds on the table last cycle. Not because your sensors are bad. Because data without analysis is just noise. Your dashboard logged everything faithfully. Without the retrospective synthesis, none of it made your next run better.

    The growers consistently pulling the best numbers out of the same square footage aren’t doing it because they have fancier sensors than everyone else. They’re doing it because they’re actually learning from every run. That’s the whole game. Batch over batch improvement doesn’t happen by accident.

    For a deeper look at the mechanics of that improvement cycle, the article on what cultivation intelligence actually is covers the category in full, including what makes it different from standard grow management software.


    Putting It Together

    If you’re evaluating tools for your cannabis cultivation operation, here’s a clean way to sort them out.

    Sensor dashboards answer: “What is happening right now?” That’s a monitoring question. The tools designed for it do it well. Real-time visibility, threshold alerts, historical charts.

    Cultivation intelligence answers: “What should I do differently, and what will it cost me if I don’t?” That’s an improvement question. It requires more data sources, AI-driven synthesis, and retrospective analysis across full batch cycles. It’s a different category of tool solving a different problem.

    Most cannabis facilities need both, doing their respective jobs. The mistake is assuming that because you have good sensor coverage, you have cultivation intelligence. You don’t. You have the inputs. The analysis is still missing.

    Your yields aren’t held back by a lack of data. They’re held back by a lack of insight from the data you already have. That’s the gap cultivation intelligence closes.


    Growgoyle doesn’t replace your sensors. It makes sense of everything your sensors, your eyes, your scale, and your lab reports are telling you. Upload a few canopy photos and see what the AI catches in 60 seconds. Try it free on your own plants.

    About the Author

    Eric is a 15-year software engineer who operates a commercial cannabis cultivation facility in Michigan. He built Growgoyle to solve the problems he faces every day: inconsistent yields, forgotten lessons from past runs, and the constant pressure to lower cost per pound. Every feature in Growgoyle comes from real growing experience, not a product roadmap.

  • Why Yield Per Square Foot Is a Vanity Metric (Cost Per Pound Is What Matters)

    Why Yield Per Square Foot Is a Vanity Metric (Cost Per Pound Is What Matters)

    Why Yield Per Square Foot Is a Vanity Metric (Cost Per Pound Is What Matters)

    You’ve seen it happen in every Facebook group, every trade show conversation, every post-harvest text chain. Someone drops their yield number and the room shifts. “We’re pulling 4.8 lb per light.” The implied message: we’ve figured it out. Nobody ever asks the question that actually matters: what did that pound cost you to produce?

    I run a commercial cannabis cultivation facility. I also have 15 years as a software engineer, which means I think about operations the way a business analyst would, not just a grower. I’ve watched facilities flex numbers that would get them laughed out of any serious business conversation. Yield per square foot. Grams per watt. Total harvest weight. These numbers are everywhere, they’re easy to photograph, and in isolation, they mean almost nothing.

    Here’s the uncomfortable truth: you can be pulling 4.5 lb per light and still be losing money. And your competitor running 3.5 lb per light might be three times more profitable than you. The metric that actually determines whether your cannabis facility survives is cost per pound, and most operators aren’t tracking it.

    The Metrics Growers Actually Flex On

    Walk through the metrics growers love to post about:

    • Yield per square foot (grams or pounds)
    • Pounds per light
    • Grams per watt
    • Total harvest weight

    Every single one of these measures output. None of them measure efficiency. And here’s the part that doesn’t get talked about: every one of them can be gamed without actually improving your business.

    Want better grams per watt? Run hotter lights and stress your plants into producing more. You’ll also burn more energy, increase your HVAC load, and potentially sacrifice quality. Want more yield per square foot? Pack more plants in tighter. Your labor goes up, your airflow goes down, your canopy management gets harder. Want to post a big total harvest number? Run a longer flower cycle. Now your room turns over fewer times per year and your annual revenue drops.

    Gaming yield metrics doesn’t lower your cost per pound. It often raises it. The optimization is happening on the wrong variable.

    What Cost Per Pound Actually Tells You

    Cost per pound forces you to be honest. You can’t cherry-pick it. It requires you to account for everything it took to produce that harvest: nutrients, energy, labor, rent or mortgage, equipment depreciation, packaging, testing, waste. All of it, divided by the pounds you actually sold.

    When you calculate cost per pound, the score reflects reality. And reality, right now in Michigan, is a wholesale market estimated around $500 per pound.

    Here’s a hypothetical comparison that illustrates why yield numbers alone don’t tell you enough. These are illustrative figures, not real facilities, but the math is the point:

    Facility A Facility B
    Yield per light 4.5 lb 3.5 lb
    Number of lights 24 24
    Total harvest 108 lb 84 lb
    Monthly overhead $45,000 $28,000
    Cost per pound $417 $333
    Margin at est. ~$500/lb wholesale $83/lb $167/lb
    Total run profit ~$9,000 ~$14,000

    Facility B loses on every yield metric. Lower yield per light. Lower total harvest. Facility A would win every Instagram brag-off. Facility B is more than twice as profitable per run.

    Same lights, same room count. Facility A wins every yield brag. Facility B makes 56% more profit per run.
    Same lights, same room count. Facility A wins every yield brag. Facility B makes 56% more profit per run.

    If you want to go deeper on how to actually define and understand this number, this breakdown of what cost per pound means in cannabis cultivation is worth reading before you set up your own tracking.

    Why the Industry Is Still Obsessed With Yield

    This isn’t a mystery. There are real reasons yield became the de facto scoreboard for cannabis growers, and most of them made sense at one point.

    It’s easy to calculate. Count your pounds, divide by your square footage. Done. No accounting required.

    It’s easy to compare. You can throw yield numbers across facilities, across states, across years. Cost per pound requires knowing someone’s overhead, and nobody shares that.

    It’s visible and photographable. A room full of dense, heavy colas is content. A spreadsheet showing you’ve tightened your cost structure is not.

    It’s a legacy of a different market. When cannabis was trading at $2,500 to $3,000 per pound, efficiency was optional. You could run a sloppy operation with mediocre yields and still make real money. Overhead didn’t matter much when your gross margin was that thick. Growers built their mental models around yield because yield was all that mattered when prices were that high.

    The market changed. The metrics haven’t caught up. That gap is where a lot of facilities are getting quietly destroyed right now.

    How to Actually Think About Yield

    None of this means yield doesn’t matter. It matters a lot. It’s one of the most powerful levers you have for lowering cost per pound. Here’s why: your fixed costs don’t change much from run to run. Rent, staff, equipment payments, those numbers are mostly constant. When you spread those fixed costs across more pounds, your cost per pound drops. That’s real math.

    But that relationship only holds under a few conditions.

    First: the marginal cost of producing those extra pounds can’t exceed what you’re getting for them. If you’re adding labor, nutrients, and energy to chase yield, you need to net out positive after the additional spend.

    Second: you have to hit it consistently. One exceptional run buried in three average runs doesn’t move your annual economics much. Inconsistent yields are one of the most expensive problems in commercial cannabis cultivation, and most operators underestimate how much variance is costing them.

    Third: quality can’t drop. If you’re chasing yield at the expense of trichome density, cure quality, or bag appeal, you might be moving yourself into a lower price tier. More pounds at a lower price per pound is not automatically a win.

    So the hierarchy looks like this:

    1. Cost per pound is the scoreboard. Everything else feeds into this number.
    2. Yield consistency is the multiplier. Reliable results compound over time in a way that one-off runs don’t.
    3. Yield per light is one input. Important, yes. The whole story, no.

    If you want a practical starting point for calculating your own number, here’s how to calculate cannabis cost per pound from your actual operating data.

    The metric hierarchy: cost per pound is the scoreboard, consistency is the multiplier, yield per light is one input.
    The metric hierarchy: cost per pound is the scoreboard, consistency is the multiplier, yield per light is one input.

    The Shift That’s Already Happening

    Michigan wholesale was around $800 per pound in 2024. By 2026 it’s estimated closer to $500. That’s not a blip. That’s a structural compression that reflects what happens when supply outpaces demand and licensing keeps expanding.

    Consider two growers running identical facilities with identical results.

    Grower A tracks yield per square foot. Their numbers are steady. They feel fine. They’re running good rooms.

    Grower B tracks cost per pound. They’re watching their margin shrink from $200 per pound to $75 per pound over 18 months. They know exactly where the pressure is coming from. They’re already running efficiency projects: tightening their trim labor, renegotiating their supply contracts, working on batch-over-batch consistency to get more out of the same infrastructure.

    Same facility. Same results. Completely different level of awareness. Completely different trajectory.

    The facilities that are going to survive consolidation won’t necessarily be the ones pulling the most pounds per light. They’ll be the ones who know what every pound actually costs to produce, and who are systematically working to bring that number down. Batch-over-batch improvement is how that happens at scale. Small, consistent gains compound into a real cost structure advantage.

    Start With Your Actual Numbers

    You don’t need perfect accounting software to start getting honest about cost per pound. Start simple. Add up your five biggest monthly costs (rent or mortgage, labor, energy, nutrients, equipment payments) and divide by the pounds you produced last month. That’s your floor. It’s probably higher than you think. Refine from there as you capture more of your actual spend.

    Once you know that number, yield metrics start to mean something. You can ask: if I improve yield consistency by 10% without adding cost, what does that do to my cost per pound? What if I reduce trim labor by reducing larf through better canopy management? Now you’re doing real analysis, not just comparing output numbers.

    Yield per square foot is a fine data point. It should sit in a dashboard alongside cost of goods, labor per pound, and consistency run-over-run. The moment it becomes your primary metric, you’ve optimized for the wrong thing.

    The cannabis market has no patience left for operations running on vibes and output numbers. The operators who make it through this compression will be the ones who started treating their grow like the business it is.

    Frequently Asked Questions

    Is yield per square foot a useful metric?

    Yes, but only in the context of cost per pound. High yield with high costs can be less profitable than moderate yield with lean operations. Use yield per light as one input, not the final verdict on how your cannabis facility is performing.

    What is a good cost per pound for cannabis?

    It depends on your state, facility type, and current wholesale price. In Michigan’s 2026 wholesale market estimated around $500 per pound, you need to be producing under $400 per pound to survive, and under $350 per pound to start building real margin. Operators above $420 per pound at current prices are in a difficult position regardless of what their yield numbers look like.

    How do I start tracking cost per pound?

    Start with your five biggest fixed costs: rent or mortgage, labor, energy, nutrients, and equipment depreciation. Add them up for the month, then divide by the pounds you produced. That’s your starting number. It won’t be perfect, but it will be more useful than any yield metric you’re currently tracking. Refine it over time as you capture more of your real spend.

    📊 Free Tool: Cannabis Cost Per Pound Calculator
    Know your number before you try to lower it. Our free cost per pound calculator has 27 expense categories, tax presets for major states, and what-if yield modeling. No signup required.

    Growgoyle.ai helps you attack cost per pound through better yields, tighter consistency, and a clear picture of what’s working in every run. Upload a few canopy photos and see what the AI catches in 60 seconds. No signup required. Try it on your own plants.

    About the Author

    Eric is a 15-year software engineer who operates a commercial cannabis cultivation facility in Michigan. He built Growgoyle to solve the problems he faces every day: inconsistent yields, forgotten lessons from past runs, and the constant pressure to lower cost per pound. Every feature in Growgoyle comes from real growing experience, not a product roadmap.

  • How to Track Cannabis Batch Performance (Without Drowning in Spreadsheets)

    How to Track Cannabis Batch Performance (Without Drowning in Spreadsheets)

    How to Track Cannabis Batch Performance (Without Drowning in Spreadsheets)

    Every commercial cannabis grower I’ve ever met tracks something. Maybe it’s a spreadsheet with strain names and dry weights. Maybe it’s a whiteboard in the dry room with harvest dates scrawled in marker. Maybe it’s just your head, which works great until you’re running 12 rooms and can’t remember what you fed the Runtz in Room 4 six weeks ago.

    The problem isn’t that cannabis growers don’t collect data. Most of us collect too much of it. The problem is that almost nobody does anything useful with what they’ve got. You end up with a graveyard of spreadsheets, each one a little different from the last, none of them actually telling you why Run 17 pulled 3.2 lbs per light and Run 18 barely hit 2.6.

    That gap between tracking and actually understanding what happened is where most of us lose money. And it’s a bigger gap than most people think.

    The Universal Cannabis Grower Spreadsheet

    You know the one. It started as a simple grid. Strain, room number, flip date, harvest date, dry weight. Maybe you added a column for notes. Then feed EC. Then average temps. Then someone on your team started a separate sheet for the dry room. Now you’ve got four tabs, two of them are outdated, and the formulas broke three months ago when somebody accidentally deleted a row.

    I ran my operation on spreadsheets for years. I’m not knocking them. They’re free, they’re flexible, and they work when you’re running two or three rooms. But here’s what happens as you scale: the spreadsheet becomes a chore nobody wants to do. Your growers start skipping entries. Data gets entered inconsistently. One person logs wet weight, another logs dry weight, and a third logs both but in the wrong columns. By the time you sit down to actually look at it, you spend more time cleaning data than reading it.

    And that’s assuming you sit down to look at it at all. Most of us don’t. We harvest, we weigh, we write down the number, and we move on to the next run because there are always fifteen things that need attention right now.

    What You Should Actually Track Per Cannabis Batch

    Before we talk about tools, let’s talk about what actually matters. If you’re going to track cannabis batch performance in any serious way, here’s the minimum dataset that gives you something to work with:

    • Dry weight (total and per light). Lbs per light is the single most useful yield metric for comparing across rooms and runs. Total weight matters for revenue, but per-light tells you about performance.
    • Strain and phenotype. Obvious, but you’d be surprised how many operations don’t track pheno cuts consistently.
    • Cycle duration. Veg days, flower days, dry days. Longer cycles cost more. If you added three days to flower and didn’t see a corresponding bump in weight or quality, that’s money lost.
    • Environmental data. Average and range for temp, humidity, and VPD across each phase. Not just what you set the controller to. What the room actually held.
    • Feed data. EC, pH, irrigation frequency, dryback targets. At minimum, log your peak flower EC and your typical dryback percentage.
    • Trim ratio. What percentage of your dry weight is actually sellable flower vs. trim and larf? A 3.0 lb/light number looks a lot less impressive when 30% of it is B-grade.
    • Water activity at packaging. If you’re not measuring this, start. It tells you more about your dry and cure than any other single number.

    That’s a decent baseline. The question is what you do with all of it once you have it.

    Why Most Cannabis Growers Track but Never Analyze

    This is the part nobody talks about. Cannabis grow tracking is easy. You write down numbers. Analysis is hard. It requires you to look across multiple runs, control for variables, identify patterns, and draw conclusions that you can actually act on next time.

    Most growers don’t analyze their data for three reasons:

    1. There’s no time. You’re managing a facility. You’ve got plants in every stage. Something is always going wrong. Sitting down for two hours to compare Run 14 against Run 17 across environmental, feed, and yield data is a luxury most operators don’t have.

    2. The data isn’t structured for comparison. Your spreadsheet tracks runs sequentially, not comparatively. To actually compare two runs of the same strain, you have to manually pull data from different rows, different tabs, sometimes different files. It’s tedious enough that you do it once and then never again.

    3. There’s no framework for what “good” looks like. You know your best run pulled 3.4 lbs per light. But do you know specifically what made that run better? Was it the environment? The feed? The dry? The fact that it was summer and your lights-off temps were higher? Without a structured way to break down performance, you’re just guessing.

    This is where most cannabis operations plateau. They have good growers, decent data, and no systematic way to turn one into better versions of the other.

    Tracking vs. Intelligence: The Gap That Costs You Money

    There’s a real difference between tracking and intelligence, and it matters for your bottom line.

    Tracking tells you what happened. Room 6 yielded 2.8 lbs per light. Dry took 11 days. Peak EC was 4.2.

    Intelligence tells you what to do about it. Your dryback was too aggressive in weeks 5 and 6, which likely limited final bulking. Your dry room humidity was 8% higher than your best runs of this strain, which extended dry time and cost you terpene retention. If you tighten those two variables next run, you’re looking at a realistic improvement of 0.3 to 0.4 lbs per light.

    See the difference? One is a record. The other is a plan. And the plan is where the money is.

    Cannabis yield tracking software has gotten better over the years, but most platforms still just give you a better-looking version of the spreadsheet. Nicer charts, cleaner data entry, maybe some dashboards. That’s fine, but it doesn’t solve the core problem. You still have to be the one who looks at the data, interprets it, and figures out what to change. And if you had time for that, you’d already be doing it.

    How AI Batch Analysis Changes the Equation

    This is why we built batch analysis into Growgoyle. After every run completes, you get a full AI-powered breakdown of what happened and why it matters. Not just the numbers, but interpretation. What worked. What didn’t. What specific changes would improve your next run, and by how much.

    Every batch gets a Goyle Score from 0 to 100, broken down across five categories: Yield, Quality, Environment, Drying, and Efficiency. You’re scored against your own historical performance, not some generic industry benchmark. Because your facility, your strains, and your operation are unique. What matters is whether you’re getting better run over run.

    The AI doesn’t just flag problems. It gives you priority actions and specific targets. Instead of “your environment was inconsistent,” you get something like “VPD averaged 1.6 kPa in weeks 4 through 6 but your best Wedding Cake runs held 1.3 to 1.4 during that window. Tightening VPD in mid-flower is your highest-impact improvement for next run.” That’s the kind of analysis a really experienced cultivation director would do if they had unlimited time and perfect memory. Most of us have neither.

    It also catches things you might not think to look at. Maybe your cycle duration crept up by two days over the last three runs. Maybe your trim ratio has been slowly getting worse, suggesting a canopy management issue. These are patterns that hide in spreadsheets. They don’t hide from AI that’s looking at every variable across every run.

    Batch Comparison: Finding What Made Your Best Runs Great

    The other piece that changes how you think about cannabis batch tracking is side-by-side comparison. In Growgoyle, you can pull up any two runs and compare them directly. Same strain in different rooms. Same room in different seasons. Your best run against your worst run of the same cut.

    This is where patterns jump out. You might discover that every time you push EC above 4.5 in week 6 with a particular strain, your quality scores drop even though yield stays flat. Or that your fastest-drying runs consistently produce better terpene profiles, which means your dry room is actually too slow, not too fast.

    These aren’t things you’d find staring at a spreadsheet. They’re the kind of insights that come from structured comparison across a real dataset. And they compound. One small finding per run, applied consistently, adds up to meaningful improvement in yield and quality over a full year of production.

    For commercial cannabis operations, that’s real money. If you’re running 200 lights and you improve by even 0.2 lbs per light, that’s 40 extra pounds per cycle. At current wholesale prices, that’s tens of thousands of dollars from a single incremental improvement. Multiply that by the three or four improvements an AI analysis surfaces after each run, and the math gets very compelling.

    The Real Goal: Lower Cost Per Pound

    At the end of the day, everything comes back to cost per pound. That’s the number that determines whether your cannabis operation thrives or just survives. And cost per pound improves when you get better yields from the same inputs, tighter consistency across runs, and fewer wasted cycles where something went sideways and you didn’t catch it until harvest.

    Tracking data is the first step. You can’t improve what you don’t measure. But tracking alone doesn’t improve anything. Analysis does. And for most commercial cannabis operations, the choice is between hiring a full-time data analyst (good luck finding one who also understands cultivation) or using AI that was built specifically to do this job.

    The spreadsheet served us well. It got us from “winging it” to “at least we’re writing things down.” But the industry has moved past the point where that’s enough. Margins are tighter. Competition is real. The growers who are going to make it through the next few years are the ones who are actually learning from every single run, not just recording it.

    You don’t need more data. You need your data to actually tell you something.


    Growgoyle.ai turns your batch data into real improvement plans. AI-powered batch analysis after every run, side-by-side batch comparison, Goyle Scores across yield, quality, environment, drying, and efficiency. Built by a grower who got tired of spreadsheets that didn’t talk back. See what the AI sees in your canopy photos – no signup required.

    About the Author

    Eric is a 15-year software engineer who operates a commercial cannabis cultivation facility in Michigan. He built Growgoyle to solve the problems he faces every day: inconsistent yields, forgotten lessons from past runs, and the constant pressure to lower cost per pound. Every feature in Growgoyle comes from real growing experience, not a product roadmap.

  • What is the Goyle Score? A Single Number for Your Batch Performance

    What is the Goyle Score? A Single Number for Your Batch Performance

    What is the Goyle Score? A Single Number for Your Batch Performance

    You just finished a run. Chop day went smooth, the dry room is loaded, and now you’re standing there with that familiar question: how’d we actually do?

    Most cannabis growers answer that with one number. Yield. Maybe two if you count the vibe check on quality. And look, yield matters. Nobody’s arguing that. But evaluating a batch on yield alone is like judging a restaurant by portion size. You’re missing most of the picture.

    That’s why we built the Goyle Score™. It’s a single number, 0 to 100, that captures how well your batch actually performed across five weighted dimensions. Think of it like a credit score for your grow. One number that tells you where you stand, and more importantly, whether you’re getting better.

    Why One Number Changes Everything

    Here’s a scenario every commercial grower has lived through. You pull 4.1 lb/light on a strain that usually gives you 3.8. Great run, right? Except your environment was all over the place. Humidity swung 15% daily, your night temps dropped too low twice, and you ended up running flower three days longer than planned to compensate. You hit the number, but you got lucky. And luck isn’t a scalable strategy.

    Now flip it. Another run comes in at 3.6 lb/light. Disappointing on paper. But your environment was dialed, your dry was textbook, and your trim ratio was the best you’ve posted all year. That batch wasn’t a failure. It was a batch with one problem, probably genetic expression on that particular round, running in an otherwise well-operated facility.

    Without a way to score the full picture, both of those runs get filed under “good” and “bad” based on yield alone. The Goyle Score separates the signal from the noise. It tells you whether your operation is genuinely improving or whether you’re just riding variance.

    The Five Dimensions

    The Goyle Score isn’t a black box. It’s built on five specific dimensions, each weighted by how much it actually matters to commercial performance.

    Yield – 30%

    This is the headliner, and it carries the most weight for a reason. Lb per light (or lb per plant, depending on your setup) is still the number that moves the needle hardest on your cost per pound. But here’s the key: we’re measuring your yield against YOUR history with that same strain. Not some guy on Instagram posting numbers from a totally different facility with different genetics and a different market. Your best Legendary Lime run hit 4.29 lb/light? That’s the bar. Your next run of Legendary Lime gets measured against that, and against your running average.

    Quality – 30%

    Yield without quality is just expensive biomass. Quality carries equal weight because it directly determines what you can charge and who will buy it. This dimension factors in your product ratings and lab results, including potency and terpene profiles. A batch that tests well and looks good on the shelf scores high here. A batch that hit weight but came in flat on terps or had visual issues takes a hit. Both dimensions at 30% means the score naturally rewards the runs where you nailed both.

    Environment – 20%

    This is where a lot of growers get a wake-up call. Environment scoring looks at how tight your daily temperature and humidity control was throughout the run. Not just your averages, but your swings. A room that held 78°F/55% RH with minimal variance scores well. A room that averaged the same numbers but swung wildly through the day-night cycle gets a lower score, even if the end result looked fine. Tight environment control isn’t glamorous, but it’s the difference between a repeatable operation and one that’s rolling dice every cycle.

    Drying – 10%

    The dry room is where good batches go to die. Everyone knows this, and yet it’s usually the least tracked part of the process. The drying dimension evaluates duration and outcomes. Did you hit a reasonable dry timeline? What was your dry-to-wet ratio? A rushed dry or an extended one both show up here. Ten percent might sound small, but if your drying is consistently dragging down your score, it’s pointing at a real problem that’s costing you money.

    Efficiency – 10%

    The last dimension looks at trim ratio and whether you hit your target flower duration. This is about operational discipline. If you planned a 63-day flower and you chopped at 63, that’s efficient. If you kept pushing to 70 because things weren’t quite ready, that extra week costs you in labor, electricity, and opportunity. Trim ratio matters because a batch that produces heavy but requires excessive trim labor eats into your margins. Efficiency is the dimension that rewards clean, well-planned execution.

    Scored Against Yourself. Nobody Else.

    This part is critical, so I want to be clear about it. The Goyle Score does not compare you to an industry average. There is no “industry average” that means anything useful. A 10,000 sq ft facility in Michigan running LEDs has nothing in common with a 50,000 sq ft operation in Oklahoma running HPS. Comparing their numbers is meaningless.

    Every Goyle Score compares you to YOU. Your facility. Your genetics. Your history. Your previous runs of the same strain in the same rooms. That’s the only comparison that tells you anything real about whether you’re improving.

    If you’re tracking a strain for the first time, the system establishes a baseline. It doesn’t make up a fake benchmark or pull numbers from somewhere else. Your first tracked run of a new strain is your starting point. From there, every subsequent run gets scored against that growing body of data. The more runs you track, the smarter and more useful the score becomes.

    Reading the Score

    So what do the numbers actually mean in practice?

    A Goyle Score of 82 means you ran a strong batch. Most dimensions performed well, and your overall execution was solid. That’s a good run by any measure.

    A score of 60 means there’s significant room to improve. Something dragged you down, maybe multiple things. The dimensional breakdown tells you exactly where. Was it yield? Environment? Drying? You don’t have to guess.

    A score of 95+ means that was an exceptional run. Everything came together. Your job now is to figure out exactly what you did differently (or the same) and repeat it. The batch analysis in Growgoyle breaks this down for you, but the score is the flag that says “pay attention to this one.”

    The real value isn’t any single score, though. It’s the trajectory. Your Goyle Score history shows you the trend line across runs. Are your scores climbing? That means your operation is systematically getting better. Staying flat? You’ve plateaued and need to change something. Dropping? Something’s slipping.

    Here’s a pattern I see a lot: flat scores with strong yield but weak environment. That’s a grower who’s hitting numbers despite sloppy conditions. It works until it doesn’t. One bad week of weather, one HVAC hiccup, and that house of cards falls. A rising score across all five dimensions means you’re building something reliable. That’s the goal.

    Share It Without Giving Away the Farm

    One thing we built into the Goyle Score that growers actually use more than I expected: shareable score cards. After a run, you get a visual scorecard showing your overall Goyle Score and the dimensional breakdown. You can share it as a link or download it as an image.

    Why does this matter? Because growers talk to each other. In group chats, at trade shows, in Slack channels. And the Goyle Score lets you share your batch performance in a way that’s meaningful without revealing proprietary data. You’re not posting your actual yields or your environmental setpoints. You’re sharing a score that says “I ran an 87 on this strain” and other growers immediately understand what that means.

    Some facility managers use it internally too, sharing score cards with their team after every run. It gives the whole crew a clear, objective measure of how they’re doing. No ambiguity, no subjective judgment calls. Just a number and a breakdown.

    Making Batch Performance Concrete

    Before the Goyle Score, batch evaluation was a conversation. “That was a pretty good run.” “Yield was decent but the dry was rough.” “I think we’re getting better.” All subjective, all hard to track, all impossible to act on systematically.

    The Goyle Score makes it concrete. A run is an 74. That’s lower than your last three, which averaged 81. The dimensional breakdown shows environment dropped 12 points because your dehumidifier went down for two days in week five. Now you know exactly what happened, exactly how much it cost you in terms of batch performance, and exactly what to fix.

    That’s the difference between managing by feel and managing by data. Feel works when you’ve got one room and you’re in it every day. It stops working at scale. At two rooms, five rooms, ten rooms, you need something objective. The Goyle Score gives you that.

    And because every grower is scored against their own history, there’s no gaming it. You can’t look good by picking easy strains or running conservative environments. The only way your score goes up is if you actually get better at growing the strains you’re already running, in the facility you already have. That’s the whole point.

    Frequently Asked Questions

    What is a Goyle Score?

    The Goyle Score is a 0-100 performance metric for cannabis batches, created by Growgoyle. It evaluates each harvest across five weighted dimensions: Yield (30%), Quality (30%), Environment (20%), Drying (10%), and Efficiency (10%). Unlike industry benchmarks, the Goyle Score compares each batch against the grower’s own history, making it a personalized measure of whether you are getting better or worse over time.

    How is the Goyle Score calculated?

    The Goyle Score combines five dimension scores: Yield measures lb/light or lb/plant against your prior runs of the same strain. Quality uses your product ratings and lab results. Environment measures how tight your temperature, humidity, and VPD ranges stayed. Drying evaluates duration and dry-to-wet ratios. Efficiency looks at trim ratio and flowering duration adherence. Each dimension is scored 0-100 and weighted to produce the final composite score.

    What is a good Goyle Score?

    Because the Goyle Score measures performance against your own history, a good score depends on your baseline. A score above 80 generally indicates a strong batch that improved on prior runs across most dimensions. A score above 90 indicates exceptional performance. The real value is watching the trend – consistently rising scores mean your operation is systematically improving.


    Growgoyle.ai scores every completed batch with the Goyle Score™, giving you a clear, objective measure of your performance across yield, quality, environment, drying, and efficiency. No guessing, no industry averages that don’t apply to you. Just your data, your history, your improvement. See what the AI sees in your canopy photos – no signup required.

    About the Author

    Eric is a 15-year software engineer who operates a commercial cannabis cultivation facility in Michigan. He built Growgoyle to solve the problems he faces every day: inconsistent yields, forgotten lessons from past runs, and the constant pressure to lower cost per pound. Every feature in Growgoyle comes from real growing experience, not a product roadmap.

  • What is Batch Comparison? How Growers Repeat Their Best Runs

    What is Batch Comparison? How Growers Repeat Their Best Runs

    What is Batch Comparison? How cannabis growers Repeat Their Best Runs

    You remember your best run. Every grower does. The one where the canopy was dialed, the buds stacked hard, the dry was perfect, and yield per light hit a number you still brag about. Maybe it was eight months ago. Maybe two years. You know the strain. You might even remember what room it was in.

    But can you repeat it?

    That’s the question that separates good operations from great ones. And for most commercial cultivators, the honest answer is: not reliably. You can get close. You can try to recreate the conditions you remember. But cultivation involves hundreds of variables over 8 to 12 weeks, and memory is a terrible database.

    Batch comparison solves this. It’s the process of pulling up two cultivation runs of the same strain, placing them side by side, and using AI to analyze the meaningful differences between them. Not just what was different, but what those differences meant for yield and quality outcomes.

    The Problem: You Remember the Highlights, Not the Details

    Think about that best run for a second. You probably remember the big things. Maybe you had just installed new lights. Maybe you switched nutrient lines. Maybe the strain was fresh and vigorous. Those are the headline memories.

    Now think about the small things. What was your average night temperature during week 3 of flower? What was your feed EC on the dryback cycles in late flower? Did you adjust your VPD targets between weeks 5 and 6? When exactly did you flip, and was the canopy height the same as your most recent run?

    You don’t remember. Nobody does. And even if you kept notes, they’re incomplete. Grow logs capture the things you thought to write down, not the things you didn’t realize mattered. Your best run might have been great because of something you never even noticed: slightly lower humidity at night, a dryback pattern that happened to land perfectly, or a harvest window you hit three days earlier than usual.

    This is the core problem batch comparison addresses. Cultivation success lives in the details, and details fade. Fast.

    How Batch Comparison Actually Works

    The concept is simple. The execution requires data and intelligence.

    You select two completed batches of the same strain. Your best run from last spring and your most recent run, for example. The AI pulls both runs and analyzes them across every tracked dimension: daily environment data, feed and runoff numbers, timing decisions, yield metrics, quality scores, and drying conditions.

    Then it highlights where the two runs diverged, and what those differences likely meant for the outcome.

    Say your best run pulled 0.3 lb per light more than your latest. The side by side batch analysis might show that night temps averaged 2 degrees lower on the winning run, VPD was held tighter through weeks 5 through 7, and you harvested 3 days earlier. The AI doesn’t just list those differences. It correlates them with the outcome gap and tells you which ones most likely drove the yield and quality difference.

    That’s the key distinction. A spreadsheet can show you two columns of numbers. Batch comparison tells you which numbers actually mattered.

    Why AI Changes the Equation

    If you’ve ever tried to compare cultivation runs manually, you know the pain. You pull up two sets of data, start scrolling through weeks of environment logs, and immediately get lost. Temperature was different on 47 out of 60 days. Humidity shifted constantly. Feed EC bounced around. Everything is different because no two runs are ever identical.

    The question isn’t “what was different?” The question is “what was meaningfully different?”

    That’s where AI earns its keep. It filters signal from noise. Not every variable change correlates with a yield change. Your day temps might have been a degree higher throughout the entire run, but if yield and quality were comparable, that difference probably didn’t matter. What mattered was the VPD swing during the last two weeks of flower, or the fact that your drying room held 2 degrees cooler and 5% higher humidity on the better run.

    AI identifies these patterns across your data and prioritizes the differences most likely to have driven the outcome gap. It’s consultative, not prescriptive. It tells you “here’s what correlated with your better result” and lets you make the call on what to change. Because you know your facility, your team, and your constraints better than any algorithm.

    Batch Comparison and Batch Analysis: The Improvement Cycle

    Here’s where it gets powerful. Batch comparison doesn’t exist in isolation. It works alongside AI batch analysis to create a continuous improvement cycle.

    AI batch analysis runs after every completed batch. It breaks down what happened: what worked, what to improve, specific estimates for how much yield you could gain by tightening certain variables. It gives you a Goyle Score from 0 to 100 across Yield, Quality, Environment, Drying, and Efficiency. You’re scored against yourself, against your own history and potential. Not some industry benchmark that doesn’t account for your facility, your genetics, or your market.

    Batch analysis tells you what to improve. Batch comparison tells you what to repeat.

    Together, they create a loop. Run a batch. Get the analysis. Compare it to your best run of that strain. See exactly where you gained ground and where you left performance on the table. Apply those insights to the next run. Analyze again. Compare again.

    Each cycle gets tighter. The gap between your average run and your best run shrinks. That’s how “every batch, better than the last” stops being a slogan and starts being a process. And in a market where cost per pound determines who survives, that process is everything.

    Who Gets the Most Out of Batch Comparison

    Batch comparison is built for commercial cultivators running the same strains across multiple cycles. If you’re running 20 different strains and only growing each one once, you won’t have much to compare. But if you’re like most commercial operations, running a rotation of proven genetics through the same rooms cycle after cycle, this is where the value compounds.

    You need at least two completed batches of the same strain to run a comparison. That’s the minimum. But the more runs you have tracked, the more powerful it becomes. With five or six runs of the same strain, you can start identifying which variables consistently correlate with your best outcomes. Not just “this one time, lower night temps helped” but “across four runs, tighter VPD in late flower was present every time you hit above 2.5 per light.”

    That’s pattern recognition across your own data. And it gets sharper with every run you track.

    The growers who get the most from this are the ones already doing well but know they’re leaving performance on the table. You’re pulling solid numbers. You’re running a real operation. But you know that your best run was meaningfully better than your average, and you can’t pinpoint why. Batch comparison gives you the answer.

    What Batch Comparison Won’t Do

    Worth being straight about the boundaries. Batch comparison analyzes your data and highlights what drove different outcomes. It does not control your equipment. It won’t adjust your HVAC or change your irrigation schedule. It’s intelligence, not automation.

    It also doesn’t replace your judgment. The AI surfaces correlations and likely drivers. You decide what’s actionable given your setup, your team, and your operational reality. Maybe the comparison shows that your best run had a slower dryback in week 6, but you know that was an accident caused by a pump issue. Context matters, and you’re the one who has it.

    Think of it as having a very sharp, very detail-oriented consultant who’s reviewed every data point from both runs and is giving you the briefing. You still make the calls.

    The Real Cost of Not Comparing

    Here’s what keeps me up at night as a grower. Every run you complete without comparing it to your best is a missed opportunity to close the gap. If your best run of a strain pulled 2.8 per light and your average is 2.4, that 0.4 lb difference multiplied across your flower rooms, multiplied across your annual cycles, is a massive number. In a tight market, that delta is the difference between healthy margins and wondering if you can make payroll.

    Most growers are sitting on the data they need to improve. It’s in their environment logs, their feed charts, their harvest records. They just don’t have a way to make sense of it across runs. The data exists. The insight doesn’t. Until you put two runs next to each other and ask the right questions.

    That’s what batch comparison does. It turns your historical data into actionable intelligence. Not someday, not after a consultant visit, but after every single run.


    Frequently Asked Questions

    What is batch comparison in cannabis cultivation?

    Batch comparison is the practice of analyzing two or more completed cannabis grow cycles side by side to identify what made one run better than another. AI-powered batch comparison examines environment data, feeding schedules, yields, quality metrics, and growing conditions to pinpoint the specific variables that drove different outcomes – helping growers repeat their best runs consistently.

    Why is batch comparison important for commercial growers?

    Every commercial grower has had a standout run they could not replicate. Batch comparison solves this by showing exactly what was different between a great run and an average one. Instead of guessing why one harvest produced 4 lb/light and the next produced 3.2, growers can see the specific environment, feeding, or timing differences that drove the gap – and make informed decisions on the next run.

    How does AI batch comparison work?

    AI batch comparison pulls the complete dataset from two or more batches of the same strain and analyzes them across every dimension: environment ranges, feed schedules, irrigation timing, dryback percentages, VPD targets, flowering duration, dry room conditions, and final metrics. It then highlights the key differences that most likely drove the yield or quality gap, ranked by impact.

    Growgoyle.ai puts batch comparison in your hands. Pull up any two runs of the same strain, and let AI show you exactly what made your best run great. Batch comparison is available in Growgoyle Pro. Want to see AI-powered cannabis cultivation intelligence for yourself first? Try the free AI photo analysis and get a master grower assessment in 60 seconds. No credit card required.

    About the Author

    Eric is a 15-year software engineer who operates a commercial cannabis cultivation facility in Michigan. He built Growgoyle to solve the problems he faces every day: inconsistent yields, forgotten lessons from past runs, and the constant pressure to lower cost per pound. Every feature in Growgoyle comes from real growing experience, not a product roadmap.

  • What is Cultivation Intelligence? The New Category Beyond Dashboards and Compliance

    What is Cultivation Intelligence? The New Category Beyond Dashboards and Compliance

    What is cannabis cultivation intelligence? The New Category Beyond Dashboards and Compliance

    Let me describe a scenario that probably sounds familiar. You’ve got a sensor dashboard showing you real-time temperature, humidity, CO2, and VPD across every room. You’ve got a compliance platform keeping your inventory tracked and your regulators happy. Maybe you’ve even got automated HVAC and irrigation doing their thing. You’re swimming in data, covered on compliance, and your equipment runs itself.

    So why are your yields still inconsistent?

    Why did Room 3 pull 62 pounds last run but only 54 this time, same strain, same feed schedule? Why does your team keep making the same mistakes every few cycles? Why does it feel like you’re guessing at what actually drove your best runs?

    The answer is simple: you have tools that monitor, tools that track, and tools that control. What you don’t have is anything that thinks. That’s the gap cultivation intelligence fills.

    The Tools You Already Have (and What They Don’t Do)

    The commercial cannabis cultivation software landscape has grown a lot in the last few years, and most of it falls into a handful of categories. All of them serve a purpose. None of them solve the actual problem.

    Sensor dashboards show you data. Temperature is 78°F. Humidity is 58%. VPD is 1.2 kPa. Great. Now what? A dashboard tells you what IS. It does not tell you what it MEANS. It won’t flag that your humidity swings during week 3 of flower are costing you density, or that your overnight temperature delta is wider than it should be for the cultivar you’re running. It’s a speedometer, not a driving instructor.

    Compliance and seed-to-sale tools exist because regulators require them. METRC, track-and-trace, inventory management. These are a cost of doing business. They keep you legal and that’s critical, but they have nothing to say about whether your last batch was any good or how to make the next one better. Compliance data doesn’t optimize anything.

    Equipment automation controls your HVAC, your lights, your irrigation. Set your targets, let the system maintain them. This is infrastructure. It keeps your environment where you told it to be. But it doesn’t know if where you told it to be was actually correct for that strain in that phase of growth. Automation executes your plan. It doesn’t evaluate it.

    Grow diary apps let you log what you did. Fed at 2.4 EC on day 21. Flipped lights on March 5th. Harvested 58 pounds. These records are useful, but a diary just stores information. It doesn’t compare this run to your last five runs of the same strain. It doesn’t tell you that your best results came when you ran a more aggressive dryback strategy in late flower. It’s a filing cabinet, not an analyst.

    Every one of these tools does its job. But none of them answer the question that actually determines whether your operation survives: how do I get more consistent, higher-quality yields at a lower cost per pound?

    Cultivation Intelligence: The Missing Layer

    Cultivation intelligence is a new category of software that sits on top of everything else you’re already using. It doesn’t replace your sensors, your compliance system, or your automation. It takes the data those tools generate, combines it with your batch outcomes, your photos, your historical performance, and runs AI analysis to produce specific, actionable recommendations.

    Not “your humidity was 65%.” Instead: “Your humidity averaged 4 points above target during weeks 3-5 of flower, and based on your batch history, tightening that window could recover an estimated 6-10 pounds per room.”

    That’s the difference between monitoring and intelligence. Monitoring tells you what happened. Intelligence tells you what it means and what to do about it.

    Think of it this way. A sensor dashboard is like a blood pressure cuff. It gives you a number. Cultivation intelligence is like a doctor who looks at that number alongside your full medical history, your lab work, your lifestyle, and tells you exactly what to change and why.

    What Cultivation Intelligence Actually Does

    At its core, cultivation intelligence software analyzes batch outcomes against environment data, feed data, and historical performance. But the specifics matter, so here’s what that looks like in practice.

    Batch analysis after every run. When you close out a batch, you get a full breakdown. What worked, what didn’t, and specific estimates for how much yield you could recover by fixing the gaps. Not vague advice. Concrete targets for next run based on your own data.

    Batch comparison across your history. Compare any two runs side by side. Your best Gelato run vs. your worst. This room vs. that room. Last quarter vs. the same quarter last year. The system identifies the variables that actually drove the difference, so you can repeat your wins and stop repeating your losses.

    AI-powered photo assessment. Snap a photo of a plant from your phone and get a master-grower-level assessment in about 60 seconds. Not a generic “looks like a deficiency.” A differential diagnosis that considers multiple possible causes, gives you specific targets, priority actions, and watchouts. Because in commercial cultivation, a calcium issue and a pH lockout can look almost identical, and the wrong fix makes things worse.

    Trend detection across batches. This is where it gets really valuable. Your yields might be slipping by 2-3% per run. That’s almost invisible from batch to batch, but over 10 runs it’s a serious problem. Cultivation intelligence spots slow-moving trends like declining yields, rising trim ratios, seasonal patterns, and environmental drift before they become obvious. By the time you notice a problem with your eyes, it’s already cost you money.

    Performance scoring. A single rating that captures how a batch performed across multiple dimensions: yield, quality, environment management, drying, and efficiency. Not scored against some industry average, but scored against YOUR operation and YOUR history. That’s the only benchmark that matters.

    Why This Category Didn’t Exist Until Now

    You might wonder why nobody built this five years ago. The short answer: the technology wasn’t ready and the domain expertise didn’t exist in the right combination.

    Running complex AI analysis on multi-variable cultivation data required a few things to converge. First, modern AI models capable of understanding the relationships between dozens of environmental variables, plant health signals, and outcome data. Second, cloud computing affordable enough that a 50-light operation can use the same caliber of analysis that used to require enterprise-scale budgets. Third, and most importantly, someone who actually understood cultivation deeply enough to build the right analysis framework.

    That last point is critical. Generic AI tools don’t understand your world. They don’t know that an aggressive dryback is deliberate crop steering, not a mistake. They don’t know that CO2 naturally rises at lights-off in a sealed room. They don’t know that foxtailing requires root cause analysis before you start adjusting your light height. Cultivation intelligence has to be built by people who have actually grown at commercial scale, or the analysis is garbage.

    The Compounding Advantage

    Here’s something that separates cultivation intelligence from the other tools in your stack: it gets more valuable over time.

    Compliance data is static. You enter it once, file it, and it sits there. Your sensor dashboard shows you the same type of information whether it’s your first day or your thousandth. These tools don’t learn.

    Cultivation intelligence compounds. Every batch you close adds to your data set. Every analysis builds on the last. After 5 batches, the system has a baseline. After 20, it knows the patterns of your specific operation, your facility’s quirks, your team’s strengths and blind spots, the seasonal shifts in your environment. After 50, it has a depth of insight about your grow that no consultant who walks in for a day could match.

    This is why the cannabis cannabis growers who adopt cultivation intelligence early will have a structural advantage. Not because they have fancier software, but because their data is working for them while everyone else’s data is just sitting in dashboards and spreadsheets.

    In a market where margins keep tightening and cost per pound determines who survives, that compounding insight is the difference between an operation that improves every cycle and one that keeps repeating the same mistakes.

    Growgoyle: Built by a Grower, for Growers

    I built Growgoyle.ai because I needed it myself. I run a commercial facility in Michigan and I’ve been a software engineer for 15 years. I got tired of staring at dashboards that told me what happened but never told me why, and I got tired of closing out runs knowing there was signal buried in my data that I didn’t have the time or tools to extract.

    Growgoyle is the first cultivation intelligence platform built specifically for commercial cultivators. Here’s what it gives you:

    • AI Batch Analysis after every run. Full breakdown of what worked, what to improve, and specific pound estimates for improvements. Every batch gets a Goyle Score from 0 to 100 across five dimensions: Yield, Quality, Environment, Drying, and Efficiency.
    • AI Photo Analysis any time you need it. Upload a photo from your phone, get a master-grower-level assessment in 60 seconds with differential diagnosis, specific targets, and priority actions.
    • Batch Comparison across your entire history. Pull up any two runs, see exactly what made the difference.
    • Batch Tracking from clone to cure, so every data point feeds the intelligence layer.
    • Smart Scheduling with phase-aware schedules and team task assignments.
    • Sentinel Alerts for intelligent environmental monitoring that knows the difference between a normal fluctuation and an actual problem.

    Every grower on Growgoyle is scored against themselves. Not some industry average, not a theoretical benchmark. Your performance, your trajectory, your improvement over time. Because the only competition that matters is your last run.

    I use this on my own facility every single day. Every feature exists because I needed it on a real grow floor, not because it looked good on a feature list.

    The Bottom Line

    The cultivation industry has spent years investing in monitoring, compliance, and automation. Those are table stakes now. The next wave is intelligence: software that doesn’t just show you data or keep you legal, but actually analyzes your operation and tells you how to improve.

    If you’re running a commercial facility and you’re still relying on dashboards, spreadsheets, and gut feel to figure out how to get better, you’re leaving pounds on the table every single run. Cultivation intelligence is the layer that turns all the data you’re already collecting into decisions that compound over time.

    The growers who figure this out first will be the ones still standing when the market finishes shaking out.

    Frequently Asked Questions

    What is cultivation intelligence?

    Cultivation intelligence is a new category of agricultural technology that uses AI to analyze batch-level grow data, compare runs over time, and provide specific improvement recommendations. Unlike dashboards that display data or compliance tools that track regulatory requirements, cultivation intelligence actively learns from each harvest and helps growers systematically improve their yields, quality, and consistency.

    How is cultivation intelligence different from cultivation management software?

    Cultivation management software typically handles compliance (METRC tracking), inventory, and basic record keeping. Cultivation intelligence goes further by analyzing your grow data with AI, comparing batches against your own history, scoring performance, and telling you specifically what to change to get better results. Management software tracks what happened. Cultivation intelligence tells you why and what to do about it.

    What is the Goyle Score in cultivation intelligence?

    The Goyle Score is a 0-100 performance metric created by Growgoyle that scores each cannabis batch across five dimensions: Yield (30%), Quality (30%), Environment (20%), Drying (10%), and Efficiency (10%). Every grower is scored against their own history, not industry benchmarks, making it a personalized measure of improvement over time.


    Growgoyle.ai is the cultivation intelligence platform built for commercial cannabis growers. AI batch analysis, AI photo assessment, batch comparison, and the Goyle Score, all built by a grower who uses it on his own operation every day. See what the AI sees in your canopy photos – no signup required.

    About the Author

    Eric is a 15-year software engineer who operates a commercial cannabis cultivation facility in Michigan. He built Growgoyle to solve the problems he faces every day: inconsistent yields, forgotten lessons from past runs, and the constant pressure to lower cost per pound. Every feature in Growgoyle comes from real growing experience, not a product roadmap.

  • What is AI Plant Health Analysis? A Second Set of Eyes on Your Canopy

    What is AI Plant Health Analysis? A Second Set of Eyes on Your Canopy

    What is AI Plant Health Analysis? A Second Set of Eyes on Your Canopy

    Every grower has walked past a problem. Not because they’re bad at their job. Because they were looking for something else, or because their brain filtered it out, or because the symptom looked just enough like something normal that it didn’t register. It happens to all of us. Fifteen years in, it still happens to me.

    AI plant health analysis is, at its core, a second set of eyes that doesn’t carry your baggage. You take photos of your canopy with your phone, upload them, and within about 60 seconds you get back a detailed assessment. Not a vague “looks healthy” or a color-coded stoplight. Specific findings. Confidence levels. Priority actions. And when the symptoms could mean more than one thing, it tells you that too.

    That last part matters more than most people realize.

    How It Actually Works

    Let’s strip the mystery out of this. AI plant health analysis isn’t a filter you slap on a photo. It’s not image recognition scanning for a keyword match against a database of leaf pictures. It’s a trained model that reads visual indicators the same way you do when you walk a room, just without the blind spots.

    When you upload a photo, the AI analyzes what it sees: leaf color, texture, curl patterns, canopy uniformity, internode spacing, trichome development, and the subtle gradients between healthy tissue and stressed tissue. It cross-references those visual signals against known plant biology to identify potential issues, nutrient status, stress indicators, and overall health.

    Think of it less like a Google image search and more like a consultant looking over your shoulder. The output isn’t “this matches photo #4,327 in our database.” It’s “here’s what I’m seeing, here’s what it likely means, here’s what else it could mean, and here’s what you should do about it in order of priority.”

    That distinction is everything. One approach gives you a label. The other gives you a plan.

    What AI Plant Analysis Is and What It Isn’t

    Before we go further, let’s set some boundaries. Because there’s a lot of marketing noise around AI in cultivation right now, and most of it over-promises.

    AI plant health analysis IS:

    • A knowledgeable second opinion on what your plants are telling you
    • A way to catch things your eyes might miss on a walkthrough
    • A tool that challenges your assumptions instead of confirming them
    • A consistent assessor that doesn’t have good days and bad days

    AI plant health analysis IS NOT:

    • A magic pest identifier. You cannot see russet mites in a phone photo, and neither can AI. If someone tells you their tool identifies microscopic pests from a phone camera, they’re selling you something.
    • Equipment control. It doesn’t adjust your HVAC or change your irrigation schedule.
    • A sensor replacement. It’s analyzing photos, not pulling data from your environmental controllers.
    • A substitute for your own expertise. It’s a tool that makes your expertise sharper.

    What it does do is put structure around something most cannabis cannabis cannabis growers do intuitively but inconsistently: reading their canopy. You already know how to look at a plant and gauge health. The AI just does it without the shortcuts your brain takes when you’re busy, tired, or distracted by the 47 other things on your plate.

    The Differential Diagnosis Advantage

    This is where AI canopy analysis earns its keep, and it’s the feature most people don’t think about until they see it in action.

    When you spot a symptom in your room, your brain does something natural and dangerous: it anchors on the most likely cause. Yellowing lower leaves? Must be nitrogen. Curled tips? Probably heat stress. Stippling on the canopy? Spider mites.

    And maybe you’re right. But maybe you’re not. And in a commercial facility, “maybe” costs real money.

    AI plant health assessment doesn’t anchor. When symptoms could indicate multiple root causes, it flags all of them. Virus symptoms and mite damage look nearly identical to the naked eye, especially early. Certain nutrient deficiencies present the same way root zone issues do. Light stress and heat stress overlap in ways that fool experienced growers every week.

    A good consultant doesn’t just tell you what they think is wrong. They tell you what else it could be. “I’m seeing interveinal chlorosis that’s consistent with magnesium deficiency, but these symptoms are also consistent with early virus expression. Consider tissue sampling before adjusting your feed.” That’s the kind of output you get from proper AI plant analysis. Not a single answer, but a ranked list of possibilities with specific next steps for each.

    For commercial operations, this is the difference between catching a virus at week two and catching it at week five. One is a management decision. The other is a crop loss.

    Why Confirmation Bias is Your Canopy’s Worst Enemy

    Here’s a scenario every grower has lived. You walk into a room expecting to see healthy plants because you just dialed in your environment. And what do you see? Healthy plants. Even if three rows in the back are starting to show early signs of something. Your brain was primed to see “good,” so that’s what it found.

    Or the opposite. You had a rough run last cycle and you’re paranoid about pest pressure. Now every speck on a leaf looks like the start of an infestation. You treat preemptively, burn through IPM budget, stress your plants with unnecessary applications, and the “pest pressure” was actually just mineral deposits from your foliar spray.

    AI photo analysis doesn’t have expectations. It doesn’t remember your last bad run. It doesn’t care that you just spent $15,000 on a new dehumidifier and really want the room to look perfect. It sees what’s there. Period.

    That objectivity is worth more than any individual finding it produces. Over time, it trains you to see more clearly too, because you start catching the gap between what you assumed and what the photos actually showed.

    When to Use It (Hint: Not Just When Things Look Wrong)

    Most growers assume AI plant health analysis is something you reach for when you see a problem. Something looks off, you snap a photo, you get an answer. And sure, that works. But it’s also the least valuable way to use it.

    The real power is in routine documentation. When you’re uploading photos regularly, you build a baseline. The AI can flag changes that are invisible to you because they happened gradually over three or four days. A slight shift in canopy color. A change in leaf angle. Internode stretching that’s 10% more than last week. Individually, none of those set off alarms. Together, they tell a story.

    The best growers using AI canopy analysis treat it like a daily walkthrough partner. Five minutes of photos on their phone. Upload. Review the assessment while they drink their coffee. Most days, it confirms what they already know. But every couple of weeks, it catches something 5 to 10 days before it would have become visible enough to trigger concern. In a commercial operation, those 5 to 10 days are the difference between a minor correction and a serious yield hit.

    Think about it this way: you don’t check your VPD only when the room feels humid. You monitor it constantly because drift matters more than any single reading. AI plant analysis works the same way. Consistency of observation beats reactive spot-checking every time.

    What Good Output Looks Like

    If you’ve never used an AI plant health assessment tool, you might be wondering what you actually get back. Here’s the general structure of a solid analysis:

    • Specific observations: What the AI sees in the photo, stated plainly. “Upper canopy showing slight cupping with marginal necrosis on newest growth.”
    • Confidence levels: How certain the AI is about each finding. Not everything is a slam dunk, and honest tools tell you that.
    • Likely causes, ranked: The differential diagnosis. “Most consistent with calcium uptake issues, possibly driven by VPD swings during lights-off. Also consistent with early boron deficiency. Less likely but worth ruling out: root zone pH drift.”
    • Priority actions: What to do first, second, third. Not a laundry list of everything that could possibly help, but a sequenced plan that respects the reality that you have limited time and resources.
    • Watchouts: Things that aren’t problems yet but could become problems if conditions continue.

    That’s the standard you should hold any AI plant analysis tool to. If the output is vague, generic, or just tells you “your plant looks unhealthy,” it’s not doing real analysis. It’s doing pattern matching with a nice UI.

    Try It Yourself

    Upload a few canopy photos and see what the AI catches in 60 seconds. No signup, no email, no commitment.

    Try It Free

    Frequently Asked Questions

    What is AI plant health analysis?

    AI plant health analysis uses artificial intelligence to evaluate cannabis plant health from phone photos. You upload photos of your canopy and receive a detailed assessment including specific findings, confidence levels, differential diagnoses, and priority actions – similar to getting a second opinion from an experienced master grower.

    Can AI detect pests from plant photos?

    AI can detect visible symptoms that may indicate pest pressure – such as leaf damage patterns, discoloration, or structural changes. However, it cannot identify microscopic pests like russet mites or broad mites directly from photos. When symptoms overlap between different causes (like HLVD and mite damage), a good AI system will flag the differential diagnosis and recommend microscopic inspection or lab testing to confirm.

    How accurate is AI plant health analysis?

    AI plant health analysis provides confidence levels with each finding, typically ranging from 60-95% depending on symptom clarity. It is most accurate for visible deficiencies, environmental stress, and structural issues. It is less accurate for problems that require microscopic examination or lab testing to confirm. The best use is as a second set of eyes that catches things you might miss, not as a replacement for hands-on expertise.

    I’m a grower. I don’t trust things I haven’t tried, and I don’t expect you to either. That’s why Growgoyle offers free AI plant health analysis at growgoyle.ai/try. No signup. No credit card. No email required. Just upload a few photos and see what comes back.

    It takes about 60 seconds. You’ll get specific observations, differential diagnosis when symptoms overlap, and prioritized action items. Judge it against your own assessment of the same plants. See where it agrees with you, and more importantly, see where it catches something you didn’t.

    The best way to understand what AI plant analysis actually is? Stop reading about it and go see for yourself.


    Growgoyle.ai puts AI-powered plant health analysis in your pocket for every walkthrough. Upload photos from your phone, get a master grower assessment in 60 seconds, with differential diagnosis and prioritized actions. Built by a grower, for growers. See what the AI sees in your canopy photos – no signup required.

    About the Author

    Eric is a 15-year software engineer who operates a commercial cannabis cultivation facility in Michigan. He built Growgoyle to solve the problems he faces every day: inconsistent yields, forgotten lessons from past runs, and the constant pressure to lower cost per pound. Every feature in Growgoyle comes from real growing experience, not a product roadmap.

  • What is AI Batch Analysis? How It Helps Growers Improve Every Run

    What is AI Batch Analysis? How It Helps Growers Improve Every Run

    What is AI Batch Analysis? How It Helps Growers Improve Every Run

    Here’s something most commercial cannabis growers do after a run: weigh the harvest, look at the numbers, say “that was a good one” or “that was rough,” and move on to the next batch. Maybe you jot a couple notes. Maybe you talk it through with your head grower over coffee. But the real knowledge of what actually drove that result, good or bad, evaporates within a week.

    AI batch analysis changes that. It’s the process of using artificial intelligence to evaluate an entire cultivation run after harvest, pulling together your environment data, feed schedules, yield outcomes, quality metrics, and drying results into a structured breakdown of what worked, what didn’t, and exactly what to change next time. Not a chart. Not a PDF you file away and never read. A prioritized, actionable analysis with estimated yield impact in pounds.

    We built this concept into Growgoyle because, frankly, nobody else was doing it. And after running a commercial facility for years while watching data pile up in sensor logs and spreadsheets, I got tired of knowing the answers were in there somewhere but never having the time to find them.

    The Problem: Knowledge That Disappears After Every Run

    Think about what happens during a typical batch. Over 8 to 12 weeks, you’re generating thousands of data points. Temperature, humidity, VPD, CO2 levels, light intensity, feed EC and pH, runoff numbers, irrigation volumes. Then there’s the subjective stuff: how the canopy looked at week 4, when you noticed that slight calcium issue, the day your dehu went down for six hours.

    All of that context matters. It all contributes to your final yield, your quality, your trim ratio. But when the run ends, what do most operations actually capture? Dry weight. Maybe a few lab numbers. Maybe a note that says “room ran hot week 5.”

    That’s it. Months of growing boiled down to a weight and a vague memory.

    Now multiply that across 20, 30, 50 runs a year. You’re sitting on a mountain of experience and data, but none of it is connected. You can’t answer basic questions like: “What did we do differently in that great Run 47 compared to this mediocre Run 52?” Or: “Is our yield trending down over the last six months, and why?”

    This is the problem AI batch analysis solves. It takes all that scattered information, connects it, and finds the patterns you’d miss even if you had a week to sit down and study the data yourself.

    How AI Batch Analysis Actually Works

    In Growgoyle, here’s what happens. You close out a batch after it’s harvested and dried. The AI then pulls everything from that run and analyzes it as a whole picture: daily environment data (temperature, humidity, VPD, CO2), feed and runoff logs, yield per light, total dry weight, quality observations, lab results if you have them, drying room conditions, water activity readings.

    From all of that, it produces a structured analysis. Not a wall of text. Not a generic report. Three specific things you did well (repeat these next time), three specific things that held you back (with an estimated impact in pounds of dry weight), and clear recommendations for your next run.

    It also generates a Goyle Score, a single number from 0 to 100 that rates the overall performance of that batch. The score is weighted across five dimensions: Yield (30%), Quality (30%), Environment (20%), Drying (10%), and Efficiency (10%). That weighting exists because yield and quality are what pay the bills, but environment management and drying execution are what protect them.

    Here’s the part that matters most: every score is measured against YOUR history. Not some industry benchmark. Not what a facility in Colorado is pulling. Your best runs, your averages, your specific strains and rooms. Because a 78 Goyle Score means something very different for an operation averaging 65 versus one averaging 82.

    This Isn’t a Dashboard

    I want to be clear about what AI batch analysis is not, because the cultivation tech space is full of tools that show you data without telling you what to do with it.

    A dashboard shows you that your temperature spiked to 88°F on day 14 of flower. That’s useful information. But it doesn’t tell you that the spike, combined with your VPD running high for the three days prior and a feed EC that was already pushing the upper limit, likely stressed your plants enough to cost you 8 to 12 pounds of dry weight based on how similar conditions affected your previous runs.

    That’s the difference. Dashboards answer “what happened.” AI batch analysis answers “why it happened” and “what to do about it.” One gives you data. The other gives you direction.

    AI batch analysis is also not equipment control. It doesn’t adjust your HVAC or change your irrigation schedule. It’s not a sensor platform. It doesn’t replace your environmental monitoring. And it’s not compliance software. It has nothing to do with seed-to-sale tracking or regulatory reporting.

    It sits on top of all that. It takes the data your operation already generates and turns it into intelligence you can actually use. Think of it as the post-harvest analysis that a $200/hour cultivation consultant would give you, except it has perfect memory of every run you’ve ever done and it’s ready the moment you close out a batch.

    The Compounding Effect: Why Run 20 Is Worth More Than Run 1

    One batch analysis after one run is useful. You’ll get insights you wouldn’t have found on your own. But the real value shows up over time.

    After five runs, the AI starts spotting patterns. Maybe your yields consistently dip when your late-flower VPD drifts above 1.4. Maybe your drying results are better when you target a slower initial weight loss in the first 48 hours. These aren’t things you’d notice from a single run. They emerge from the comparison.

    After twenty runs, you’ve built something genuinely powerful: a complete intelligence layer over your operation. The AI can now compare your current batch against your best run of the same strain in the same room. It can identify slow-moving trends, like a gradual decline in trim ratio that nobody noticed because it dropped half a percent at a time over eight months. It can flag seasonal patterns, like your summer runs consistently underperforming because your cooling can’t quite keep up during peak heat weeks.

    Each analysis gets sharper because it has more of your data to work with. It’s a compounding advantage. The grower who’s been running AI batch analysis for a year has a fundamentally different understanding of their operation than the one who’s been winging it and relying on memory.

    And in a market where cost per pound determines who survives and who doesn’t, that compounding knowledge translates directly into tighter consistency, better yields, and lower costs.

    Batch Comparison: Your Best Run as a Blueprint

    One of the most practical applications of AI batch analysis is comparing runs side by side. Every grower has had that one great run. The one where everything clicked. But when you try to replicate it, you can’t quite get there because you don’t actually know which variables mattered most.

    With batch comparison, you pull up Run 47 (the great one) next to Run 52 (the disappointing one) and the AI breaks down the differences. Not just “the environment was different.” Specifically: Run 47 maintained tighter VPD control during weeks 4 through 6, feed EC was 0.3 lower during the stretch, and the dry room held 60°F and 55% RH consistently versus the 4-degree temperature swings in Run 52.

    That’s how you turn your best run from a happy accident into a repeatable process.

    Who Is This For?

    AI batch analysis is built for commercial cultivators running multiple batches per year who want to systematically improve. Operations that care about dialing in their process, not just getting through the next harvest.

    If you’re running a 10,000-square-foot facility with multiple rooms cycling batches constantly, you already have more data than you can reasonably process. You need something that does the analysis for you and tells you where to focus.

    If you’re a head grower managing a team and you need to communicate clearly about what’s working and what needs to change, batch analysis gives you a common framework. The Goyle Score becomes a shared language. “We scored a 74 on that run, pulled down by environment and drying. Here’s the plan for next time.”

    If you’re an owner or operator looking at your P&L and wondering why Room B always seems to underperform, batch analysis across rooms over time will show you exactly where the gap is and what’s driving it.

    This isn’t for hobby growers running a tent in the basement. It’s for people whose livelihood depends on improving yield, quality, and consistency run after run.

    Getting Started

    Frequently Asked Questions

    What is AI batch analysis in cannabis cultivation?

    AI batch analysis is a post-harvest review process where artificial intelligence examines all the data from a completed cannabis grow cycle – environment readings, feed data, yields, dry weight, lab results – and produces specific recommendations for what to repeat and what to change on the next run. Unlike manual review, AI can process thousands of data points across an entire grow cycle and identify patterns humans miss.

    How does AI batch analysis help lower cost per pound?

    AI batch analysis identifies specific, actionable improvements after every harvest – such as environment control issues that cost yield, drying problems that lost weight, or feeding adjustments that could improve quality. By systematically implementing these improvements run after run, growers achieve higher yields and better consistency from the same infrastructure, directly lowering their cost per pound.

    What data does AI batch analysis use?

    AI batch analysis examines environment data (temperature, humidity, VPD, CO2), feeding and irrigation records, runoff measurements, light schedules, plant counts, dry weight, trim weight, lab results (THC, terpenes, water activity), and grower observations. The more data available, the more specific and actionable the analysis becomes.

    Is AI batch analysis the same as a grow room dashboard?

    No. Dashboards show you what is happening right now. AI batch analysis looks backward at a completed run and tells you why your numbers were what they were and what to do differently next time. It is an analytical tool, not a monitoring tool.

    If you want to see what AI-powered analysis looks like before committing to anything, Growgoyle offers a free AI photo analysis. Upload a canopy photo from your phone and get a master grower assessment in about 60 seconds, with specific targets, priority actions, and differential diagnosis that considers multiple possible causes. It’s a good way to see how the AI thinks about your grow.

    For full AI batch analysis after every run, including batch comparison, Goyle Scores, and improvement recommendations with estimated yield impact, the platform offers a 7-day free trial with complete access.

    The growers who are going to thrive in this market are the ones who treat every run as a learning opportunity and actually capture that learning in a system that compounds over time. That’s what AI batch analysis is. Not a fancy dashboard. Not another app to check. A way to make sure every run you finish makes your next run better.


    Growgoyle.ai pioneered AI batch analysis for commercial cultivators. Get a detailed breakdown after every run, with strengths to repeat, improvements with estimated yield impact, and a Goyle Score that tracks your progress over time. See what the AI sees in your canopy photos – no signup required.

    About the Author

    Eric is a 15-year software engineer who operates a commercial cannabis cultivation facility in Michigan. He built Growgoyle to solve the problems he faces every day: inconsistent yields, forgotten lessons from past runs, and the constant pressure to lower cost per pound. Every feature in Growgoyle comes from real growing experience, not a product roadmap.