Key Findings: Cannabis Yield Optimization
Based on published research and commercial facility data, the three highest-impact yield optimization techniques for commercial cannabis are genetics selection (20-40% improvement potential), CO2 supplementation at 1,200-1,500 ppm (widely reported in commercial settings to boost yields 20-30%), and light intensity optimization through DLI management (Rodriguez-Morrison et al. 2021 showed linear yield increases with light intensity up to the highest levels tested). However, the factor most operations overlook is consistency: repeating peak performance across every batch compounds into more total pounds per year than any single technique improvement.
Cannabis Yield Optimization Techniques Compared
| Technique | Typical Yield Impact | Cost to Implement | Complexity | Best Phase | Key Research |
|---|---|---|---|---|---|
| Genetics selection | +20-40% | Variable (cuts/seeds) | Low (selection), High (phenohunting) | Pre-cycle | Backer et al. 2019, various cultivar trials |
| CO2 supplementation (1,200-1,500 ppm) | +20-30% | $200-500/mo (tank + controller) | Low | Flower | Chandra et al. 2008, 2011 |
| Light intensity / DLI optimization | +15-25% | $0 (dimmer adjustment) to $5,000+ (fixture upgrade) | Medium | Flower | Rodriguez-Morrison et al. 2021; Eaves et al. 2020 |
| VPD optimization (0.8-1.2 kPa flower) | +10-15% | $0 (controller adjustment) | Medium | All phases | Backer et al. 2019 |
| Irrigation and EC management | +8-15% | $0-200/mo | Medium | All phases | Caplan et al. 2017 |
| Defoliation timing | +5-12% | $0 (labor only) | High (skill-dependent) | Week 3 and Week 6 of flower | Danziger & Bernstein 2021 |
| Batch-over-batch analysis | +10-20% cumulative over 3-5 cycles | $499-999/mo (software) | Low | Post-harvest | Emerging practice (see below) |
Individual techniques matter, but the real gains come from stacking them and then repeating the results. A facility that optimizes VPD, light, and CO2 but cannot replicate the results from one batch to the next leaves more pounds on the table than a facility with average technique but tight consistency.
Make Every Batch Better Than the Last
METRC tracks your grow for the state. Growgoyle tracks it for you. Batch tracking, live environmental monitoring, AI-powered plant analysis, and side-by-side batch comparison, all in one place.
7-day free trial. No credit card required.
Most yield optimization content comes from two places: home growers sharing anecdotes, and equipment companies telling you their product is the missing piece. Neither is particularly useful if you’re running a licensed commercial indoor operation where cost per pound determines whether you stay open next year.
This is what the published research actually says about cannabis yield optimization, filtered through the reality of running a commercial facility. Not fixture specs. Not strain reviews. The actual controllable variables and how much they matter.
What Yield Actually Means in a Commercial Context
Before you can optimize yield, you need to measure the right thing. Three metrics matter, and they answer different questions.
Grams per square foot measures canopy utilization. It tells you how efficiently you’re using the physical space you’re paying for. Watch this one when canopy management is the constraint.
Pounds per light measures capital efficiency. Since lighting is a major fixed cost, lb/light tells you how much production you’re extracting per dollar of infrastructure. For most facilities with fixed canopy, this is the most actionable number.
Grams per watt measures energy efficiency. Useful when comparing strains or light recipes, but less useful as an operational benchmark because it conflates genetics with environment.
Total pounds is the wrong metric for optimization purposes. A facility producing 200 lb/run across 80 lights is underperforming one that produces 160 lb across 40 lights. Infrastructure matters. Yield per square foot is often a vanity metric. lb/light gives you a cleaner signal on operational performance.
For benchmarks: Cannabis Business Times data (Lange, 2019) puts the commercial indoor range at roughly 1.5 to 3.0 lb/light, with top performers pushing above 3.0. A separate CBT/Fluence 2025 survey of 185 growers found g/sqft medians in the 35-80 range for indoor canopy. If your numbers consistently land in the bottom half of those ranges, something is leaving yield on the table. You can benchmark your operation in about 30 seconds with a free efficiency scorecard.
Light Is the Primary Yield Driver (But Not How You Think)
Every equipment company will tell you their fixture increases yield. Some of them are even right. But the mechanism matters more than the hardware.
The variable that drives cannabis yield from lighting isn’t wattage. It’s DLI: Daily Light Integral, measured in mol/m²/day. DLI is the cumulative photons your canopy receives across the full photoperiod. Two facilities running the same fixture at different heights, for different hours, with different canopy depths will see dramatically different results even though their “wattage” is identical.
Rodriguez-Morrison et al. (2021) found that increasing PPFD and DLI simultaneously increased both flower yield and cannabinoid content. That’s important because conventional growing wisdom has long treated potency and yield as a tradeoff. The data doesn’t support that in well-managed environments. You can get more of both by increasing DLI within the productive range.
The diminishing returns curve is real, though. Beyond roughly 40-50 mol/m²/day, additional DLI produces less incremental yield while adding heat load and energy costs. Most facilities running modern LED fixtures are working in the 30-45 mol/m²/day range, which is appropriate. The issue is usually not total DLI but uniformity: canopy hotspots and cold spots that create uneven development.
The most common LED optimization failure isn’t choosing the wrong fixture. It’s upgrading fixtures without adjusting canopy management. A high-output LED at 24 inches with an uneven canopy lights the tops of the tallest plants and leaves the rest underserved. An uneven canopy (popcorn, larf, poor light penetration) means more trim labor and lower effective yield even when the top colas look great.
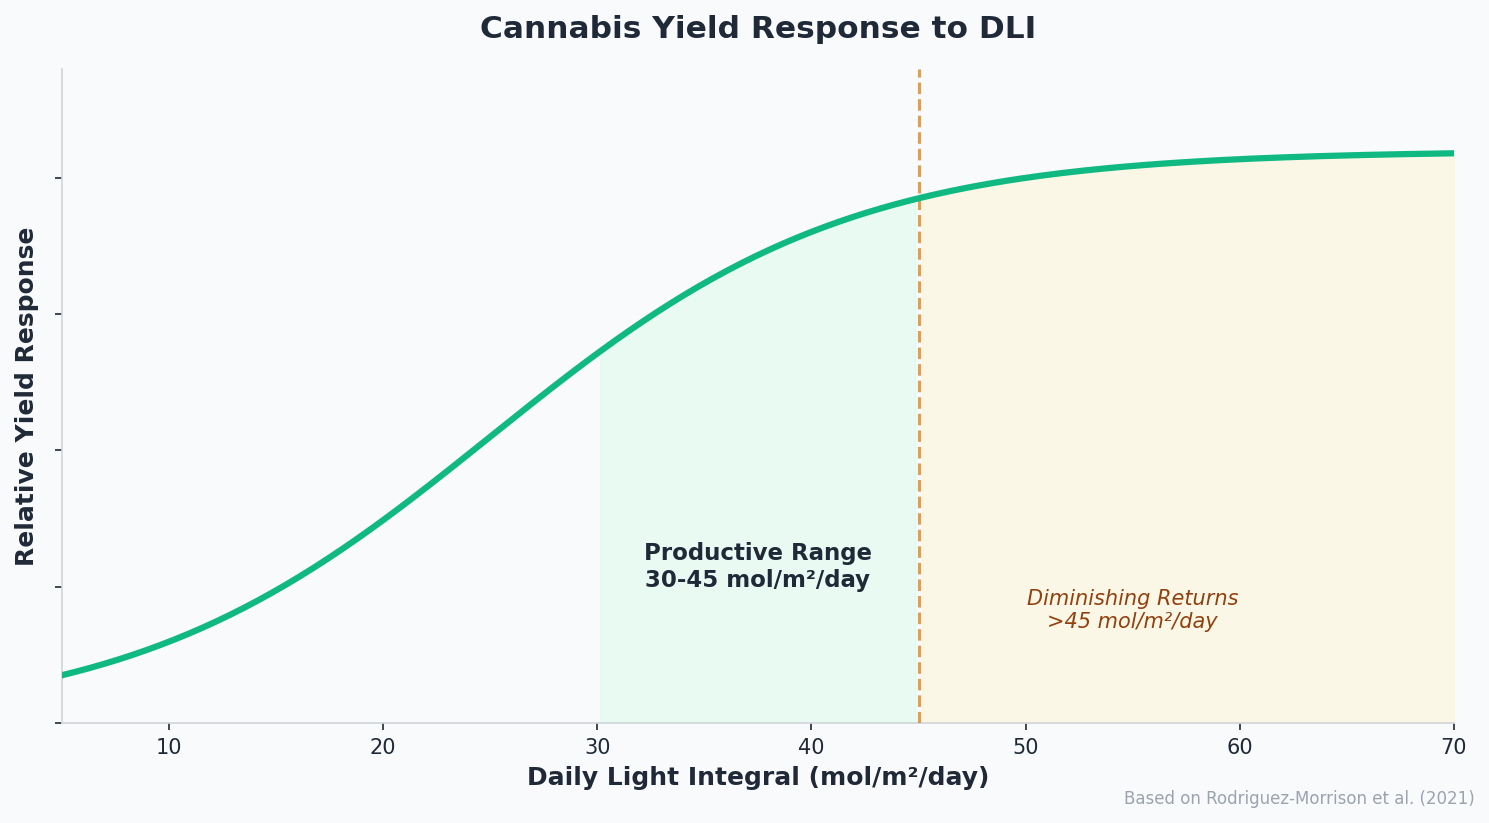
Cannabis yield response to DLI: gains are significant up to roughly 45 mol/m²/day, then level off. Most operations underperform their fixture potential through canopy management gaps, not wrong hardware.
Environment Sets the Ceiling, Genetics Sets the Floor
VPD, CO2, and temperature don’t produce yield. They remove the cap on what your genetics can express. That’s a meaningful distinction when you’re troubleshooting a run that underperformed.
Llewellyn et al. (2022) published a comprehensive review of environmental factors in cannabis cultivation (Front. Plant Sci.), documenting the interaction effects between temperature, humidity, CO2, and light intensity. The key finding for commercial operators: environmental variables have multiplicative effects, not additive ones. Dialing in CO2 at 1200 ppm when VPD is out of range doesn’t deliver the CO2 benefit. The plant can’t use it. The whole stack has to be right.
The practical ceiling for most operations sits around 1200-1500 ppm CO2, 80-85°F canopy temperature, and VPD held in the 1.2-1.6 kPa range during late flower. Getting those numbers right doesn’t guarantee yield, but getting them wrong guarantees you’re leaving some on the table.
On genetics: the trap many commercial operations fall into is chasing new cultivars when proven performers aren’t dialed in yet. If a strain isn’t consistently hitting its genetic potential after 10 runs, a new strain isn’t the answer. The environment or execution has a constraint. Find it first.
One yield thief that’s genuinely underappreciated in commercial cannabis cultivation: Hop Latent Viroid (HLVd). Tumi Genomics data suggests 20-30% yield reduction in infected plants, and the infection accumulates in mother stock. Symptomatic or not, infected mothers propagate the problem into every cut taken from them. Test your mothers. Run clean stock. This one isn’t glamorous, but the yield impact is real and measurable.
Consistency Is Worth More Than Peak Performance
Here’s the argument that most commercial operators haven’t fully run the math on.
A facility that averages 3.0 lb/light with tight run-to-run consistency has a fundamentally different business than one that averages 3.5 lb/light with high variance. Work through the numbers across six runs per room:
- Consistent facility: 3.0 lb/light, every run. Six runs. 18 lb/light/year.
- Variable facility: Three runs at 4.2 lb/light, three runs at 2.8 lb/light. Average 3.5. Same six runs. 21 lb/light/year on paper.
The variable facility wins on raw numbers. But here’s what the math doesn’t capture: the three runs at 2.8 lb have a cause. Something changed between those runs and the good ones. Without systematic batch tracking, that cause doesn’t get identified, documented, or corrected. The same pattern shows up again, or something slightly different produces the same kind of drop.
High variance also means the signal from any intentional change gets lost in the noise. Adjust the dryback protocol, next run comes in at 3.8 lb. Was it the dryback? The weather pattern that kept the facility cooler? Without enough controlled runs to separate signal from noise, outcomes get attributed to interventions that may not have caused them.
The consistent facility can make one change at a time, observe the result, and build on it. That’s how 3.0 becomes 3.2, then 3.4 lb/light over 18 months. Yield consistency in cannabis cultivation is the foundation that makes compound improvement possible.
What drives variance? Four primary sources: execution timing differences (the same task done at different intervals, slightly different ways), environmental drift between runs that doesn’t get compensated for, pest or disease events that go undetected until they’ve already affected yield, and undocumented protocol changes where a recipe was adjusted without a log entry.
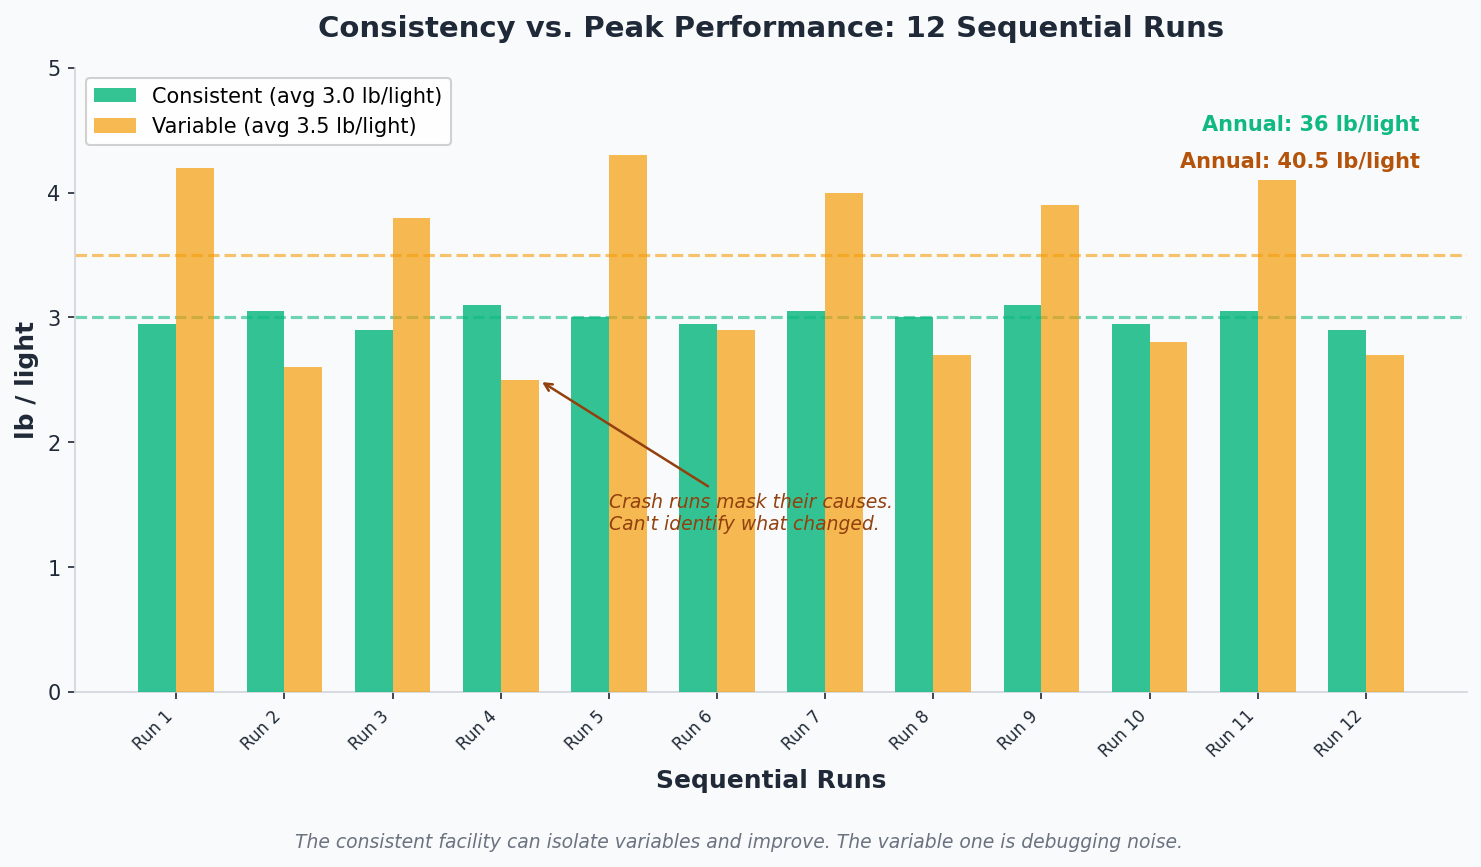
High variance looks good on a highlight reel. Across a full year, crash runs mask their own causes and prevent systematic improvement. The consistent facility can see what changed; the variable one is working with noise.
Turnaround Time: The Yield Metric Nobody Measures
Every day between chop and the next flip is a day your lights aren’t producing flower. Run the math and this stops being obvious and starts being alarming.
Pipp Horticulture’s 2023 benchmarking data puts average turns per year for commercial indoor operations at 4.5 to 5.5, with high-efficiency operations hitting 6 or more. The difference between 5 and 6 turns per year isn’t just one extra run. At 3 lb/light across 100 lights, one additional turn is 300 lb of production. At $500-600 per pound wholesale, that’s $150,000 to $180,000 in additional revenue from the same facility, same team, same infrastructure.
Two extra turnaround days per run across six annual runs equals 12 lost flower days per room. That’s roughly half a harvest cycle sitting empty while cleaning timelines stretch, transplants wait, or clone readiness doesn’t align with harvest schedule.
Where turnaround time hides: cleaning that takes longer because it isn’t scheduled with the same precision as the flowering calendar, transplant delays when the mother room isn’t keeping pace with harvest frequency, and scheduling gaps when team availability doesn’t line up with room readiness. These are operations problems, not grow problems. The plants are fine. The calendar is where the yield disappears.
The Compounding Effect
Here’s what happens when you pull these levers together.
Start with a baseline: 2.8 lb/light, five turns per year, 40 lights. That’s 560 lb/year. At $550/lb wholesale (a reasonable mid-market number), you’re looking at $308,000 in annual revenue.
Now: tighten DLI management and canopy uniformity, add 10% to yield per run. 3.08 lb/light. Add one additional turn per year through tighter scheduling. Reduce variance by systematically comparing runs and correcting drift. True average stabilizes and improves another 5-8%.
Result: roughly 3.2 lb/light at six turns per year. Same 40 lights. 768 lb/year. At $550/lb wholesale, that’s about $422,000 versus your $308,000 baseline at the same price.
That’s roughly 40% more revenue from the same physical infrastructure, through optimization rather than expansion. This is how cost per pound drops without adding a single dollar of fixed cost: more production from the same square footage, same team, same utility bills.
Batch comparison is the tool that makes this systematic. When any two runs can be placed side by side with data on what actually changed between them, the pattern becomes visible and actionable. A sensor dashboard that just displays readings doesn’t give you that. You need analysis that connects the variables to the outcome across runs, not just within them.
You don’t need a bigger facility. You need more from the one you have. The data to do it is already sitting in your runs.
Frequently Asked Questions
Q: What is the biggest factor in cannabis yield?
Genetics sets the floor and ceiling. Even with perfect environment control, a low-yielding cultivar cannot match a high-yielding one. Published cultivar trials show yield differences of 20-40% between strains grown in identical conditions (Backer et al. 2019). After genetics, light intensity (measured as DLI or daily light integral) is the strongest controllable factor, with research showing linear yield increases with no saturation point even at the highest light levels tested. Rodriguez-Morrison et al. (2021) demonstrated a 4.5-fold yield increase across their tested PPFD range in a controlled indoor study, confirming that more light continues to produce more flower up to at least 1,800 μmol/m²/s (approximately 78 mol/m²/day DLI).
Q: What is a good yield per light for commercial cannabis?
For modern commercial facilities using 600-700W LED fixtures, 2.0 to 2.5 pounds per light per cycle is common for average operations. Well-optimized facilities consistently hit 2.5 to 3.5 pounds per light. Above 3.5 is exceptional and typically requires strong genetics, dialed environment control, and experienced cultivation practices. Yield per light is more meaningful than yield per square foot or per plant because light is the primary energy input driving photosynthesis and biomass accumulation.
Q: How does VPD affect cannabis yield?
Vapor pressure deficit controls how fast your plants transpire, which directly affects nutrient uptake and photosynthetic rate. The optimal VPD range for flowering cannabis is approximately 0.8 to 1.2 kPa. Below 0.8, transpiration slows and the plant cannot move nutrients efficiently. Above 1.4, the plant closes stomata to conserve water, which reduces CO2 intake and slows growth. Commercial facilities that actively manage VPD within the optimal range typically see 10-15% yield improvements compared to those running off a static temperature and humidity setpoint.
Q: Can AI improve cannabis yields?
AI does not directly grow plants, but it can identify patterns across multiple batches that are difficult to spot manually. After each harvest, AI batch analysis can compare environment data, cultivation practices, and outcomes to previous runs and identify what drove improvements or declines. Over 3 to 5 cycles, this type of iterative analysis typically compounds into 10-20% cumulative yield improvement because each batch builds on lessons from the last. The key is consistent data collection: environment readings, harvest weights, photos, and grower notes.
Q: How do you measure yield consistency?
The standard statistical measure is coefficient of variation (CV%), which shows how much your yields swing from batch to batch. A CV below 10% means your operation is dialed in and repeatable. Between 10-20% is solid but has room to tighten. Above 20% means significant variation that is costing you pounds and profit. You can calculate this with as few as 4 harvests of the same strain. Track yield per light (or per plant or per square foot) across consecutive runs and look at the spread. A free tool for this is available at app.growgoyle.ai/consistency.
Growgoyle doesn’t track your costs. It helps you lower them. See it in action. Or connect your batches and see what your run data actually shows about yield patterns across harvests. Try it free on your own plants.
About the Author
Eric is a 15-year software engineer who operates a commercial cannabis cultivation facility in Michigan. He built Growgoyle to solve the problems he faces every day: inconsistent yields, forgotten lessons from past runs, and the constant pressure to lower cost per pound. Every feature in Growgoyle comes from real growing experience, not a product roadmap.
Leave a Reply