Cannabis Plant Problem Identification: A Photo-Based Field Guide
Visual cannabis plant problem identification is harder than it looks. Not because growers lack experience, but because plants are terrible communicators. Yellowing leaves are the output of a dozen different inputs. Curling can mean the plant is thriving or suffocating, depending on context. The same spotting pattern shows up from a calcium deficiency, thrip damage, and foliar burn residue. And the default industry diagnosis, “they just locked out,” exists mostly because it’s unfalsifiable without data.
This guide is organized by symptom because that’s how you actually encounter problems in the room. You see something on a leaf, a color shift, a structural change. You don’t walk in already knowing the cause. The goal here is to give commercial growers a framework that works on the floor, not in a textbook.
Three diagnostic questions tie everything together. They appear in a dedicated section near the end, and they are worth reading first. Start with those every time and the rest gets clearer.
Symptom: Leaf Yellowing
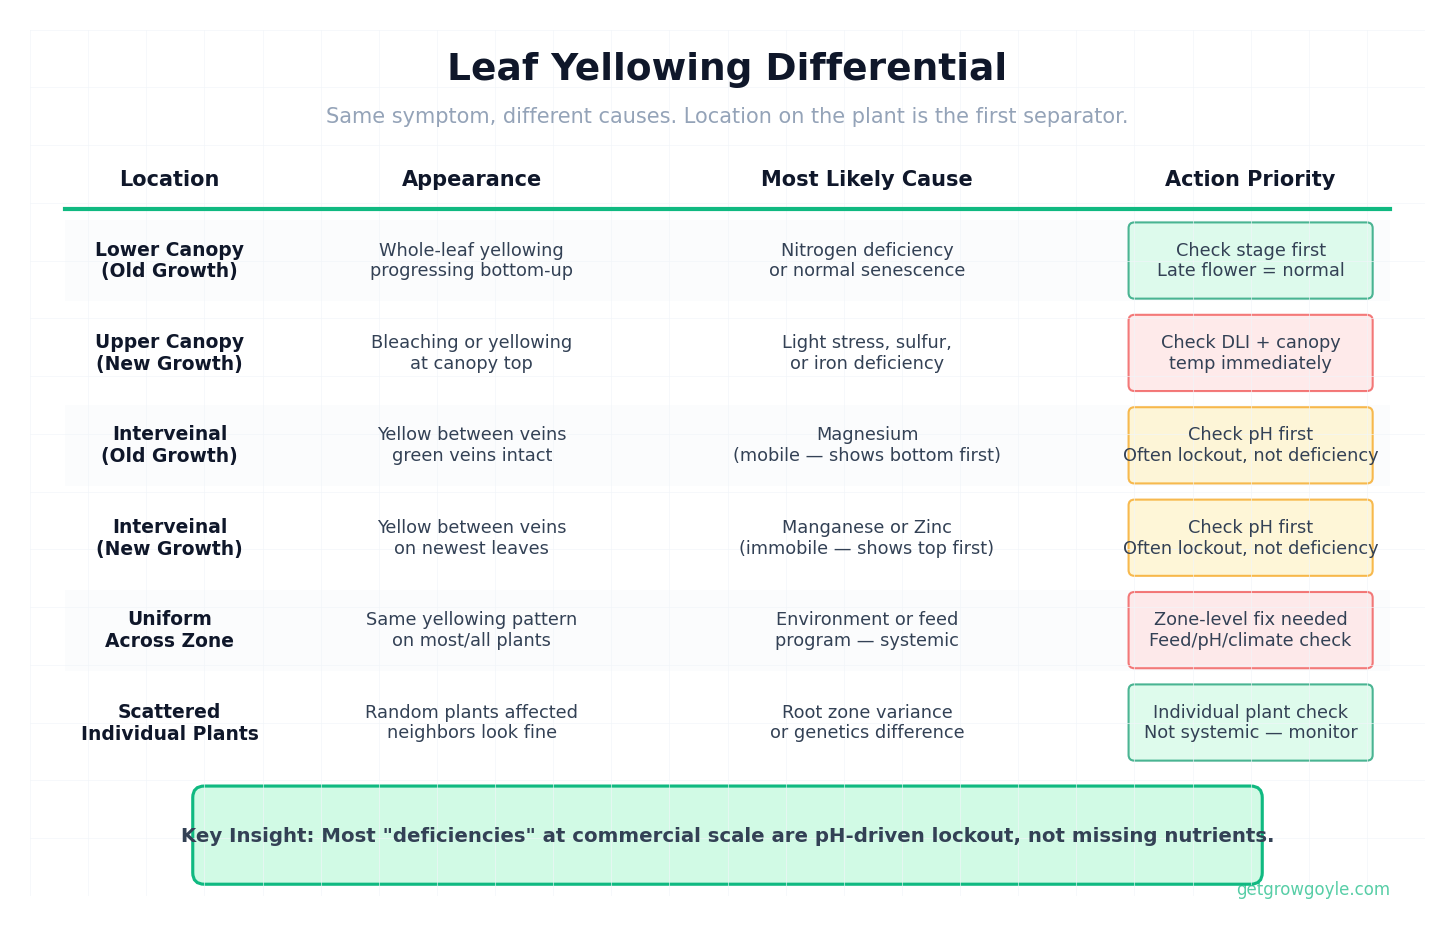
Yellowing is the most common and most misread symptom in cannabis cultivation. The first thing to establish is where on the plant the yellowing is appearing.
Lower canopy yellowing late in flower is often normal. Nitrogen is mobile, and the plant will pull it from older leaves to feed active growth and bud development. If it’s progressive, limited to the bottom third, and the rest of the plant looks healthy, this is senescence, not a deficiency. Pushing more N late in flower to stop lower leaf yellowing is one of the more common over-corrections at the commercial scale.
Upper canopy yellowing is the one to watch. New growth yellowing or bleaching at the top of the canopy in a well-fed room usually points to light stress or, less commonly, sulfur or iron. Sulfur deficiency starts in new growth and moves downward. Iron chlorosis looks similar but tends to be more uniform interveinal yellowing in the newest leaves.
Interveinal chlorosis is the “same-looking trio”: magnesium, manganese, and zinc all produce yellowing between the veins with green veins staying relatively intact. Magnesium is mobile and shows on older leaves first. Manganese and zinc are immobile and show on newer growth first. The location on the plant is the first separator. Then look at pH. All three are commonly pH-driven rather than actual deficiencies in a well-formulated feed program.
At the commercial scale, the single most useful distinction is one zone versus scattered plants. Scattered yellowing across individual plants in a zone points to individual root zone or genetics variance. Uniform yellowing across a whole zone points to environment or feed program. That distinction alone narrows the diagnostic field by half.
Symptom: Leaf Curling and Clawing
Leaf orientation is heavily context-dependent. The same upward curl reads as healthy phototropism in the right environment and heat stress in the wrong one.
Upward curl / praying leaves during lights-on in a stable environment with appropriate VPD is normal. The plant is optimizing for light capture. The same curl at lights-on with canopy temps above 85F and DLI climbing is heat and light stress. The leaf looks the same. VPD tells you more than the leaf shape does. Check your canopy temp and vapor pressure before calling it.
Downward clawing is almost always nitrogen toxicity or overwatering. N toxicity produces a characteristic claw where the tips point straight down and the leaf has a dark, waxy appearance. Overwatering produces a general drooping that can look similar but usually affects the whole plant uniformly rather than just leaf tip orientation. Chronically high moisture content in the root zone is the commercial scale driver here, not a single watering event.
Edge curl / taco leaves fold lengthwise along the midrib. Heat, low humidity, and light intensity that’s too high for the current stage are the typical drivers. A room running 55% RH at the wrong VPD in early flower will show this across the canopy. Look at light distance and intensity before adjusting irrigation or feed.
Symptom: Spots, Burns, and Necrosis
Spotting is where single-symptom diagnosis most frequently leads growers in the wrong direction. Three completely different problems produce visually similar spotting patterns.
Brown tips are nutrient burn, low humidity stress, or light intensity, in roughly that order of frequency at commercial scale. Burn tips start at the very tip and progress inward uniformly. Low humidity stress tends to affect whole leaf margins more than just tips. Light intensity produces more generalized bleaching before tip burn sets in at the most exposed canopy points.
Random spotting is the ambiguous one. Calcium deficiency, pest damage, and foliar spray residue all produce small brown or yellow spots scattered across leaf surface. Ca deficiency spots tend to be irregular, brown to rust, and show on newer growth. Pest damage from thrips or early-stage mites produces stippling that catches the light differently than nutrient spots. Foliar burn from spray residue is usually concentrated on surfaces that dried slowly. When in the cycle the spotting appeared is often the most useful separator.
Necrotic patches in late flower require immediate triage. Potassium deficiency in weeks 6-9 produces necrotic margins on older fan leaves, which looks alarming but is manageable. Botrytis starting inside a dense cola produces a similar browning from the outside that becomes catastrophic in 48-72 hours. The difference: K deficiency is on fan leaf margins in a dry environment, botrytis is inside bud structure in a high-humidity microclimate. One is a nutrition note for next run. The other requires immediate physical intervention and catching it early is the only way to limit losses.
Symptom: Color Changes Beyond Yellowing
Purple stems and petioles generate more concern than they usually warrant. Genetics drives the majority of purple stem expression in modern cannabis cultivars. Phosphorus deficiency can produce it, but in a well-fed commercial program with dialed pH, P deficiency is rare. Temperature differentials during late flower (cool nights, especially under 65F) trigger anthocyanin production and purple coloration that’s entirely genetic expression. Unless the purpling is accompanied by other deficiency symptoms, it’s usually just the plant doing what its genetics dictate.
Dark green, waxy leaves signal excess nitrogen. It reads as “healthy and vigorous” to new growers. At the commercial scale, N excess in mid-to-late flower slows the senescence process the plant needs to transition energy to bud development. It’s not an emergency, but it’s a flag that the feed program needs adjustment.
Pale new growth that’s almost white or very light yellow in the newest leaves is iron or sulfur, and both are usually pH-driven lockout rather than actual deficiency. Iron becomes unavailable above 7.0 in soil and above 6.5 in coco or hydro. If new growth is coming in pale across multiple plants in a zone, check root zone pH before adjusting your feed formula.
Symptom: Structural and Growth Abnormalities
Stunted new growth that’s small, slow, and tight often reflects root zone issues: compaction, overwatering, root rot, or pH out of range locking out multiple nutrients at once. The leaves may look normal in color but the growth rate slows noticeably. In an established commercial run, a zone that’s visually a week behind its neighbors at the same stage is worth a deeper root zone investigation.
Excessive stretch and internodal spacing in the first two weeks of flower is light intensity and spectrum, primarily. Insufficient PPFD, insufficient blue spectrum presence, or steep temperature differentials between day and night all drive stretch. Managing DLI and day/night temp differential is the commercial lever here.
Foxtailing is one of the more consequential distinctions in cannabis plant problem identification. Genetic foxtailing is strain-specific and produces elongated, spired bud structures that are just how that cultivar expresses. Heat and light-stress foxtailing is induced by environmental conditions during late flower and degrades dense bud structure into loose, larf-heavy formations that hurt trim ratios and shelf appeal. The appearance can look similar. Context is everything: did this strain do the same thing last run under the same conditions, or did this zone run hot in weeks 7-9?
Hermaphroditism follows the same forced-choice logic. Stress-induced herming produces banana-shaped stamens inside female flowers in response to heat stress, light leaks, physical damage, or severe pH swings. Genetic instability produces the same structure regardless of how well the environment is managed. If it’s isolated to plants under a ballast that runs hot, or plants near a light leak, the environment is the driver. If it’s distributed randomly across a zone in stable conditions, the genetics need to go.
Symptom: Pest and Pathogen Visual Indicators
Here’s the hard truth about visual pest identification: by the time you see symptoms, the population has been established for 5-10 days. You’re diagnosing history, not current state.
Spider mites produce stippling on upper leaf surfaces from feeding on individual cells. Fine webbing appears once populations are heavy. Russet mites are nearly invisible to the naked eye and produce a yellowing and bronzing of new growth that looks like pH or heat stress until you get a loupe on it.
Powdery mildew in its early stage is a faint white dusting on upper leaf surfaces. Most growers catch it in the middle stage, when it’s a visible white coating. Late-stage PM inside a dense canopy during flower is a much more expensive problem. Environmental controls (VPD, air movement, humidity) are the preventive lever. Detection requires looking, not just checking environmental data.
Botrytis starts inside the cola where you can’t easily see it. By the time there’s external browning visible, the inside of that bud site is compromised. Dense cultivars with tight bud structure in facilities running high humidity in late flower are the highest-risk profile. Physical inspection of suspect colas, especially after any humidity excursion, is the only way to catch it early enough to matter.
Thrips produce a characteristic silver streaking on leaf surfaces where feeding has removed the green tissue. It looks different from nutrient spotting once you’ve seen it: the silver sheen is distinct. Root aphids are the tricky one because the visible symptom is wilting and slow growth that looks like underwatering or root rot. Plants don’t respond to irrigation the way they should. Pulling a plant and looking at the root zone is how you confirm it.
At commercial scale, early detection systems matter more than reactive diagnosis. But when you’re in the room and something looks wrong, knowing the visual patterns narrows the field.
Hop Latent Viroid (HLVd) deserves special attention. Stunted, underperforming plants that test clean for visible pests and do not respond to environmental or nutritional adjustments may be carrying HLVd. Infected plants produce smaller, less potent flowers and are frequently misdiagnosed as “genetics did not perform” or environmental stress. The only confirmation is tissue testing. If multiple plants in a zone are consistently underperforming with no visible explanation, HLVd testing is worth the investment.
The Diagnosis Framework: Three Questions
Every symptom in this guide collapses into three questions that should precede any diagnosis.
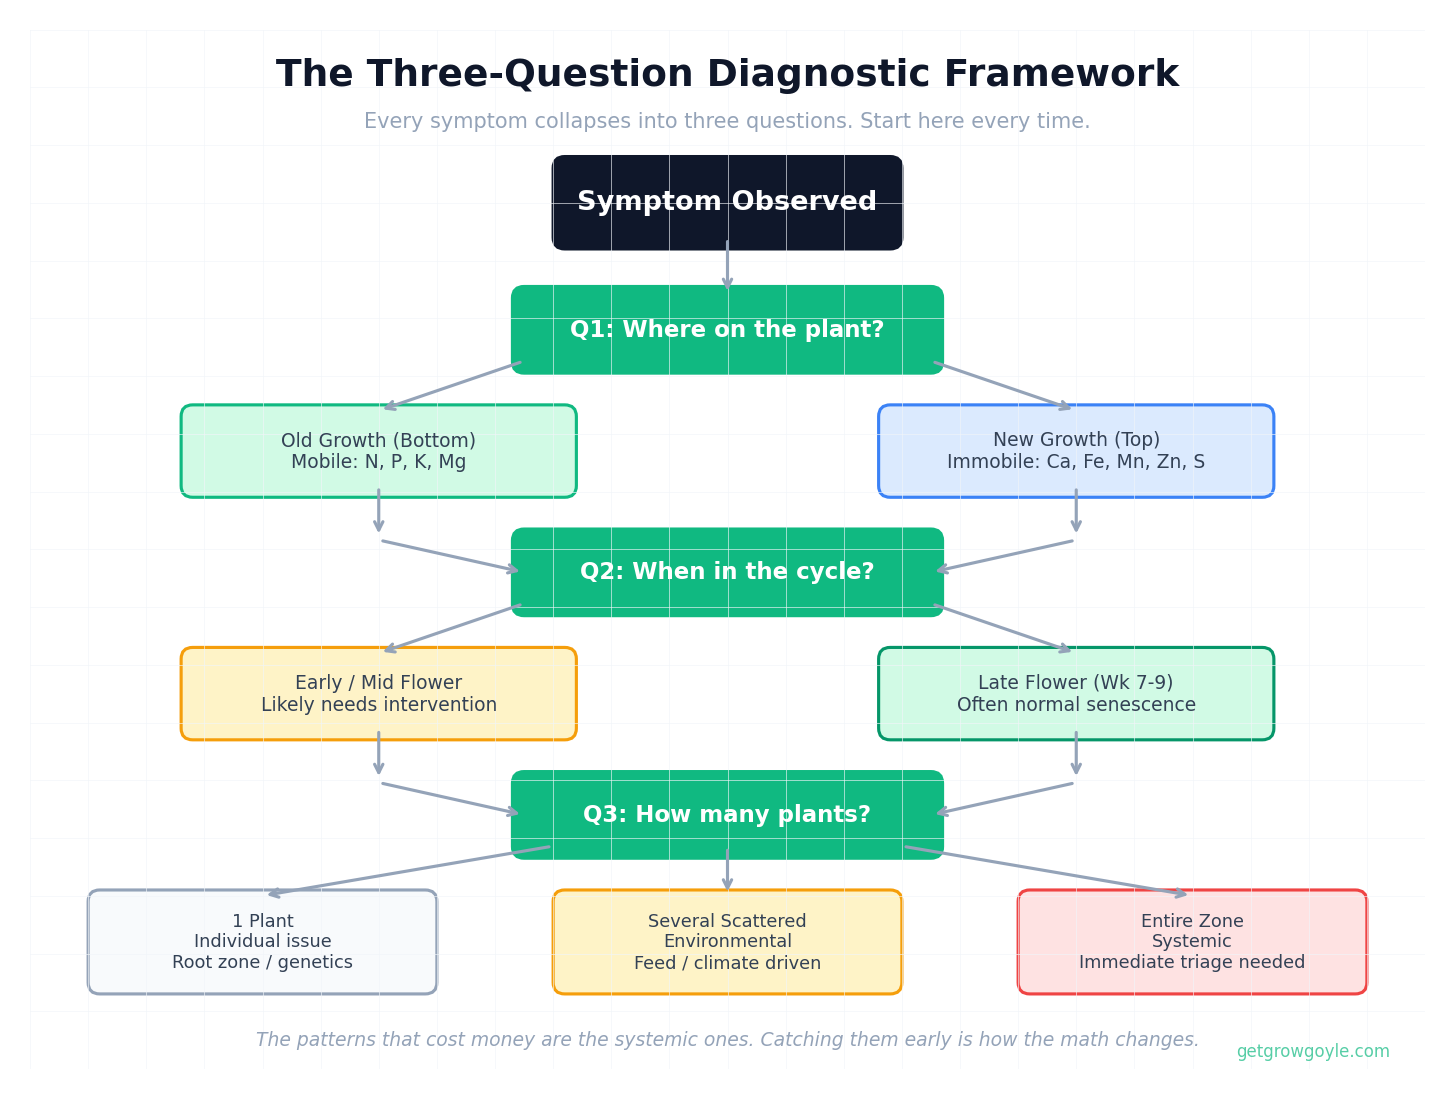
1. Where on the plant? Mobile nutrients (N, P, K, Mg) show deficiency symptoms on older growth first. Immobile nutrients (Ca, Fe, Mn, Zn, S) show on newer growth first. This one question eliminates half the deficiency candidates immediately.
2. When in the cycle? What’s “wrong” in week 3 of veg is often normal in week 8 of flower. Lower leaf yellowing that warrants intervention in week 4 is expected senescence in week 9. Stage context changes the reading of almost every symptom in this guide.
3. How many plants? One plant with a symptom in a zone of 40 is an individual. Ten plants in a zone of 40 scattered randomly is environmental or feed-driven. All 40 plants in a zone showing the same symptom is systemic. Individual versus zone versus facility tells you where to look for the cause and whether this is a one-off or a pattern worth addressing in the next run’s setup. The patterns that cost money are the systemic ones, and catching them early is how the math changes.
Why Photos Beat Memory
Human memory under grow pressure is highly selective. When you’re troubleshooting a zone at the end of a long day, the brain reaches for the most recent diagnosis that matched a similar symptom. Confirmation bias runs hard in plant diagnosis: once you’ve decided it’s Mg, Mg is what you see.
Photos create a timestamped record that removes that bias. A photo from day 32 and a photo from day 39 show you what changed and how fast it changed. That rate of progression is often more diagnostic than the symptom itself. Slow interveinal yellowing that’s been stable for two weeks is almost never the emergency it looks like on day one. Spotting that doubled in 48 hours is.
Multiple observers looking at the same photo catch things a single observer misses. The grower who took the photo has already mentally categorized the symptom. A fresh set of eyes, or an AI analysis that considers the full context of your grow, your environment data, and your recent history, reads it without that pre-framing.
The difference between raw data and actionable intelligence applies to plant photos the same way it applies to environmental data: the value is in the interpretation, not the image itself. Differential diagnosis, considering multiple possible causes and ranking them by probability given the full context of the run, is what separates a useful assessment from a guess. That’s what Growgoyle’s AI photo analysis does. Upload a canopy photo and get a master grower-level read in 60 seconds: specific targets, priority actions, and watchouts based on what’s actually visible.
The plant doesn’t lie. It just doesn’t explain itself. That’s what the framework is for, and that’s where documentation turns vague post-mortems into actual evidence.
Growgoyle doesn’t track your costs. It helps you lower them. See it in action. Try it free on your own plants.
Leave a Reply