Turns Per Year: The Cannabis Yield Metric Nobody Measures
Walk into any grow and you’ll hear the same numbers thrown around. Grams per plant. Yield per light. Grams per square foot. Those matter, and I track all of them. But there’s a metric that decides your annual revenue more than any of them, and almost nobody writes it on the whiteboard.
It’s turns per year. How many complete harvest cycles each room finishes in twelve months.
A flower room that turns 4.5 times a year makes a lot more money than one that turns 4.0, from the same footprint, the same lights, the same rent check. Nothing about the plant changed. What changed is how fast the room resets and gets back to work.
What A Turn Actually Is
A turn is one full cycle for a room: flip to flower, grow it out, harvest, strip, clean, reset, and re-flip. When the next crop goes under the lights, that turn is done and the next one starts.
Most people measure the flower time and stop there. Nine weeks of flower feels like the whole cycle. It isn’t. The turn includes every day the room is empty or being reset. Those days are invisible in your yield numbers, but they’re extremely visible in your bank account.
Here’s the uncomfortable part. Your fixed costs don’t care whether the room is full or empty. Rent, base labor, your license, insurance, and financing all get paid per day, every day, whether that room is packed with flower or sitting empty with the door open.
The Math Fixed Costs Force On You
Let’s do the arithmetic slowly, because this is where the metric earns its keep.
Say a room costs you a flat amount per day in fixed overhead. Rent, labor, license, insurance, all the costs that show up whether you harvest or not. Over a year, that’s 365 days of overhead landing on that one room no matter what.
If the room turns 4 times a year, all that overhead is spread across 4 harvests. If it turns 4.5 times, the same overhead is spread across 4.5 harvests. More pounds carrying the same fixed cost means each pound carries less of it.
That’s the entire game with cost per pound. Fixed costs divided by output. You lower cost per pound one of two ways: cut the fixed cost, or raise the output the fixed cost is spread over. Turns raise the output without you spending another dollar on rent.
If you want the full breakdown of how fixed and variable costs stack into a real number, we walk through it in the complete operator’s guide to cost per pound.
Dead Days Are The Silent Tax
Here’s the number that made me start tracking this seriously: dead days.
A dead day is any day between one harvest and the next flip where the room isn’t growing. Some of that is real work. You have to strip, scrub, and reset. But a lot of it is slack. The crew got pulled onto another room. Clones weren’t ready. Nobody scheduled the deep clean. The next batch sat in veg two days longer than it needed to because the flower room wasn’t open yet.
Two wasted days per cycle sounds like nothing. Do the math across a year and it stops being nothing.
If a room runs roughly 4.3 cycles a year and each cycle leaks 2 extra dead days, that’s about 9 days a year gone. A flower cycle is around 65 to 75 days depending on genetics. Nine dead days is more than 10% of a full cycle. You’ve essentially thrown away a meaningful fraction of one whole harvest from that room, and you paid full overhead the entire time.
Now multiply that across every flower room you run. The dead days you can’t see are quietly funding a harvest you never got.
And it compounds in a way that’s easy to miss. Dead days don’t just cost you the pounds from those specific days. They shift every future flip later on the calendar too. A two day slip this cycle becomes a two day slip on the next flip date, which pushes the harvest after that, and so on down the year. One sloppy reset in January can still be costing you turns in November if nothing ever catches the schedule back up. Rooms don’t self-correct. They drift, and the drift always goes toward more idle time, never less.
Where Turns Are Won Or Lost
Turns don’t improve because you rush the plants. They improve because you remove the slack around the plants. Here’s where the days actually leak.
Dry And Cure Timing
Post-harvest is where a shocking number of dead days hide. If your dry room is also your bottleneck, the flower room can’t reset until the last crop clears. A dialed, predictable dry and cure schedule keeps the pipeline moving so rooms aren’t waiting on each other.
Drying too fast hurts quality, and drying without control hurts consistency. The point isn’t to speed-run the cure. It’s to make it predictable so nothing downstream stalls. We go deep on this in the post-harvest optimization guide.
Turnaround And Room Reset
The gap between “last plant out” and “next plant in” is pure opportunity. A written reset procedure, a stocked supply closet, and a crew that knows the sequence can cut that gap hard. The rooms that turn fastest usually have the most boring, most repeatable reset routines.
Healthy, Consistent Transitions
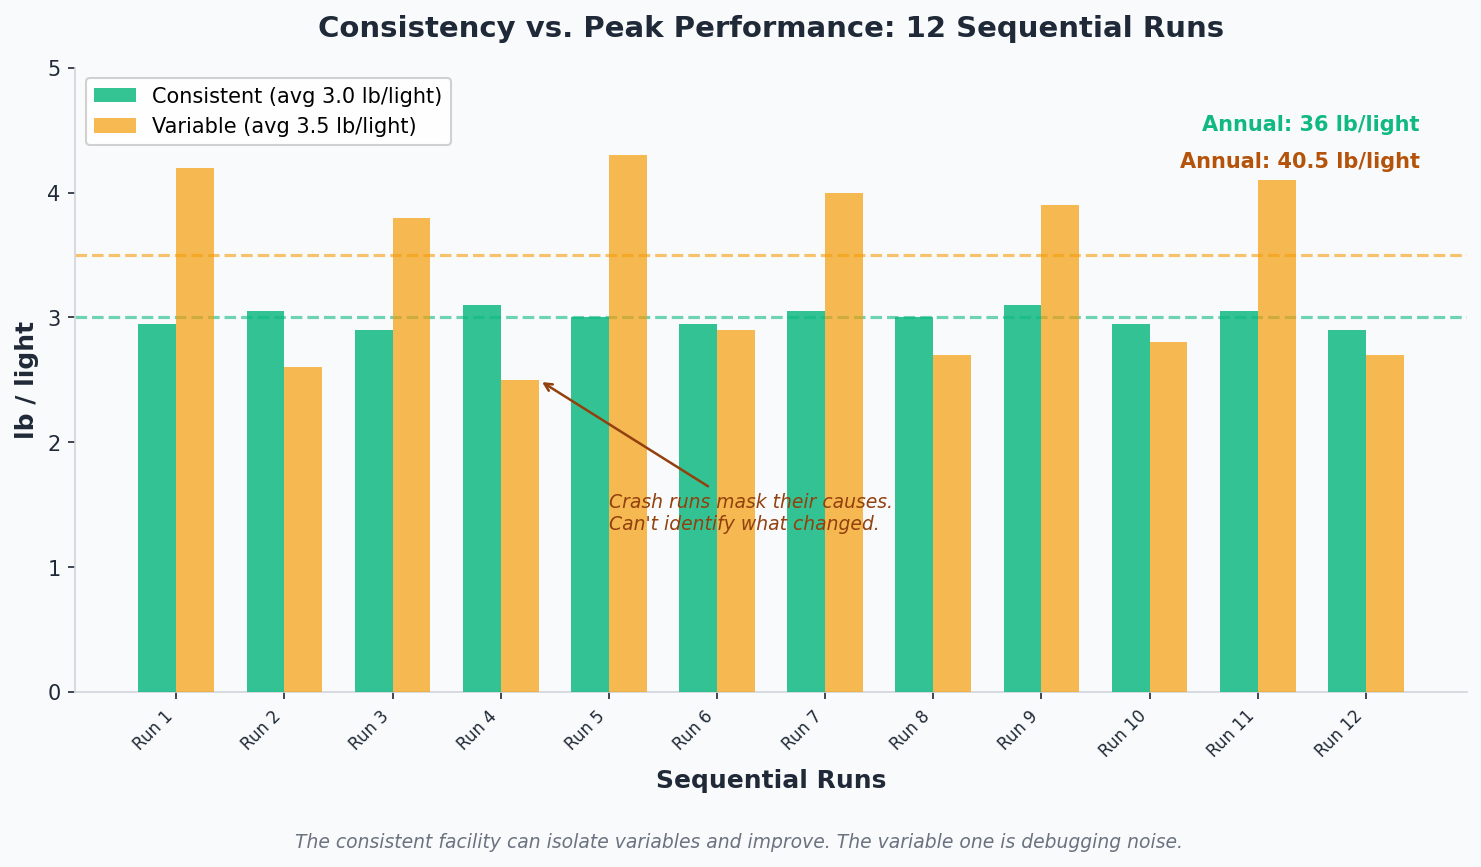
Every time a batch stalls in transition, veg to flower, or clone to veg, the schedule slips and the room behind it waits. Consistent, healthy transitions keep the whole line predictable. When yields swing wildly cycle to cycle, scheduling turns into guesswork, and guesswork creates dead days. That’s the connection between yield consistency and turns that most people miss.
Not Stretching Flower Longer Than Genetics Need
This one is subtle. Some growers leave crops in flower “just to be safe,” adding four or five days past where the genetics actually finish. If the plant is done, those extra days aren’t buying you weight. They’re buying dead time on next year’s turn count.
Trichome and pistil development follow the cultivar’s own clock. Research on cannabis flowering, including work by Zheng and colleagues on environmental control during flowering, shows maturation is genetics and environment driven, not something you improve by simply waiting longer once the plant has finished filling. Know your cultivar’s real finish window and hold the line on it.
Avoiding The Reactive Scramble
The single biggest source of dead days is reacting instead of planning. Clones not ready because nobody counted back from the flip date. A pest issue caught late that forces an unplanned extra clean. A harvest that surprises the crew because nobody logged the flip date. Every scramble adds days, and days are the currency of turns.
Light Intensity Sets The Ceiling, Turns Set The Total
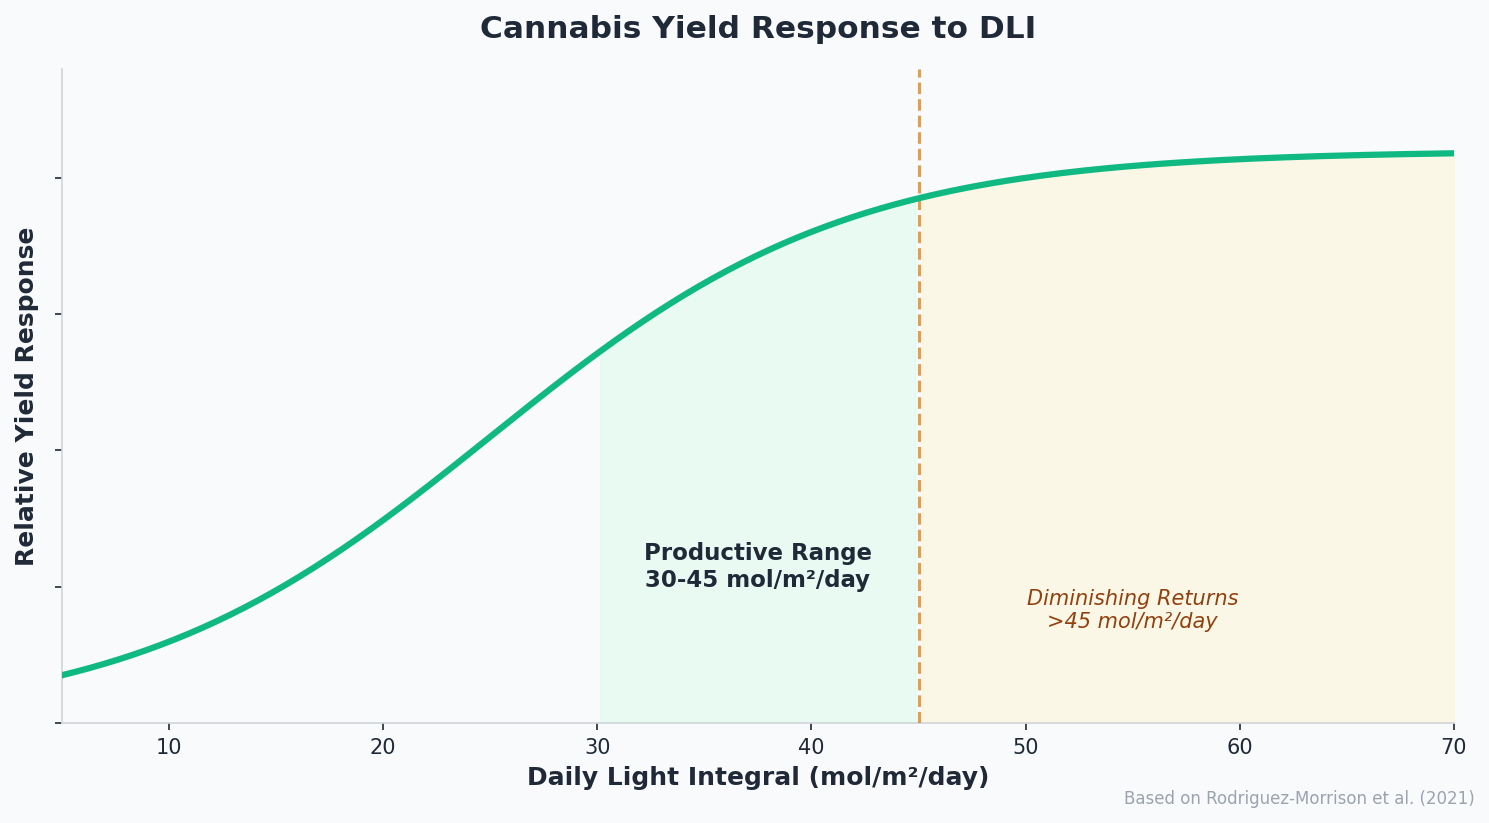
There’s a real biological ceiling on how much any single crop yields. Rodriguez-Morrison, Llewellyn, and Zheng (2021) found cannabis yield increases with light intensity up to roughly 1,800 micromoles per square meter per second of PPFD under enriched CO2, and Eaves and colleagues (2020) documented the strong light-to-yield relationship as well. That’s your per-crop lever, and it’s a good one. If you want the benchmarks, we cover them in yield per light.
But here’s the thing. Light intensity improves the yield of one crop. Turns multiply that yield across the year. You can push your per-light number as high as the genetics and the physics allow, and you still leave money on the table if the room only turns 3.8 times because dead days ate the rest.
The two levers stack. Great per-crop yield times more turns per year is the real annual number. Most operators optimize the first and never measure the second.
How You Actually Find The Dead Days
You can’t fix what you don’t log. The dead days are invisible precisely because nobody writes down the empty ones.
Start with a simple discipline: record the flip date and the harvest date for every batch, per room. That gives you cycle length. Then record the re-flip date. The gap between harvest and re-flip is your reset time, and that’s where most of the slack lives.
METRC has your flip and harvest events because the state requires it, but METRC won’t tell you your average reset gap or which room quietly leaks days. That’s operator data, not compliance data. The difference between the two, and why you need both, is the whole point of batch tracking beyond METRC.
Let Your Best Turn Be The Benchmark
Once you’ve got cycle and reset data across several batches, you’ll see a spread. Some turns were clean and tight. Some dragged. Your fastest clean turn, the one where quality held and nothing slipped, is your benchmark.
The data will show, for example, that Room 2 averages 68 days of flower and 6 days of reset, while your best turn did the same flower time with a 3 day reset. That 3 day gap, repeated every cycle, is the dead time you’re paying for. The benchmark isn’t a fantasy number from a forum. It’s a turn you already pulled off, which means it’s repeatable.
Note the framing there. The data showed a 3 day gap. Nobody screwed up. The record just made a leak visible that was invisible before. That’s what post-harvest review is for: not blame, just finding the days.
What This Looks Like In Practice
A post-harvest review doesn’t have to be a big meeting. After each harvest, log the dates, note anything that delayed the reset, and compare the cycle to your benchmark turn. Over a few months you’ll have a clear picture of where each room loses days and why.
Maybe it’s always the deep clean waiting on a weekend. Maybe clones consistently run two days behind. Maybe one cultivar always gets held an extra four days it doesn’t need. These are small, fixable, boring problems. Boring problems are the best kind, because you can actually solve them.
The fixes are usually cheap, too. A checklist taped to the door. Counting back from the flip date when you set clones instead of eyeballing it. Scheduling the deep clean the day of harvest, not the day you happen to remember. None of this costs money the way another light or another room does. It costs attention. That’s the trade that makes turns such a good lever: you’re buying more annual output with discipline rather than capital, and discipline is the one input you already own.
I’ll be honest about the ceiling here. You are not going to squeeze a fifth turn out of a nine week strain in a single room. The genetics and the flower time set a hard limit. What you can do is close the gap between your average turn and your best turn, and for most operations that gap is real and worth several days a cycle.
Add up the days you recover, divide 365 by your new average cycle length including reset, and you’ll see your turns-per-year number move. From the same rent. From the same lights. From the same footprint.
The Bottom Line On Turns
Grams per light tells you how good your crop is. Turns per year tells you how good your operation is. One is about the plant. The other is about everything around the plant: scheduling, cleaning, transitions, dry, cure, and the discipline to hold a finish date.
Every extra day a room sits idle is fixed overhead spread across fewer pounds, which pushes cost per pound up. Every dead day you recover does the opposite. The math is not complicated. Finding the dead days is the hard part, and that’s a tracking problem, not a growing problem.
Track Your Turns, Not Just Your Yields
Growgoyle is software that runs your grow. It logs your flip, harvest, and re-flip dates per room, surfaces your cycle length and reset gaps over time, and shows you where the dead days are hiding so you can pull them out.
You don’t need to wait for a new batch. Got a room in flower right now? That’s all you need. Start logging dates today and your first turns-per-year picture will build itself from there.
Want to see the dollar side? Run your numbers through the cost per pound math and watch what recovered days do to your annual output. Growgoyle doesn’t track your costs. It helps you lower them.