Cannabis Grow Room Optimization: The 5 KPIs That Actually Matter
How do you optimize a cannabis grow room? Not with a new nutrient line. Not with a lighting upgrade. Not with a VPD chart taped to the wall (though that helps). You optimize by measuring the right things after every harvest, spotting the patterns, and acting on them. That’s it. The entire discipline of cannabis grow room optimization comes down to a feedback loop: measure, analyze, adjust, repeat.
The problem is that most commercial cannabis operations either track too many vanity metrics (yield per square foot, anyone?) or track nothing at all. They run on gut feel and memory. And gut feel doesn’t compound. Data does.
These are the five cannabis cultivation KPIs that actually predict whether your facility is getting better or getting worse. They’re the ones that show up in every conversation I have with operators who are consistently profitable. If you measure all five and review them after every batch, you will improve. Not because you’ll suddenly discover some secret technique, but because the data will show you exactly where the gaps are.
Key Findings: The 5 KPIs That Drive Cannabis Facility Performance
The 5 KPIs that drive commercial cannabis facility performance are: yield per light (production efficiency), cost per pound (financial health), yield consistency / CV% (operational reliability), canopy fill rate (space utilization), and labor hours per pound (workforce efficiency). Operations that track all five and review them after every batch consistently find opportunities to reduce costs and improve output that they would otherwise miss.
| KPI | What It Measures | Target Range | How to Calculate | Why It Matters |
|---|---|---|---|---|
| Yield per light | Production efficiency per fixture | 2.0-3.5+ lb/light (LED 600-700W) | Total dry weight ÷ number of lights | Primary production metric, normalizes for room size |
| Cost per pound | All-in cost to produce one pound | Varies ($200-800+ by market/scale) | Total annual operating cost ÷ total annual dry weight | Determines survival in a compressed wholesale market |
| Yield consistency (CV%) | Run-to-run repeatability | <10% dialed in, 10-20% solid, >20% high variation | Standard deviation ÷ mean of yield per light across 4+ harvests | Hitting big numbers once means nothing if you can’t repeat |
| Canopy fill rate | Space utilization efficiency | 85-95% canopy coverage at flip | Filled canopy area ÷ total available canopy area | Empty space under lights is wasted electricity and rent |
| Labor hours per pound | Workforce efficiency | 8-15 hrs/lb (varies by automation) | Total cultivation labor hours ÷ total dry weight | Second largest cost center after fixed overhead |
1. Yield Per Light: The Primary Cannabis Production Metric
There’s a reason the best cannabis growers talk in pounds per light, not pounds per square foot or pounds per plant. Light is the energy input that drives photosynthesis and biomass production. It’s the common denominator. Whether you’re running a 10-light room or a 200-light warehouse, yield per light lets you compare apples to apples.
Yield per square foot is a vanity metric because it rewards cramming more lights into a space rather than optimizing what each fixture produces. Per plant is even worse because plant count is a function of your growing style (SOG vs. SCROG vs. multi-top), not your efficiency.
Benchmarks by fixture type:
- HPS 1000W: 2.0-2.5 lb/light is solid performance
- LED 600-700W: 2.5-3.5 lb/light is the target range for most commercial cannabis operations
- LED with CO2 supplementation (1,200-1,500 ppm): 3.0-4.0+ lb/light is where top facilities operate
What drives yield per light: Genetics selection has the largest single impact (20-40% yield difference between cultivars under identical conditions). After that, DLI management is the next biggest lever. Research by Rodriguez-Morrison et al. (2021) demonstrated that cannabis yield increases linearly with DLI up to approximately 40-50 mol/m²/day before diminishing returns set in. CO2 supplementation extends that ceiling further. Chandra et al. (2008) showed photosynthetic rates increasing significantly at elevated CO2 concentrations, which translates directly to more dry weight when paired with adequate light intensity. VPD optimization ties it all together: keeping transpiration rates in the right range means the plant can actually use the light and CO2 you’re giving it.
If you’re not tracking yield per light after every harvest, you’re flying blind on your most important production metric. Start with the free efficiency scorecard to see where you stand.
2. Cost Per Pound: The Number That Determines Survival
Wholesale cannabis prices keep compressing. In most mature markets, flower is moving at an estimated ~$500-600 per pound and trending down. You can’t control wholesale price. The only thing you can control is what it costs you to produce a pound. That makes cost per pound the single most important financial metric in commercial cannabis.
Here’s where most operations get it wrong: they think they know their cost per pound, but they’re only counting the obvious line items. Nutrients, electricity, maybe labor. The reality is that a complete cost per pound calculation has 20-27 cost categories. Rent, insurance, loan payments, testing fees, compliance costs, equipment depreciation, waste disposal, packaging, security, accounting, legal, licensing renewals. All of it goes into the denominator.
Most growers underestimate their real cost per pound by 20-40%. That’s not a guess. It’s a pattern that shows up consistently when operations actually run the full calculation.
The relationship between yield and cost per pound is straightforward: your fixed costs (rent, insurance, loan payments, base electricity, management overhead) stay the same whether you pull 2.3 or 2.8 pounds per light. Every additional pound spreads those fixed costs thinner. Better yield equals lower cost per pound. It’s the most direct path to better margins.
Run the free cost per pound calculator to get your real number. It takes five minutes and it’s usually an eye-opener.
One important distinction: Growgoyle doesn’t track your costs. It helps you lower them through better yields and consistency. The calculator gives you a snapshot. The platform helps you improve the inputs that drive cost per pound down over time.
3. Yield Consistency (CV%): The Multiplier
This is the KPI that separates good cannabis operations from great ones. Yield consistency, measured as the coefficient of variation (CV%), tells you how repeatable your results are from run to run.
How to calculate CV%: Take the standard deviation of your yield per light across your last 4+ harvests, divide it by the mean, and multiply by 100. That’s your coefficient of variation.
Example: if your last six runs came in at 2.8, 2.6, 3.0, 2.4, 2.9, and 2.7 lb/light, your mean is 2.73 and your standard deviation is about 0.20. Your CV% is roughly 7.5%. That’s dialed in.
Now consider another facility that hit 3.5, 2.1, 3.0, 2.3, 2.8, and 2.0. Mean of 2.62, standard deviation of 0.57. CV% of 21.7%. That operation has a higher peak, but its average is lower and the swings are costing real money every cycle.
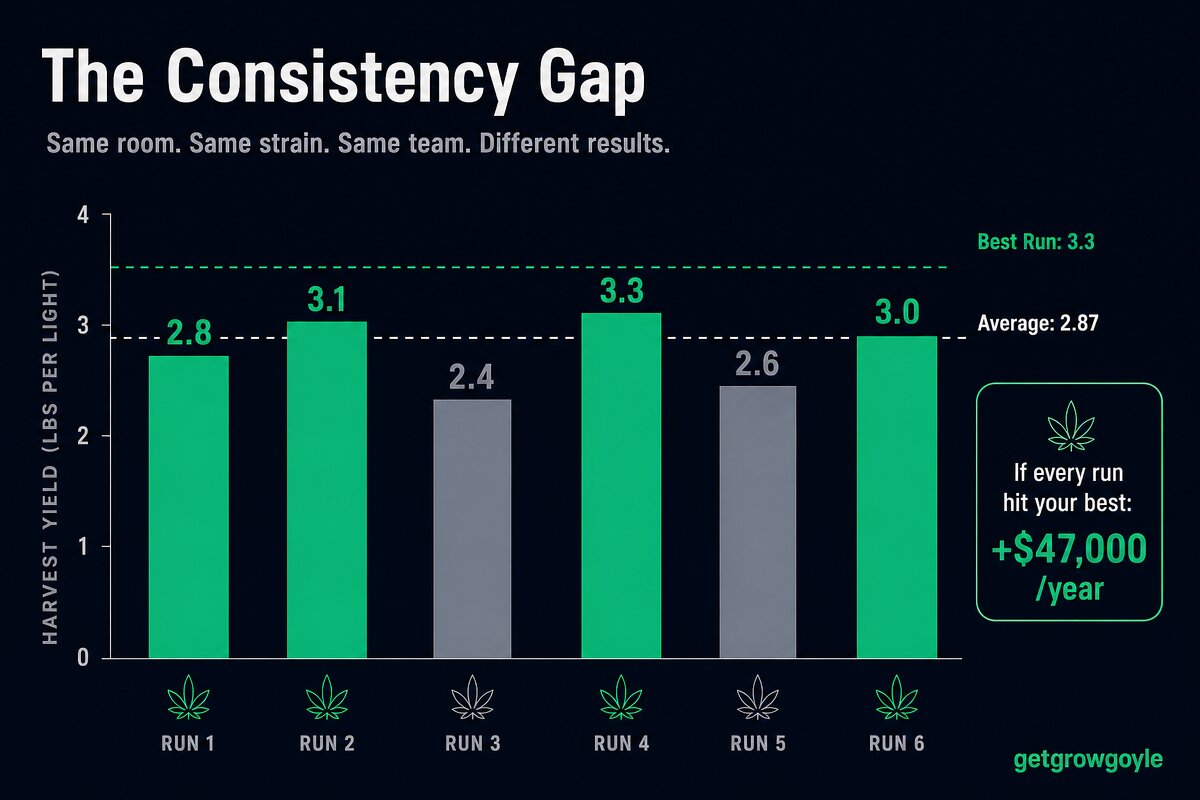
The consistency gap: the distance between your average and your best run is almost pure lost margin.
Why consistency matters more than peak performance: If every harvest matched your best run, the gap between that and your actual average is almost pure margin. Your rent, electricity, insurance, and loan payments stay the same whether you pull 2.8 or 2.3 per light. The delta is profit you’re leaving on the table.
Benchmarks:
- <10% CV: Locked in. The operation is repeatable and predictable.
- 10-20% CV: Solid, but there’s room to tighten up. Something is varying between runs.
- >20% CV: High variation. This is costing real money every cycle.
But consistency requires data, and you can only measure it if you’re logging results. A whiteboard in the flower room captures today. It doesn’t capture 6 runs ago. Every harvest that passes without recording the numbers is another data point you’ll never get back.
Check your consistency with the free yield consistency calculator. Plug in your last several harvests and see where you land.
4. Canopy Fill Rate: Hidden Cannabis Cultivation Efficiency
Canopy fill rate measures the percentage of available canopy space that’s actually filled with productive plant material at the time you flip to flower. It’s a simple concept with outsized impact on your bottom line.
Target range: 85-95% canopy coverage at flip.
Below 85%, you’re wasting light, electricity, and rent on empty space. Every square foot of canopy that isn’t filled with productive plant tissue is a square foot of photons hitting the floor. Above 95%, you start running into crowding issues: restricted airflow, humidity pockets, increased disease pressure, and inner canopy that never sees enough light (popcorn, larf, poor penetration).
What hurts canopy fill rate:
- Uneven plant sizes: Clone variation, inconsistent rooting times, and transplant timing all create an uneven canopy at flip
- Late transplants: Plants that go in late never catch up, leaving gaps
- Poor training consistency: If training protocols aren’t standardized across the team, canopy uniformity suffers
- Plant health issues: HLVd-infected plants growing slower than their neighbors create visible gaps and drag down the average
How to improve it: Consistent clone selection, standardized training protocols that the whole team follows, and regular plant health monitoring. Photo documentation during veg is one of the most effective tools here. A canopy photo at Week 2 and Week 4 of veg makes fill rate issues obvious before flip, when you can still do something about them. Growgoyle’s AI photo analysis can spot these issues early and flag them with specific recommendations.
Canopy fill rate is also the one KPI on this list that’s a leading indicator. You can see it and act on it during the run, not just after harvest. That makes it uniquely valuable for in-cycle course correction.
5. Labor Hours Per Pound: The Hidden Cost Center
Labor typically accounts for 15-25% of total operating cost in a commercial cannabis facility. That makes it the second largest cost center after fixed overhead for most operations. Yet very few growers track labor hours per pound.
How to calculate it: Total cultivation labor hours (everything from transplant through cure) divided by total dry flower weight in pounds. Include trim, harvest, hang, buck, trim again, packaging. All of it.
Target benchmarks: 8-15 hours per pound is a wide range, and where you fall depends heavily on your level of automation. A hand-watered, hand-trimmed operation will naturally sit higher. A facility with automated irrigation, machine trim, and conveyor-based harvest workflows will sit lower. The absolute number matters less than the trend. If labor hours per pound is going up over time, something is getting less efficient.
What drives labor hours per pound up:
- Manual processes that could be automated: Hand-watering is the most common example
- Inconsistent SOPs: When every team member does things slightly differently, tasks take longer and quality varies
- Rework from preventable problems: An uneven canopy means more trim labor. Pest pressure means more IPM hours. Mold means discarded product and rework. Every problem that could have been prevented shows up as extra labor.
This is where batch tracking starts paying off in unexpected ways. When you can see which tasks consumed disproportionate labor relative to their yield impact, priorities get clearer. Growgoyle’s daily task management and AI-guided priority system helps here by surfacing what needs attention today, not just what feels urgent.
How These Cannabis Cultivation KPIs Work Together
These five KPIs don’t exist in isolation. They form a system, and improvements in one area compound through the others.
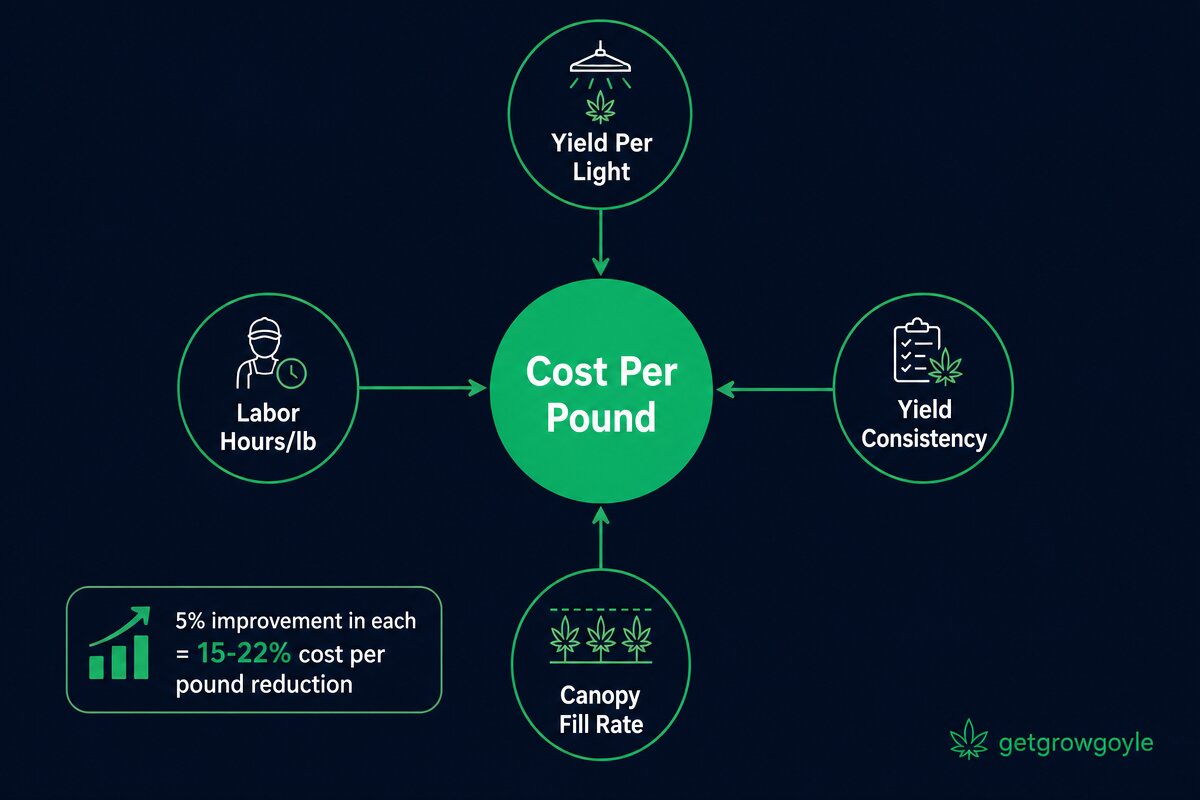
Improving each KPI by 10% doesn’t give you 10% better economics. The compounding effect delivers 25-40%.
Yield per light and cost per pound are inversely related. More yield per light means more pounds over which to spread your fixed costs. A 10% yield increase can translate to a 15-20% cost per pound reduction because fixed costs don’t move.
Consistency multiplies the effect of every other improvement. Finding a technique that adds 0.3 lb/light is great. Repeating it every run is what actually changes your annual numbers. A facility that averages 2.8 lb/light with 8% CV will outperform one averaging 3.0 with 22% CV over the course of a year.
Canopy fill rate is a leading indicator. Unlike the other four KPIs (which you measure after harvest), canopy fill rate is visible during the run. It’s the early warning system. Low fill rate at flip reliably predicts lower yield per light at harvest.
Labor efficiency improves naturally when other KPIs improve. Fewer problems means less rework. Consistent SOPs mean consistent execution times. Better canopy uniformity means faster, cleaner harvests. You don’t have to “optimize labor” directly. Fix the upstream KPIs and labor hours per pound comes down on its own.
The compounding effect is real. Improving each KPI by 10% doesn’t give you 10% better facility economics. Because these metrics interact and compound through each other, small improvements across all five add up to significantly more than any single metric improvement alone. That’s the power of a system-level approach to cannabis grow room optimization.
Make Every Batch Better Than the Last
METRC tracks your grow for the state. Growgoyle tracks it for you. Batch tracking, live environmental monitoring, AI-powered plant analysis, and side-by-side batch comparison, all in one place.
30-day free trial. No credit card required.
Growgoyle doesn’t track your costs. It helps you lower them. See it in action. Try it free on your own plants.
About the Author
Eric is a 15-year software engineer who operates a commercial cannabis cultivation facility in Michigan. He built Growgoyle to solve the problems he faces every day: inconsistent yields, forgotten lessons from past runs, and the constant pressure to lower cost per pound. Every feature in Growgoyle comes from real growing experience, not a product roadmap.
Leave a Reply