If you’re managing a commercial grow room by relative humidity alone, you’re flying with half the instrument panel dark. Relative humidity tells you about the air. VPD tells you about the plant.
Vapor Pressure Deficit is the climate metric that ties temperature and humidity into a single number the plant actually responds to. It directly measures the atmospheric demand on your plants and influences how fast they transpire and how efficiently they uptake nutrients. Once you understand VPD, you’ll never look at a humidity reading the same way again.
🌡️ Free Cannabis VPD Calculator
Enter your temperature and humidity, get your VPD instantly. Includes leaf temperature offset and phase-specific targets.
What VPD Actually Is
VPD measures the difference between how much moisture the air holds and how much it could hold at saturation. The unit is kilopascals (kPa).
In plain terms: VPD tells you how “thirsty” the air is. High VPD means the air is dry and aggressively pulling moisture from every surface, including your plants’ leaves. Low VPD means the air is nearly saturated and the plants can barely transpire at all.
Why this matters more than RH: Relative humidity is relative to temperature. The same 55% RH reading creates completely different conditions for the plant depending on whether the room is 72°F or 84°F.
At 55% RH and 82°F, VPD is approximately 1.6 kPa. The air is pulling hard. Plants are transpiring heavily, and nutrient uptake is high.
At 55% RH and 72°F, VPD drops to approximately 1.2 kPa. Same humidity reading, very different plant response.
The math behind it: VPD = SVP(leaf) – AVP(air), where SVP is the saturation vapor pressure at leaf temperature and AVP is the actual vapor pressure of the air. You don’t need to calculate this manually. The Growgoyle VPD Calculator does it instantly.
The Cannabis VPD Chart: Optimal Ranges by Phase
This chart represents the target VPD ranges for cannabis at each growth phase, based on published research and commercial cultivation experience.
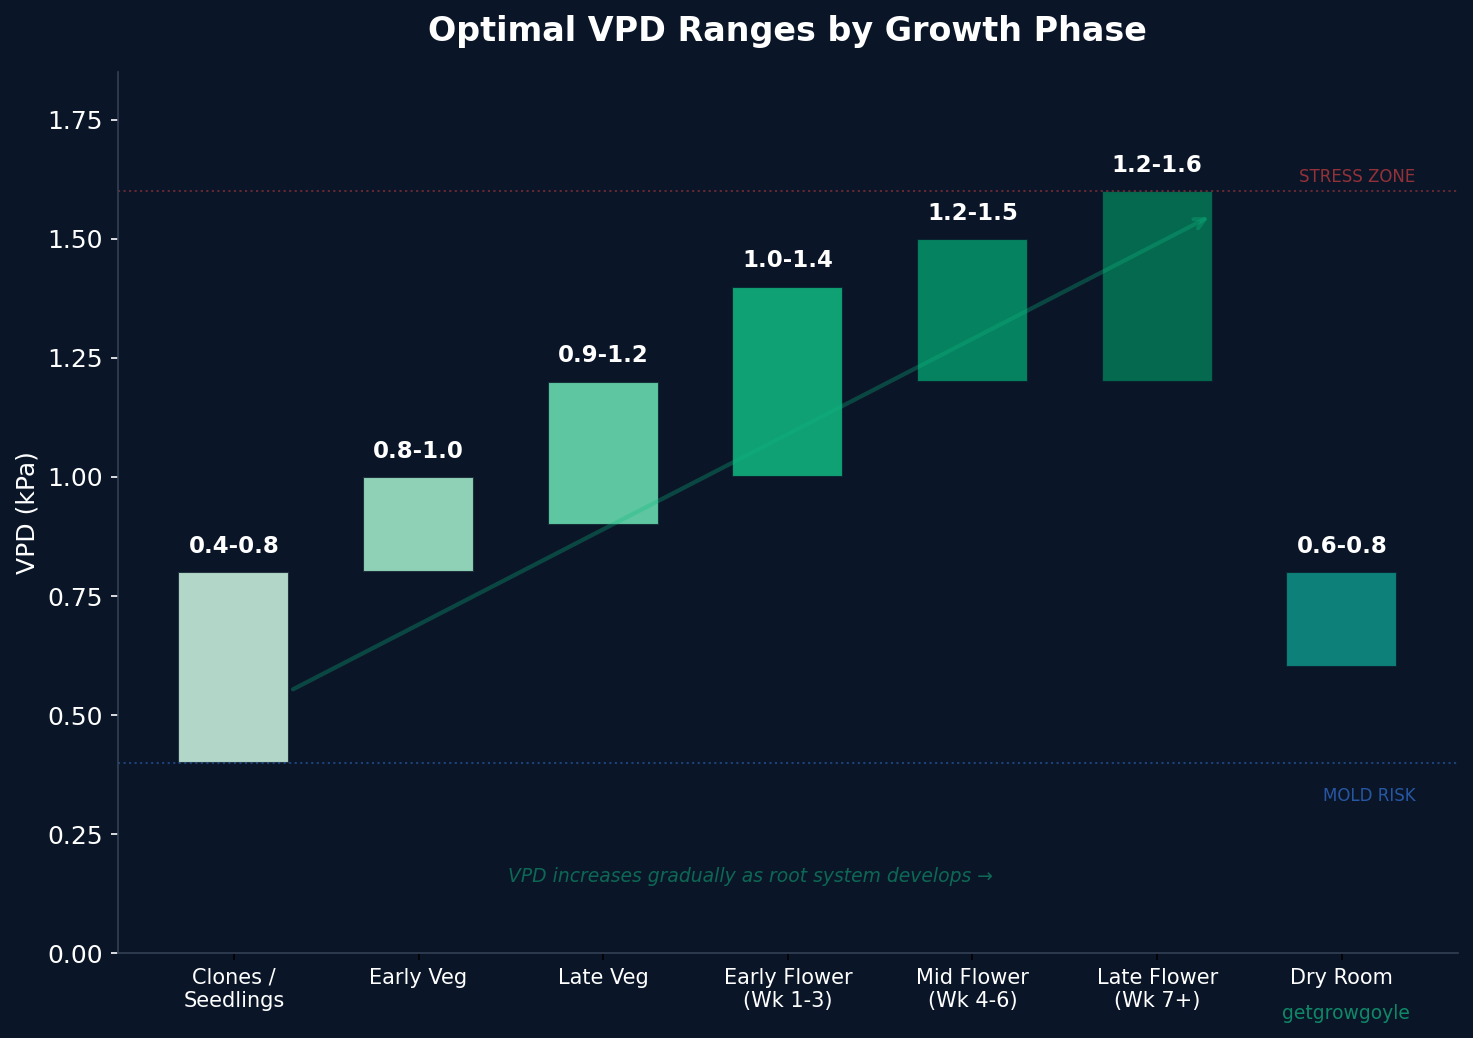
| Growth Phase | Target VPD (kPa) | Temperature Range | RH Range (approx.) | What’s Happening |
|---|---|---|---|---|
| Clones / Seedlings | 0.4 – 0.8 | 75-80°F | 75-85% | Minimal root system. Plants depend on foliar moisture absorption. Low VPD prevents wilting. |
| Early Veg | 0.8 – 1.0 | 76-82°F | 60-70% | Roots developing. Gradually increasing VPD trains the plant to transpire through roots. |
| Late Veg | 0.9 – 1.2 | 76-82°F | 55-65% | Vigorous growth. Higher VPD drives nutrient uptake and stronger vegetative development. |
| Early Flower (Wk 1-3) | 1.0 – 1.4 | 78-82°F | 50-60% | Stretch phase. Plants are metabolically active and water demand is increasing. |
| Mid Flower (Wk 4-6) | 1.2 – 1.5 | 75-80°F | 45-55% | Peak transpiration. Bud development requires consistent nutrient delivery. |
| Late Flower (Wk 7+) | 1.2 – 1.6 | 72-78°F | 40-50% | Dense buds create mold risk. Higher VPD keeps moisture moving out of the flower structure. |
| Dry Room | 0.6 – 0.8 | 60-65°F | 55-65% | Slow, controlled moisture loss. Low VPD prevents case hardening. |
The pattern to notice: VPD gradually increases from clone through late flower. You’re progressively asking the plant to work harder as its root system and vascular capacity develop. Think of it like training. You don’t start a new clone at the same VPD you run in week 7 of flower for the same reason you don’t hand a new employee the most complex task on day one.
A note on precision: Dr. Bruce Bugbee at Utah State University has noted that the optimal VPD range is wider than many growers assume, particularly with adequate root zone moisture and supplemental CO2. He’s right. The difference between 1.1 and 1.3 kPa is unlikely to make or break a run. These phase targets are guidelines based on commercial experience, not rigid rules you need to hit exactly. Where VPD awareness becomes important is the fundamentals: knowing your actual VPD, understanding that two rooms with the same RH can have very different VPD, and recognizing when you’ve drifted into ranges that create real problems (below 0.8 kPa at night, for example).
Cannabis VPD Lookup Chart: Every Temperature and Humidity Combination
This is the cannabis VPD chart most growers want taped to the wall. Find your air temperature on the left, your relative humidity across the top, and read your VPD in kPa. Color coding shows which growth phase each value is appropriate for.
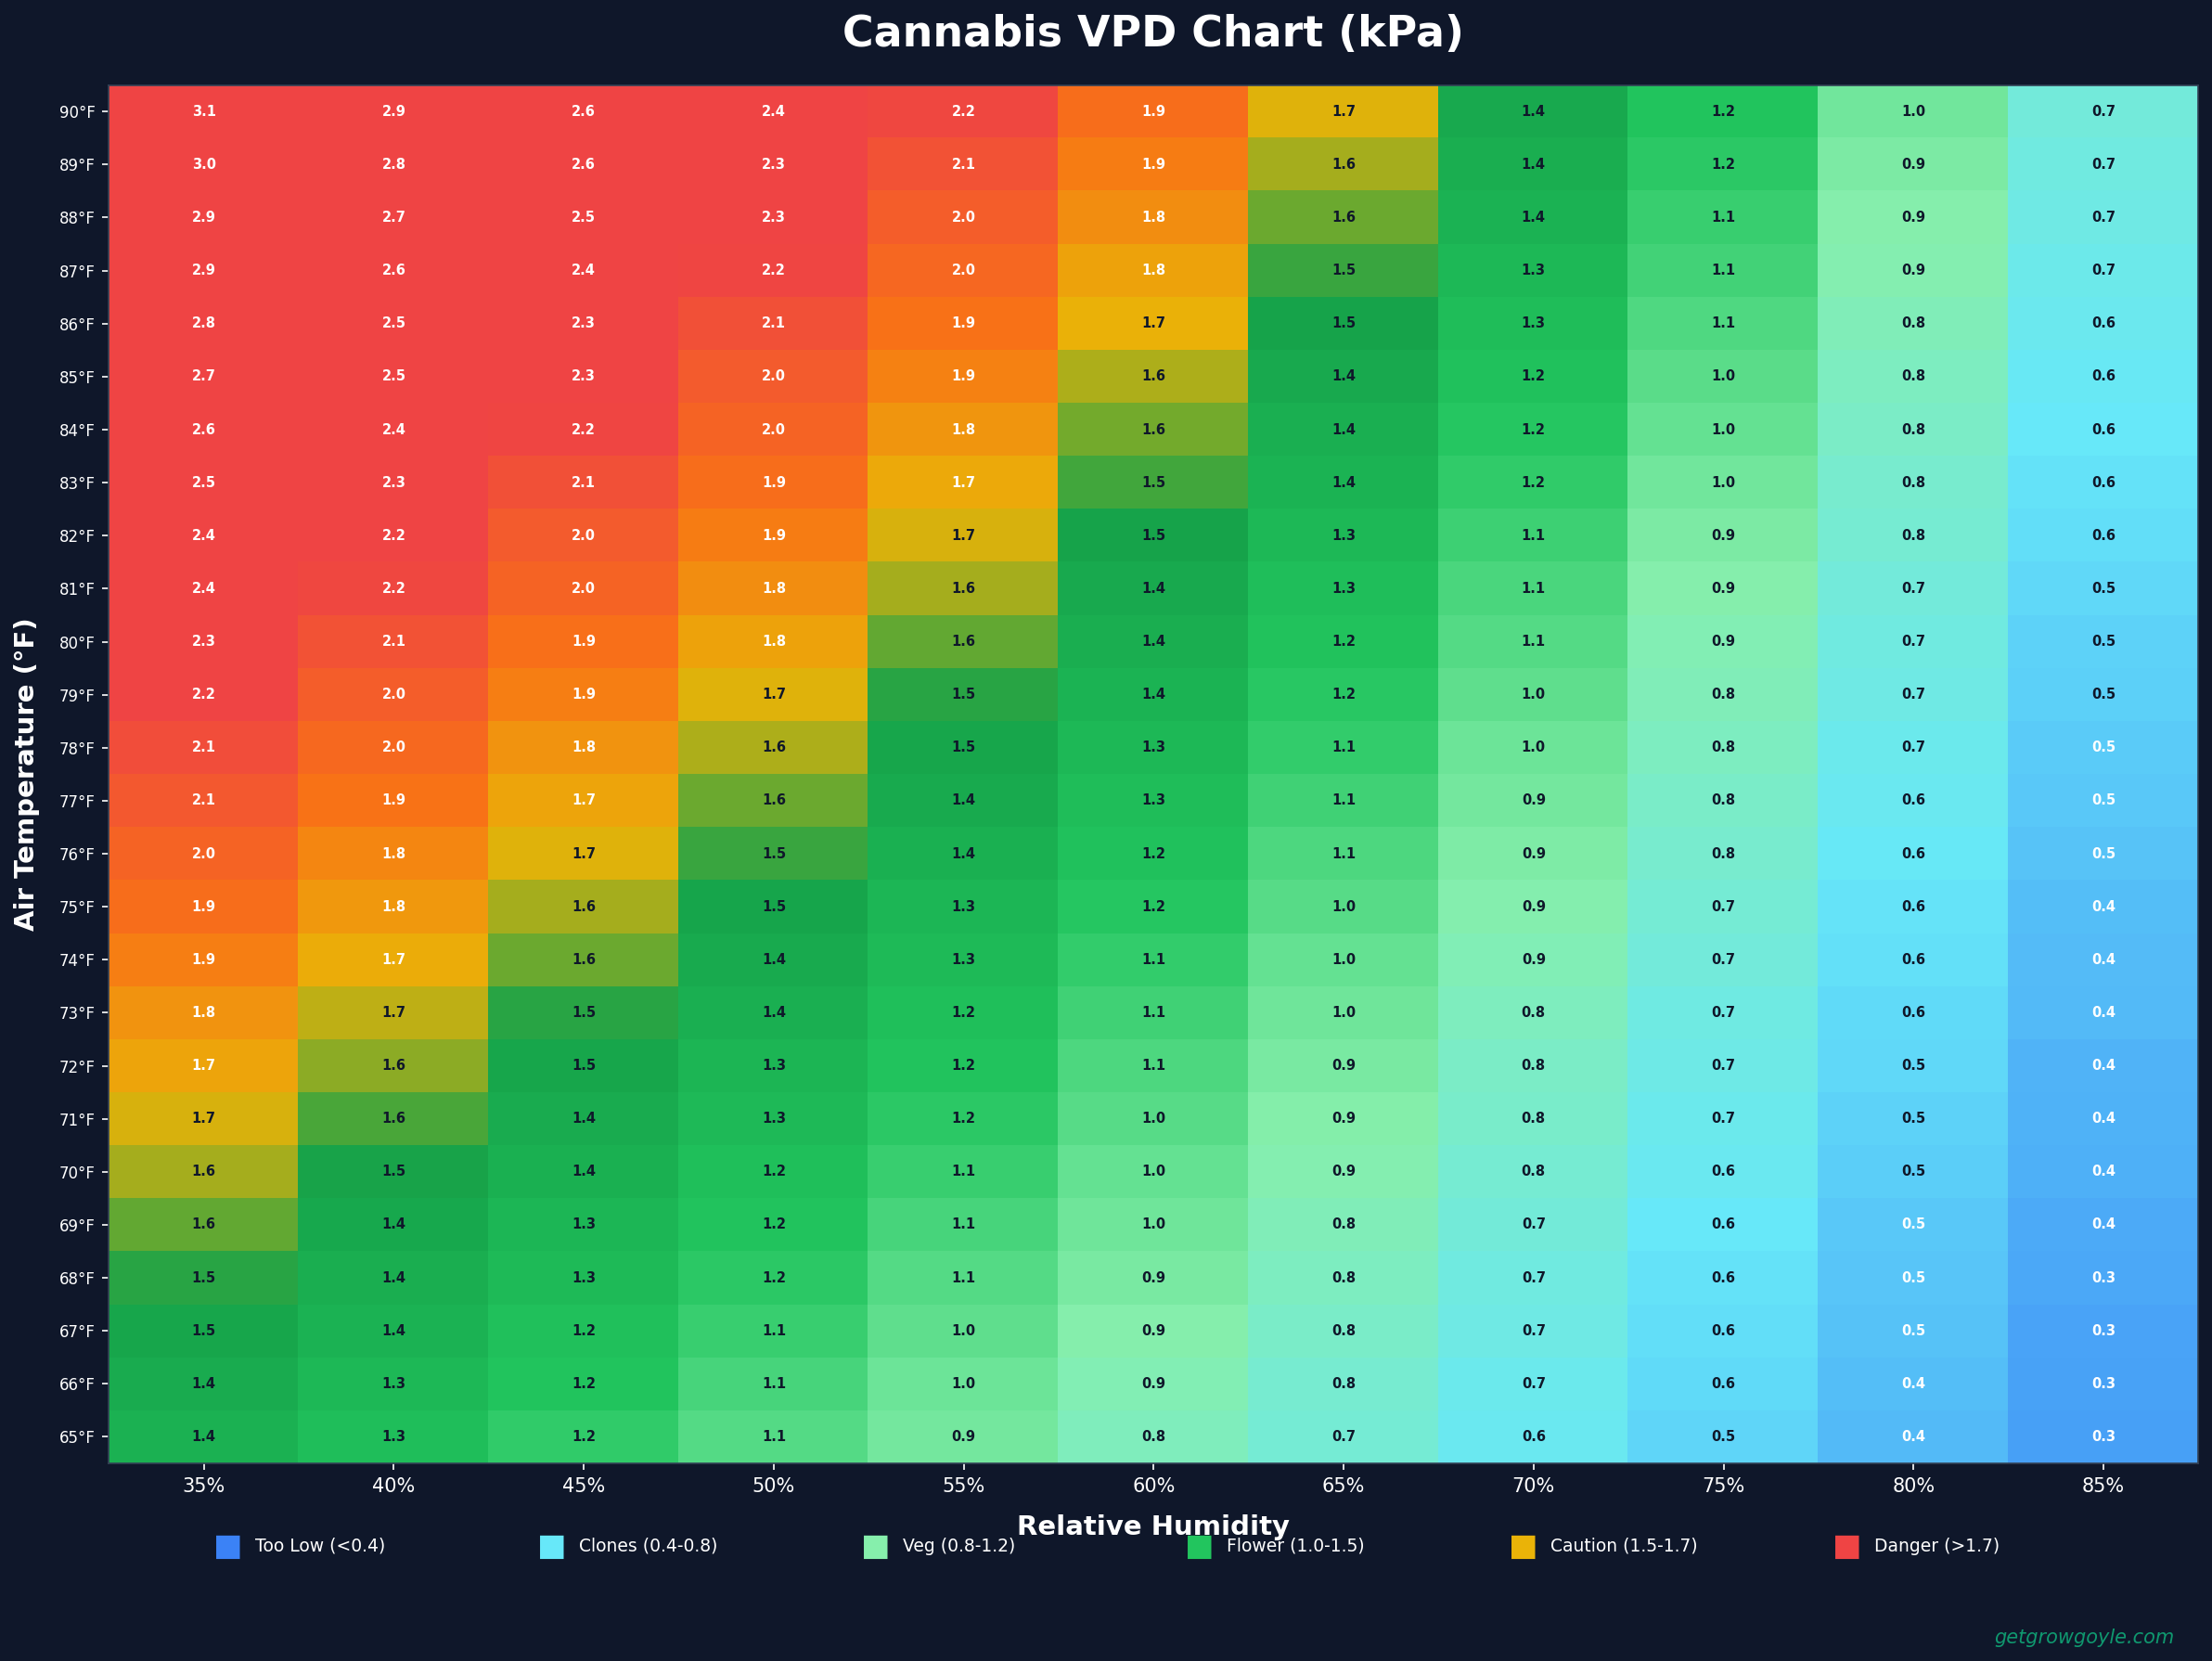
How to read this cannabis VPD chart:
- Blue zones (below 0.4 kPa): VPD is too low. Transpiration is stalled. Mold risk is elevated.
- Cyan zones (0.4-0.8 kPa): Appropriate for clones, seedlings, and the dry room.
- Light green zones (0.8-1.2 kPa): Vegetative growth range. Plants are transpiring at a healthy, moderate rate.
- Green zones (1.0-1.5 kPa): Flower sweet spot. Peak nutrient uptake and bud development.
- Yellow zones (1.5-1.7 kPa): Caution. Plants can handle this briefly but water demand is high.
- Red zones (above 1.7 kPa): Danger. Expect leaf curl, tip burn, and reduced growth.
Want a print-friendly version? Download the printable cannabis VPD chart (white background, designed for printing and posting in your facility).
For real-time calculations with leaf temperature offset, use the free VPD calculator instead of eyeballing the chart. It accounts for the leaf-to-air temperature difference that can shift your actual VPD by 0.2-0.3 kPa under high-intensity lighting.
The Night VPD Problem (That Most Growers Miss)
Most VPD discussions focus on the lights-on period. That’s a mistake. Night VPD is where most crop losses actually originate.
When lights turn off:
- Temperature drops 8-15°F
- Moisture content of the air stays the same
- Relative humidity spikes (cooler air holds less moisture)
- VPD crashes
A room running a healthy 1.3 kPa during the day can easily drop to 0.4 kPa during lights-off. At 0.4 kPa, the air is nearly saturated. Transpiration virtually stops. And the conditions are perfect for Botrytis cinerea (gray mold) and powdery mildew to establish.
The target: Keep lights-off VPD above 0.8 kPa. This usually requires dedicated dehumidification that ramps UP when lights go off, not down. Some facilities add supplemental heat during the dark period to keep the temperature drop manageable and prevent VPD from cratering.
Night VPD is the number one reason late-flower rooms develop botrytis. Dense flower structures trap moisture at the bud site, and if the surrounding air is already near saturation (low VPD), there’s nowhere for that moisture to go.
For a full breakdown of night climate management, see our cannabis climate control guide.
How to Adjust VPD: Two Levers, One Target
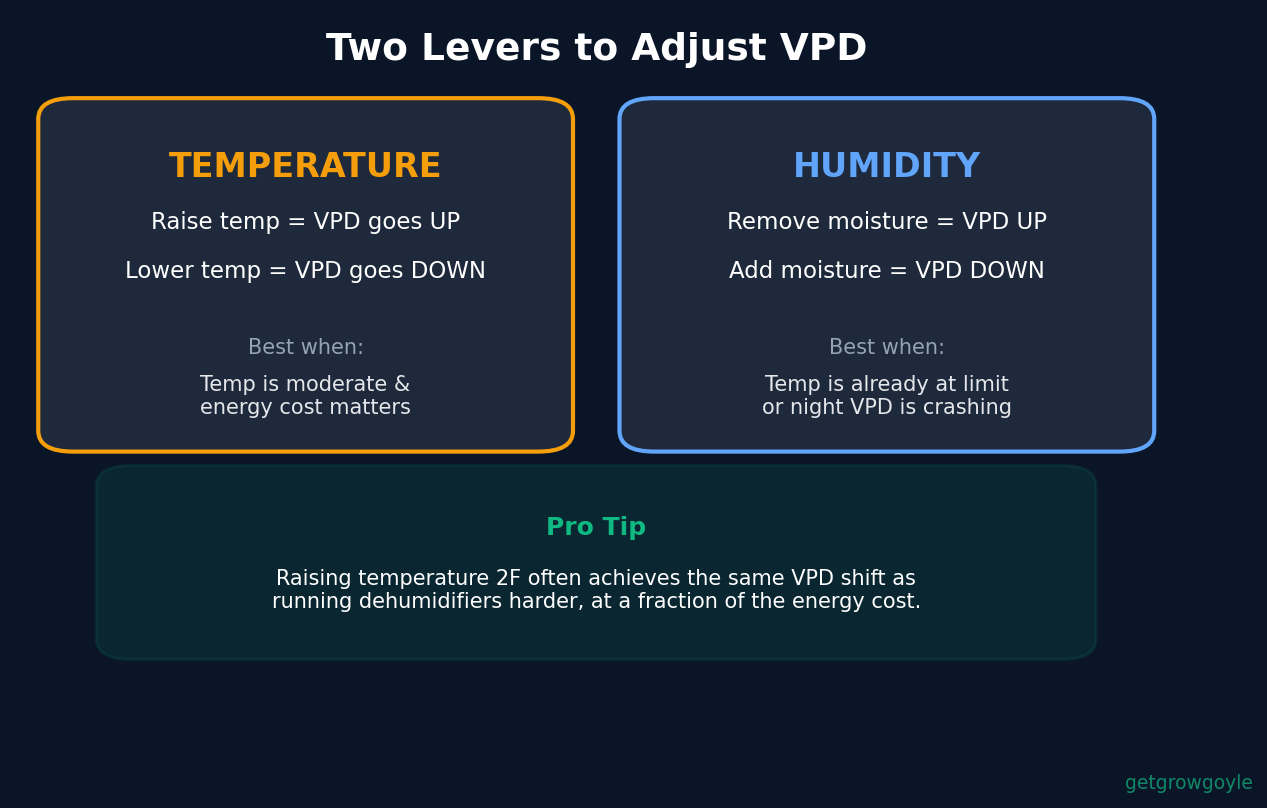
When VPD is off target, you have two options:
Lever 1: Change the Temperature
Raising temperature increases the air’s capacity to hold moisture, which raises VPD (makes the air “thirstier”). Lowering temperature reduces that capacity, which lowers VPD.
Lever 2: Change the Humidity
Removing moisture (dehumidifier) raises VPD. Adding moisture (humidifier, more watering events, wet floors) lowers VPD.
Which lever to pull depends on where you’re starting:
| Scenario | Best Lever | Why |
|---|---|---|
| VPD too low, temp is already high | Dehumidify | Can’t raise temp further without heat stress |
| VPD too low, temp is moderate | Raise temp 2-3°F | Cheaper than running dehumidifiers harder |
| VPD too high, RH is very low | Humidify or slow down airflow | Adding moisture is the only option |
| VPD too high, temp is high | Lower temp | Reduces atmospheric demand and saves on cooling |
| Night VPD crashing | Dehumidify + minimal heat | Prevent temp drop from pulling VPD below 0.8 |
The cost angle: Adjusting temperature by 2°F to shift VPD often costs less in energy than running additional dehumidification. When you’re managing a 50-light room, every watt matters on the electric bill. Knowing which lever is cheaper for a given situation is the difference between a $30 adjustment and a $300 one.
Why VPD Matters More Than RH: A Real Scenario
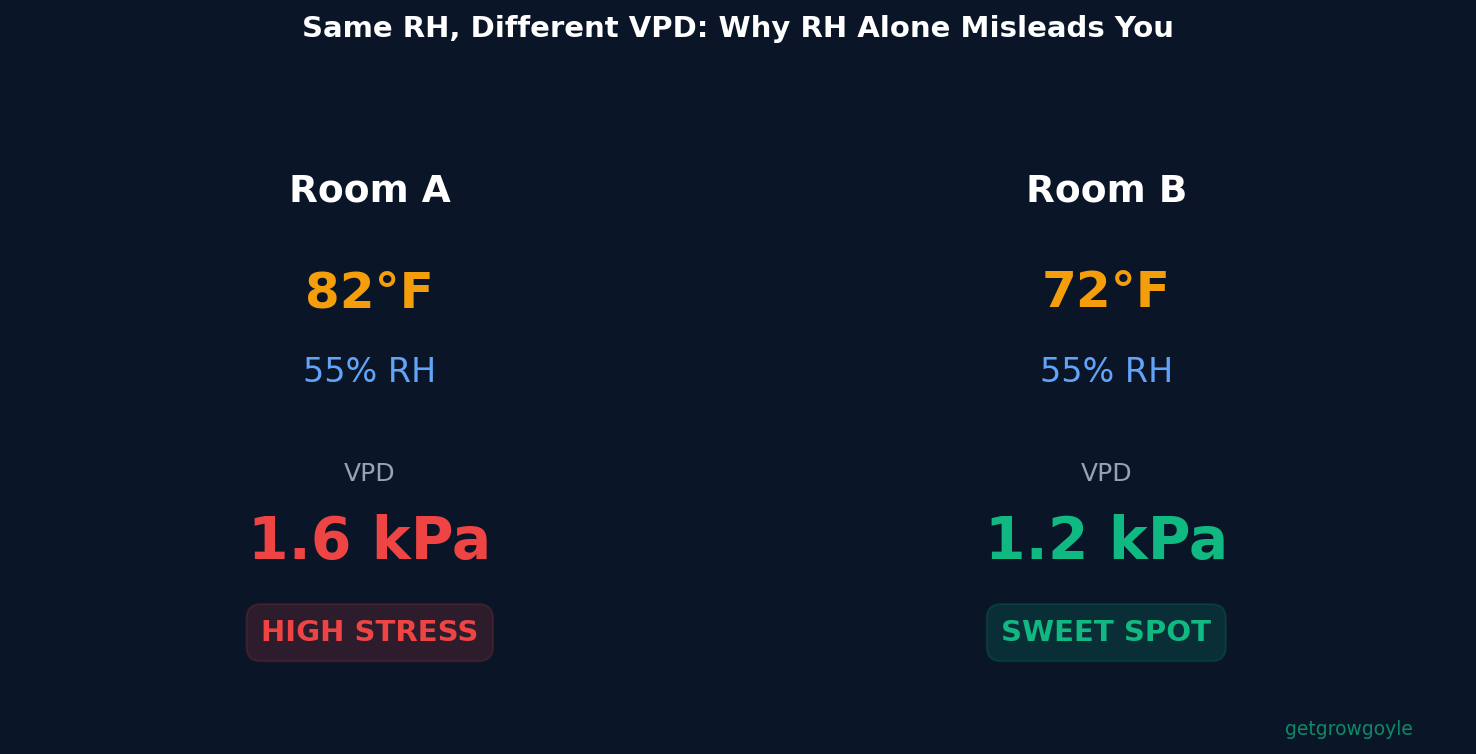
Consider two rooms running identical RH at 55%:
Room A: 82°F, 55% RH = VPD of 1.6 kPa
Plants are transpiring aggressively. Nutrient uptake is high. Water demand is extreme. If irrigation can’t keep up, you’ll see leaf curl and tip burn.
Room B: 72°F, 55% RH = VPD of 1.2 kPa
Plants are transpiring comfortably. Nutrient uptake is moderate and manageable. Irrigation stays ahead of demand.
Same RH. Totally different plant experience. A grower monitoring only RH would think both rooms are identical. A grower monitoring VPD knows Room A is pushing the plants harder and would adjust irrigation scheduling accordingly.
This is why VPD profile is worth investigating when two rooms with the same strain, same feed, and same light produce different results. Different HVAC configurations create different VPD profiles, and different VPD profiles mean different transpiration rates, different nutrient uptake speeds, and different water demand throughout the cycle.
Leaf Surface Temperature: The Missing Variable
The standard VPD calculation uses air temperature and relative humidity. But the plant doesn’t experience air temperature. It experiences leaf temperature.
Under high-intensity lighting (LED or HPS), leaf surfaces can be 3-8°F warmer than the surrounding air depending on distance to light, airflow, and transpiration rate. This means the “real” VPD the plant feels is different from what your controller calculates.
The practical impact: If your sensor reads 78°F and 55% RH, it calculates a VPD of about 1.4 kPa. But if leaf surface temperature is actually 83°F due to radiant heat from LEDs, the plant is experiencing a VPD closer to 1.7 kPa. That’s a meaningful difference and could explain why plants show water stress even when your VPD “looks fine.”
Measuring leaf temperature: Infrared thermometers (point-and-shoot at the canopy) are cheap ($20-40) and give you a direct leaf surface reading. Some commercial sensor systems include IR leaf temperature sensors. If you’re running high PPFD (1,000+ µmol), checking leaf temps regularly is worth the 30 seconds it takes.
LED vs. HPS leaf temperature: Contrary to common belief, LEDs can create higher leaf temperatures than HPS at the same PPFD. HPS produces radiant heat that warms the entire room volume. LEDs concentrate photon energy more directly at the leaf, and the reduced ambient heat means less convective cooling around the leaf surface. Research in controlled environment agriculture has shown that leaf temperatures under LEDs can run 2-4°F higher than under HPS at equivalent light output, due to reduced convective air heating and more concentrated photon energy at the leaf surface.
VPD and Irrigation Timing
VPD directly influences when and how much you should water. Higher VPD means faster transpiration, which means faster substrate dry-back.
The connection:
- High VPD (>1.4 kPa): Plants drink faster. Shorter irrigation intervals or larger shot sizes may be needed. Monitor substrate VWC (volumetric water content) closely.
- Low VPD (<0.9 kPa): Plants drink slowly. Longer intervals between irrigation events. Over-watering risk increases because the plant isn’t pulling moisture from the substrate fast enough.
- VPD crash at night: Substrate stays wet longer during lights-off because transpiration nearly stops. This is why many commercial operations use their final irrigation event 2-3 hours before lights-off, giving the substrate time to partially dry before the VPD drops.
This is a feedback loop. VPD drives transpiration, which drives water demand, which drives irrigation timing, which affects substrate moisture, which affects root zone oxygen availability, which affects nutrient uptake. If VPD is wrong, every downstream decision in your fertigation program is compensating for it.
VPD Across the Facility: Room-to-Room Consistency
Every room in a facility has slightly different thermal characteristics. South-facing walls, different HVAC duct lengths, varying insulation quality, and different equipment layouts all create room-specific VPD fingerprints.
This matters because persistent yield differences between rooms can have environmental roots that aren’t obvious from temp and RH readings alone. If Room 1 consistently produces 3.2 lb/light and Room 3 consistently produces 2.8 lb/light with identical genetics and nutrients, comparing the VPD profiles of both rooms across a full cycle is worth investigating. Night, day, transition periods. The data often reveals the answer.
Tracking VPD data alongside harvest outcomes over multiple runs is the only way to isolate environmental factors from everything else. One run’s data is noise. Five runs of the same strain in two rooms with recorded VPD profiles starts telling you something real about what’s driving the difference.
Quick-Reference VPD Troubleshooting
| Symptom | Likely VPD Issue | Check This |
|---|---|---|
| Leaf tips curling upward | VPD too high | Leaf temperature, airflow intensity, RH |
| Leaf edges browning | VPD too high + inadequate irrigation | Substrate VWC, irrigation frequency |
| Slow growth despite good feed | VPD too low | Night VPD especially. Transpiration may be stalled. |
| Powdery mildew appearing | VPD too low, likely at night | Lights-off VPD. Target > 0.8 kPa overnight. |
| Botrytis in dense flowers | Night VPD crashing | Dehumidification capacity during lights-off |
| Uneven ripening across canopy | VPD microclimates | Airflow dead zones, canopy-level measurements |
| Nutrient lockout despite correct pH | VPD driving over/under-transpiration | Match irrigation to actual VPD, not schedule |
FAQ
What is the ideal VPD for cannabis in flower?
During lights-on in flower, target 1.2-1.5 kPa. Early flower (weeks 1-3) can run slightly lower at 1.0-1.4 kPa during the stretch phase. Late flower (week 7+) benefits from the higher end of the range (1.2-1.6 kPa) to reduce moisture at the bud site and preserve terpenes.
What VPD is too high for cannabis?
Above 1.6 kPa, most cannabis cultivars show signs of water stress: upward leaf curl, reduced growth rate, and increased irrigation demand. Some desert-adapted genetics handle higher VPD, but for most commercial strains, staying below 1.5 kPa is the safe zone. Above 2.0 kPa is problematic for almost all cultivars.
How do I calculate VPD?
VPD = SVP(leaf temperature) – AVP(air). The saturation vapor pressure is calculated from temperature using the Tetens formula, and actual vapor pressure is derived from RH. Use a VPD calculator rather than doing this manually.
Should I monitor VPD at night?
Absolutely. Night VPD is where most mold and mildew problems originate. When lights go off, temperature drops, RH spikes, and VPD can crash to 0.3-0.5 kPa. Keeping lights-off VPD above 0.8 kPa should be a non-negotiable target for commercial flower rooms.
Does VPD affect cannabis potency?
Indirectly, yes. Terpene volatility increases at higher temperatures and VPD levels. Running excessively high VPD (and the high temperatures that usually accompany it) in late flower can reduce terpene content in the finished product. On the other end, a 2025 peer-reviewed study published in Plants (MDPI) found that elevated relative humidity during flowering, creating low VPD conditions of 0.62 kPa and below, significantly decreased cannabinoid concentrations and delayed flowering. Both extremes have documented consequences. Maintaining moderate VPD (1.2-1.5 kPa) at appropriate late-flower temperatures (72-78°F) preserves the aromatic and flavor compounds that affect perceived potency and bag appeal.
Where can I find a cannabis VPD chart?
The printable cannabis VPD chart above covers every temperature from 65-90°F and humidity from 35-85%, color coded by growth phase. For dynamic calculations that account for leaf temperature offset, use the Growgoyle VPD calculator.
What VPD should I run in the dry room?
Target 0.6-0.8 kPa at 60-65°F and 55-65% RH. Low VPD in the dry room prevents case hardening (the outside of the flower drying faster than the inside), which traps moisture and creates conditions for mold during cure. A slow, even dry at controlled VPD preserves terpenes and produces a more consistent final product.
VPD is the metric that connects everything in your grow room: temperature, humidity, transpiration, irrigation, and ultimately yield. Understanding it turns environmental management from guesswork into a repeatable system.
Growgoyle tracks your environment data alongside harvest outcomes across every run and uses AI to identify which climate factors actually drove results. It doesn’t track your costs. It helps you lower them through better yields and tighter consistency.
Leave a Reply