Data updated September 14, 2026. The latest complete CRA monthly report listed is July. This update separates that first month of Q3 from the completed April–June quarter. A full Q3 result is not available yet.
Michigan adult-use sales held near a quarter-billion dollars a month through Q2. That keeps product moving, but it does not remove the pressure on cultivation margins. The number to watch is not only sales. It is what those sales mean for flower price, active licenses, and the cost of producing a repeatable pound.
July 2026: sales rose, retail flower stayed under $60 an ounce
July adult-use sales were $270.54 million, with 116,560.38 pounds of flower sold and an average retail flower price of $58.95 per ounce. Sales were above June’s $252.80 million, but the retail price moved only modestly from $58.18. These are CRA retail-market figures, not wholesale settlement prices. [3]
Q2 in one view: sales stayed high while retail flower softened
The CRA reported $768.66 million in adult-use sales across April, May, and June 2026. Monthly sales were $258.18 million in April, $257.68 million in May, and $252.80 million in June. Adult-use flower volume for the quarter was 339,133.97 pounds. [1]
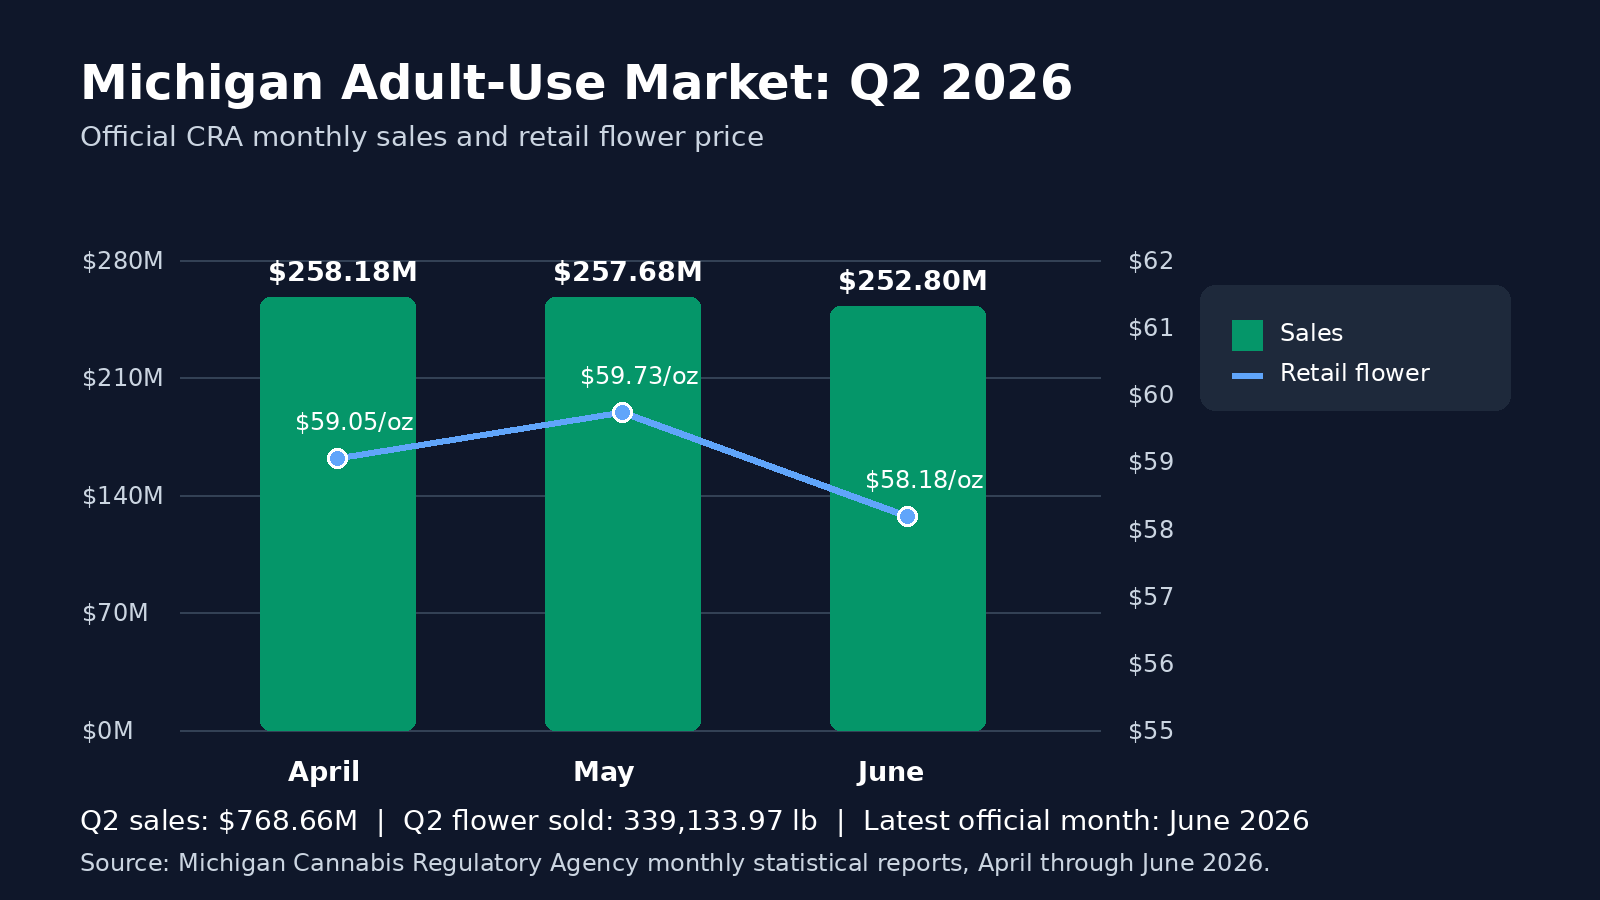
Average reported adult-use retail flower price was $59.05 per ounce in April, $59.73 in May, and $58.18 in June. That is a modest decline across the quarter, not a price recovery. The CRA figures are retail data, so they should not be treated as a grower’s realized wholesale price. They do, however, show the shelf-price environment cultivators are selling into. [1]
Wholesale reference: use the number for the job it is built to do
For July 1 through September 30, 2026, Michigan Treasury lists an average wholesale flower price of $641.41 per pound for its quarterly price guidance. Treasury calculates the list by aggregating three months of sales and quantities, then applying a stated wholesale-to-retail assumption. It is a tax-guidance benchmark, not a guarantee of what any individual lot will clear for. [2]
For a facility budget, that distinction matters. A posted benchmark cannot replace contracted price, grade mix, payment terms, trim disposition, or transport and testing costs. Build the budget from your own realized prices by batch and customer, and stress-test a lower-price scenario.
For the actual price your product earns, the operating question is the same: can the room produce a consistent pound below its realized revenue? Start with a clean cost-per-pound calculation, then review yield and quality by batch instead of relying on a facility-wide average.
License counts: July ended with 936 adult-use grower licenses
The official July report lists 936 adult-use grower licenses: 9 Class A, 68 Class B, 798 Class C, and 61 Excess Grower licenses. June ended at 939. July also recorded 268 processors and 836 retailers. [3]
| Adult-use license type | July 31, 2026 |
|---|---|
| Class A grower | 9 |
| Class B grower | 68 |
| Class C grower | 798 |
| Excess grower | 61 |
| Total growers | 936 |
These are licenses, not a count of independent businesses or operating facilities. One operator may hold several. The earlier July 23 snapshot has been replaced with the published month-end report so the date and source are clear.
What the numbers mean inside a cultivation facility
High sales volume is not the same thing as margin relief. Q2 sales were resilient, but the reported retail flower price finished June below April. That leaves limited room for a cultivator to absorb avoidable loss.
Cost per pound needs a batch-level explanation. If labor, energy, inputs, remediation, or grade mix move, a monthly facility average will hide the cause. Compare like-for-like batches, record the environment and work that changed, and tie the result back to dry yield and sellable quality. A structured batch-tracking process makes that review possible.
Environment is a production input, not background noise. Room averages can look fine while daily swings, poor drybacks, or leaf-temperature differences pull a crop off target. Use the VPD guide as a starting point, then validate the targets against your own harvest and quality results.
Do not turn one month into a quarter. July is the latest report listed on the CRA index as of September 14. August, September, and a full-Q3 total are not included here. [4]
Michigan market outlook for Q3 2026
The available data describes a market with steady retail demand, a low retail flower price, and slightly fewer active adult-use grower licenses in July than in June. That is enough to make disciplined production important, but it is not enough to predict a wholesale turn.
For operators, the useful response is plain: know realized revenue by product and customer, know cost per pound by batch, and identify which changes actually improve yield and sellable quality. In a market where a few dollars per ounce matter at retail, unmeasured variation inside the facility becomes expensive quickly.
Michigan Cannabis Market Intel
For the existing weekly market update, subscribe to Michigan Cannabis Market Intel. The newsletter is intended for operators who want dated license, price, and regulatory updates without treating estimates as official data.
For the operator-level mechanics behind these market numbers, see our 2026 Michigan cannabis tax guide and guide to selling wholesale cannabis in Michigan.
If software is on your cost-review list, the Michigan cultivation software checklist gives you a practical way to test the work before committing to another system.
References
- Michigan Cannabis Regulatory Agency, Statistical Reports. April, May, and June 2026 monthly reports. Accessed August 1, 2026. Q2 sales and retail-price figures are summed or reported from those monthly releases.
- Michigan Department of Treasury, Price Guidance for July 1, 2026 to September 30, 2026. Flower: $641.41 per pound.
- Michigan CRA, July 2026 Monthly Report, adult-use product sales and active licenses, pages 13 and 18. Accessed September 14, 2026.
- Michigan Cannabis Regulatory Agency, Statistical Report index. Accessed September 14, 2026. Latest public 2026 monthly report listed: July.
Leave a Reply